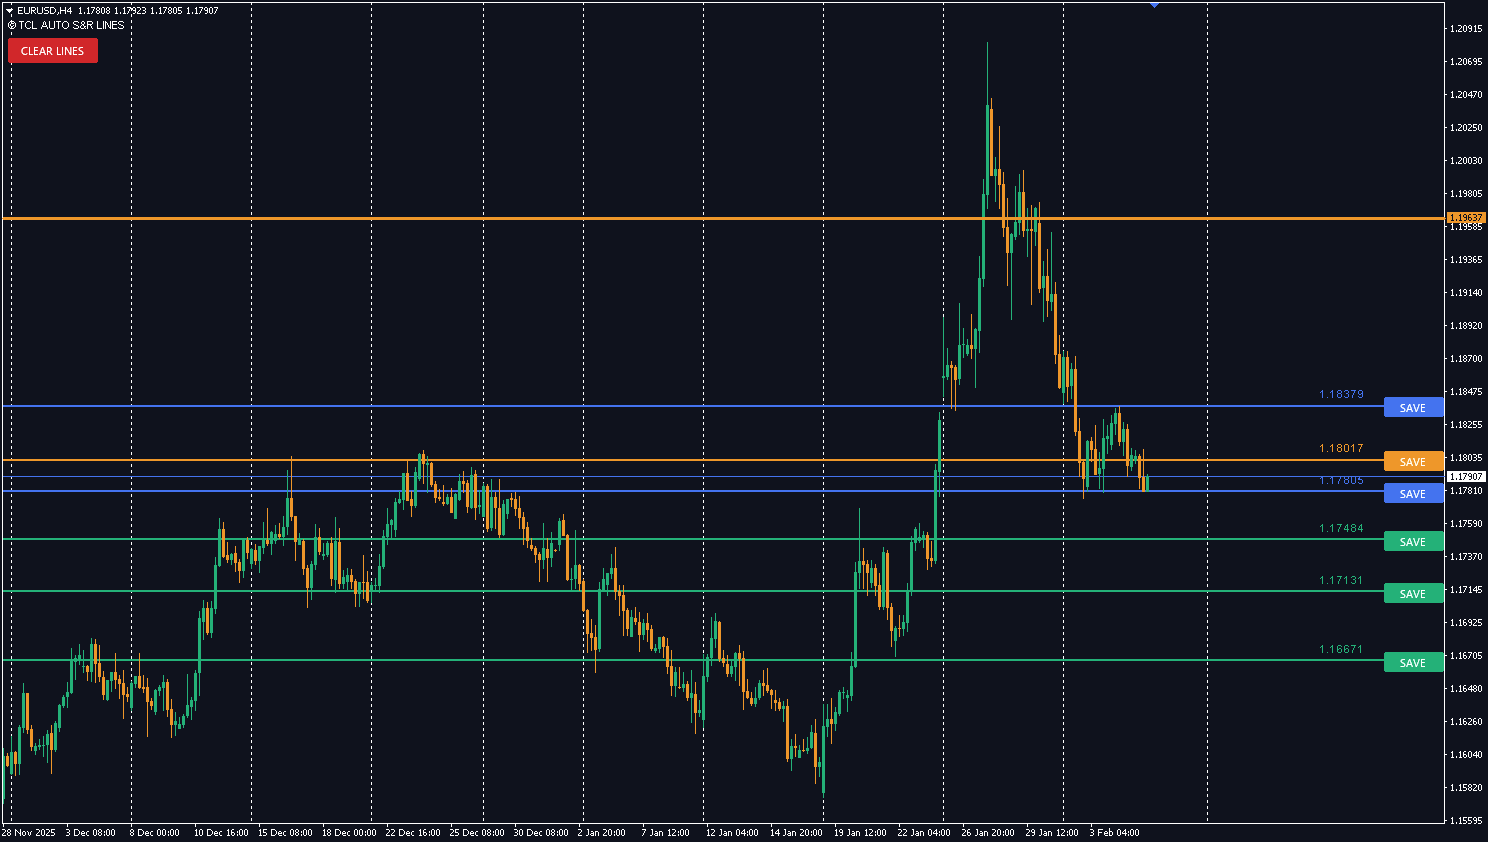
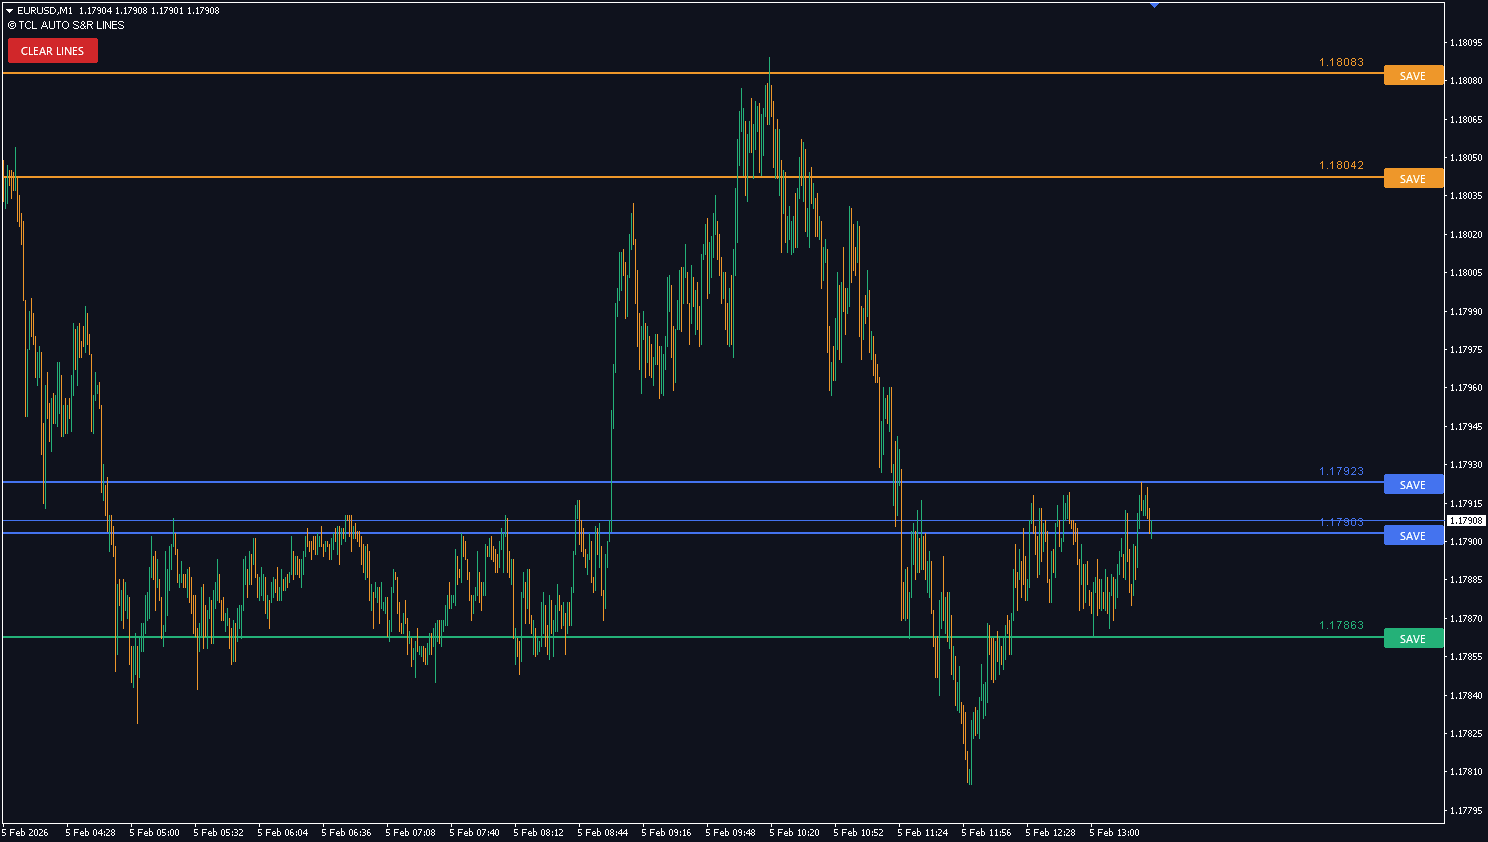
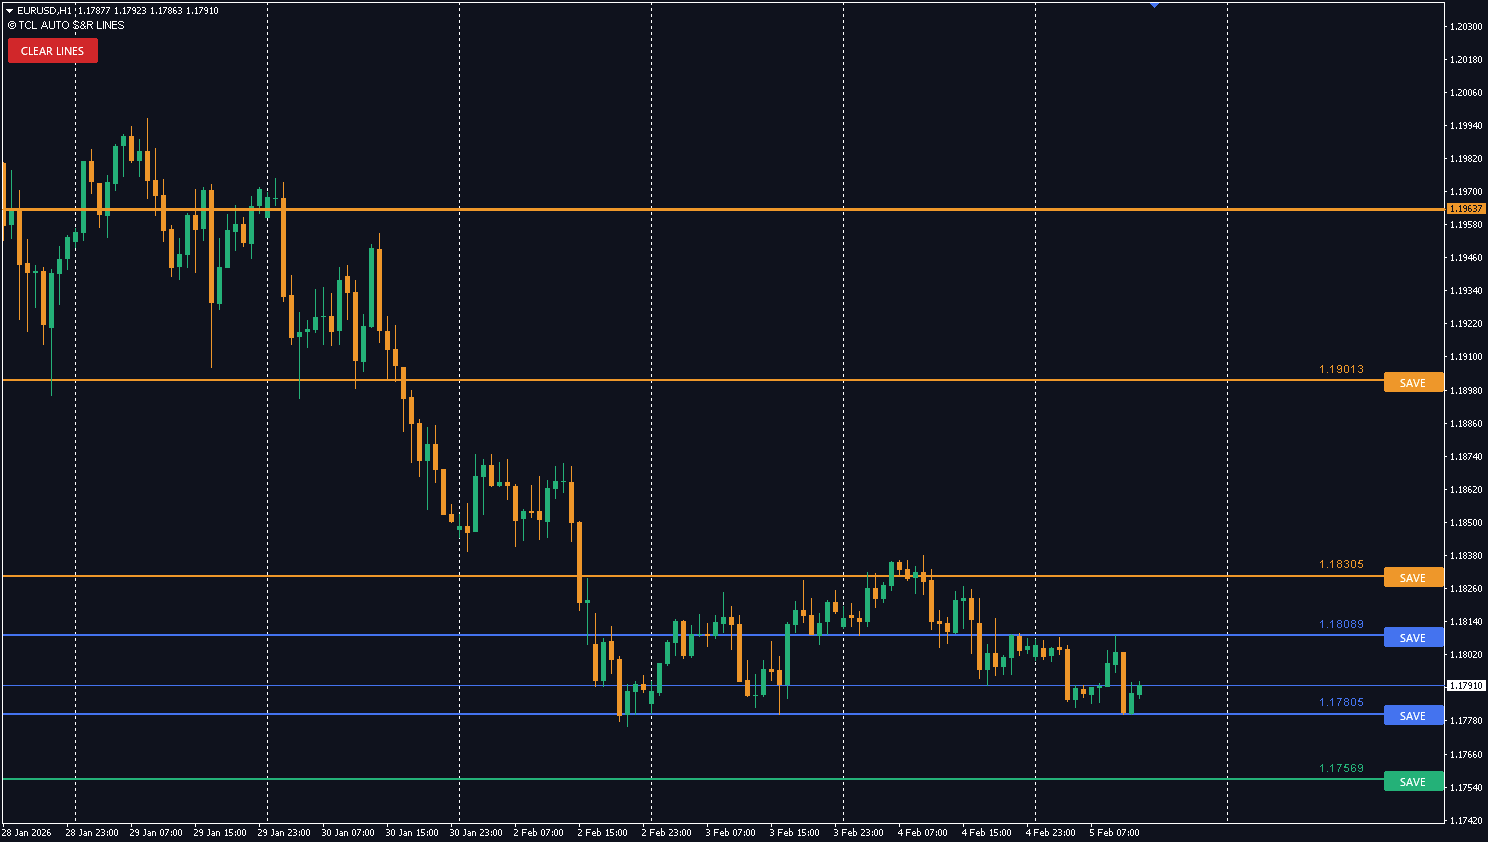
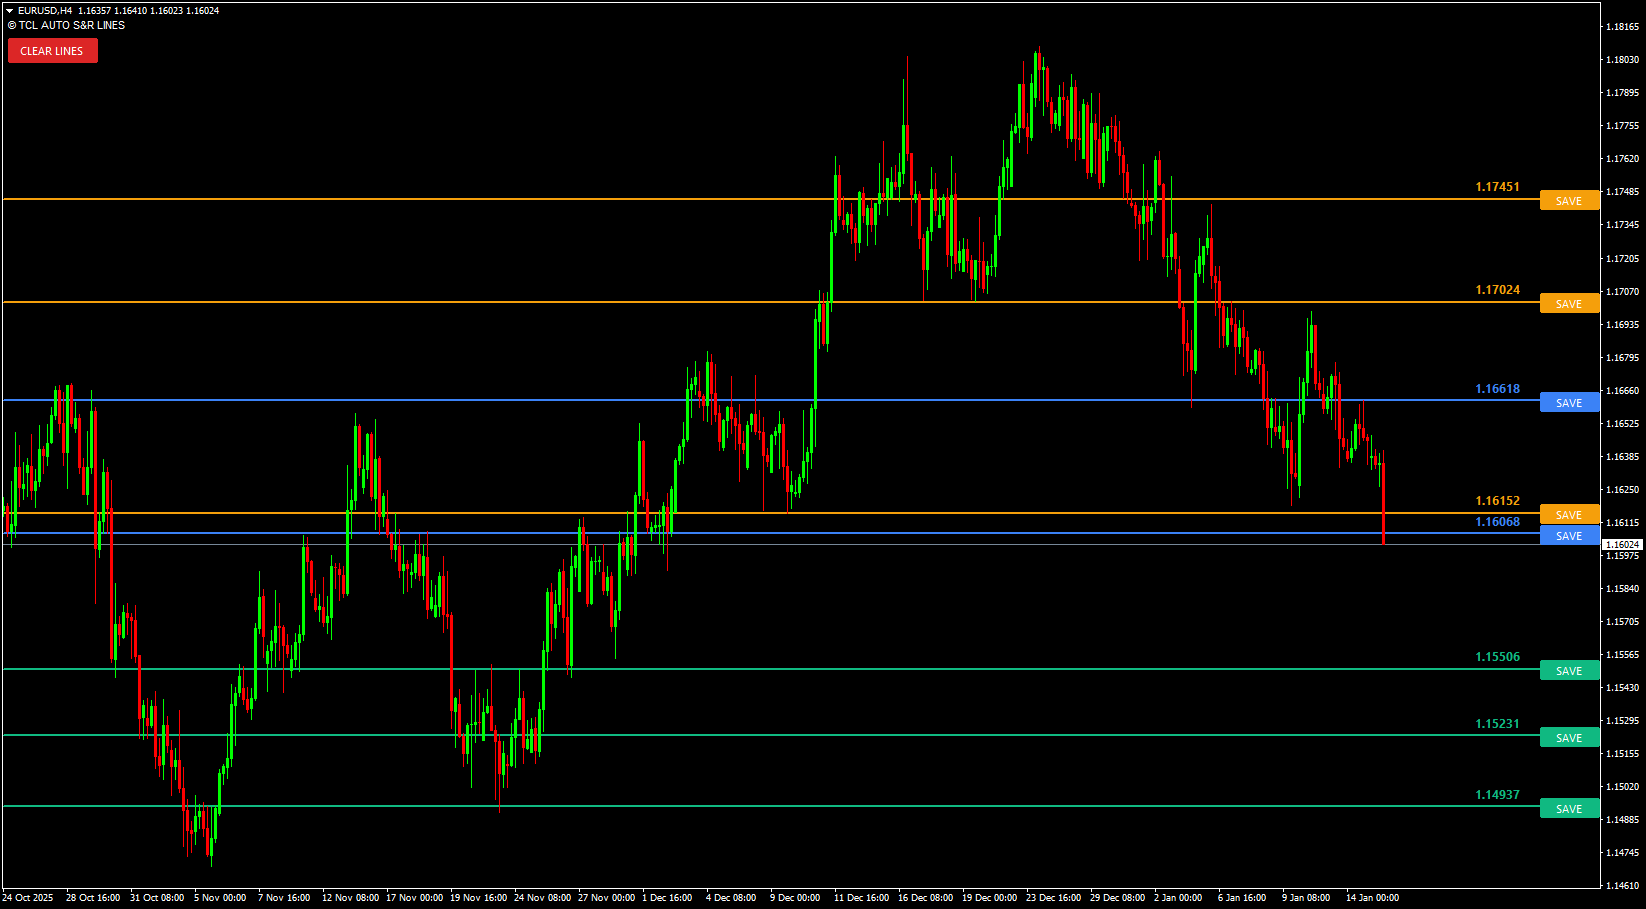
Drawing Support and Resistance (S&R) lines manually is subjective, tedious, and prone to human error. Most auto-indicators simply clutter your chart with hundreds of irrelevant lines. TCL Auto S&R Lines solves this by using a “Smart Collector” engine that filters noise and presents only the most significant reaction levels.
How It Works: The Hybrid Engine
Unlike standard tools that rely on a single calculation, this indicator combines two powerful market concepts:
Fractal Analysis: Scans historical highs and lows (default 1000 bars) to find structural pivot points.
ZigZag Confirmation: Overlays immediate price action data to validate recent turning points.
The proprietary Adaptive Merge Algorithm then processes these raw points. If multiple price touches occur within a specific pip range (adaptive to your timeframe), they are merged into a single, high-strength S&R line. This ensures you see clear zones of interest rather than a messy web of lines.
Exclusive Feature: “Lock It or Lose It”
Standard dynamic indicators “repaint”—meaning lines move or disappear as price evolves. We turned this into a feature. When the indicator identifies a fresh level, it draws a button next to it.
See a level you trust? Click “SAVE”.
The line instantly transforms into a permanent, solid locked line on your chart. It will remain there even if the automated engine moves on, allowing you to build a long-term map of the market while the indicator continues to hunt for new short-term setups.
Why It Is Better
Zero Clutter: Limits the view to your specified Max Levels (default 3 support / 3 resistance) to keep charts clean.
Interactive UI: Includes a “Clear Lines” dashboard button to instantly reset your analysis.
Smart Labels: Price labels automatically pin to the right axis and dodge chart obstacles, ensuring they are always readable.
How the Hybrid Detection Engine Works
Step
Method
What It Does
Step 1
Fractal Analysis
Scans 1000+ bars of historical highs and lows to find structural pivot points
Step 2
ZigZag Confirmation
Overlays recent price action to validate which pivots are still active turning points
Step 3
Adaptive Merge
If multiple touches occur within a pip range (auto-adjusted per timeframe), they merge into a single high-strength line
Step 4
Ranking
Only the top 3 Support and top 3 Resistance lines are displayed — the most significant levels
Pro Tip: The “Lock It or Lose It” Workflow
Let the indicator run — it will auto-identify the top S&R levels
When you see a level you trust (e.g., a key support with multiple touches), click “SAVE”
That line becomes permanent — it stays even if the indicator updates to new levels
Build your long-term market map over time by locking the levels that matter most
Use the “Clear Lines” dashboard button to reset and start fresh when needed
TCL Auto S&R Lines vs Other S&R Tools
Feature
Manual Drawing
Basic Auto S&R
TCL Auto S&R Lines
Detection method
Subjective — experience required
Single method (pivots only)
Hybrid: Fractal + ZigZag + Adaptive Merge
Chart clutter
Grows over time
High — dozens of lines
Low — max 3 Support + 3 Resistance
Level locking
Manual objects (persistent)
N/A — all lines move/repaint
Interactive “SAVE” button to lock levels
Merge logic
Manual overlap checking
None — duplicate lines
Adaptive Merge — close touches become one line
Multi-asset
Manual per instrument
Usually Forex only
Forex, Indices, Gold, Oil, Crypto
Reset option
Delete objects one by one
No
One-click “Clear Lines” button
Related Indicators
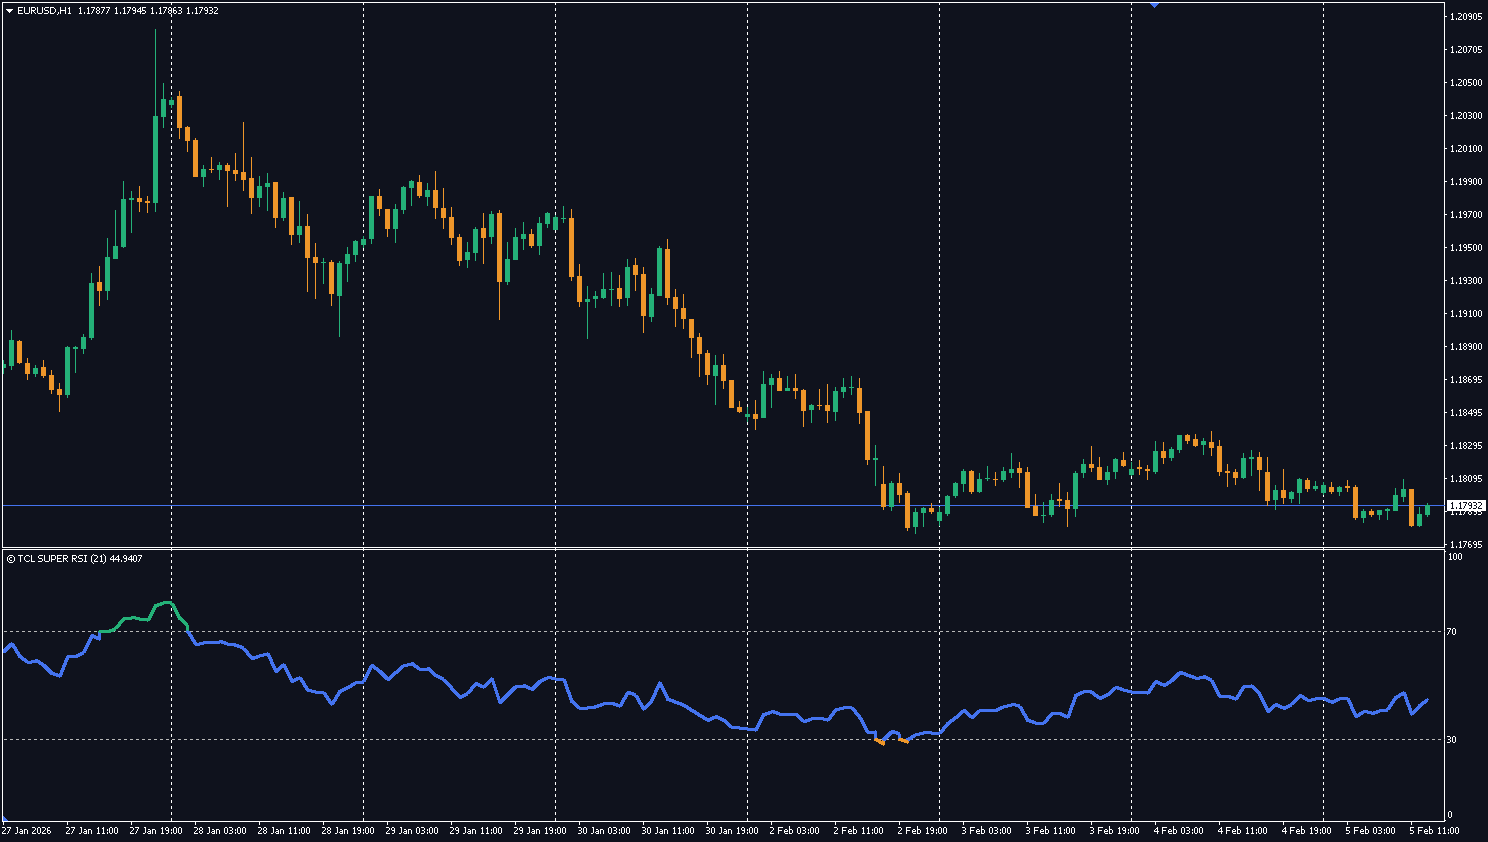
TCL Super RSI — RSI confirmation when price reaches S&R levels
TCL Auto Fibonacci — Fibonacci retracements for take-profit levels from S&R entries
Indicator Settings
Parameter
Default
Description
History Lookback (Bars)
1000
Number of historical bars to scan for high/low points
Fractal Sensitivity
5
Strength of the fractal scan (higher = significant pivots only)
Touch Verification Count
2
Minimum number of price rejections required to validate a level
Max Levels
3
Maximum number of Support/Resistance lines to show simultaneously
ZigDepth
5
Depth setting for the internal ZigZag filter
ZigDeviation
2
Deviation setting for the internal ZigZag filter
ZigBackstep
3
Backstep setting for the internal ZigZag filter
Support Line Color
C'16,185,129' (Teal)
Color for Support lines
Resistance Line Color
C'245,159,11' (Orange)
Color for Resistance lines
Close Zone Color
C'59,130,246' (Blue)
Color for immediate ZigZag zones
Line Thickness
2
Thickness of the automated lines
Version History
v1.00
Latest Oct 09, 2025
4.5
2 reviews
5 star
1
4 star
1
3 star
0
2 star
0
1 star
0
User Reviews (2)
A
alexk
January 20, 2026
The Lock button is brilliant. click SAVE on a level you trust and it stays on your chart permanently even when the indicator moves on to new levels. the hybrid fractal + zigzag detection finds stuff I would have missed manually and the merge algorithm keeps it clean instead of drawing 10 lines in a 15pip range
S
Simphiwe V.
March 5, 2026
Good S&R automation. I keep Max Levels at 3/3 for clean charts and the important zones always show up. Works well on EURUSD and GBPUSD H4. would like a way to see how many touches each level has but the Lock feature makes up for it
The automatic lines update dynamically to follow price structure. However, once you click the "SAVE" button on a line, it becomes permanent and will never repaint or move.
No, this is a visual chart mapping tool designed to help you plan trades interactively. It does not send pop-ups, push notifications, or emails.
To prevent chart clutter, the engine only displays the most significant "fresh" levels (default Top 3). If a level is broken or loses relevance, it is replaced by a better candidate automatically.
Yes, the Adaptive Merge engine automatically adjusts the pip-sensitivity range based on your current timeframe (from M1 up to Monthly).
Yes, the indicator reads the raw point value of the chart, so it works perfectly on Forex, Indices, Commodities (Gold/Oil), and Crypto pairs.
When the indicator identifies a fresh S&R level, it draws a "SAVE" button next to it. Click it to permanently lock that line on your chart — it stays even as the indicator updates to find new levels. This lets you build a long-term market map while the indicator hunts for short-term setups.
S&R lines are horizontal price levels derived from structural pivot points (fractal highs/lows). Supply & Demand zones are wider areas based on impulsive institutional moves. This indicator focuses on precise price lines, while the TCL Auto Supply & Demand indicator maps broader zones — use both for maximum confluence.
Yes — completely free. Create a free account, download the .ex4 file, and install on MT4. No limitations or premium unlock required.

User Reviews (2)
alexk
The Lock button is brilliant. click SAVE on a level you trust and it stays on your chart permanently even when the indicator moves on to new levels. the hybrid fractal + zigzag detection finds stuff I would have missed manually and the merge algorithm keeps it clean instead of drawing 10 lines in a 15pip range
Simphiwe V.
Good S&R automation. I keep Max Levels at 3/3 for clean charts and the important zones always show up. Works well on EURUSD and GBPUSD H4. would like a way to see how many touches each level has but the Lock feature makes up for it
Write a Review