FREE
MT4
MT5
(1 Reviews)
70+ Installs
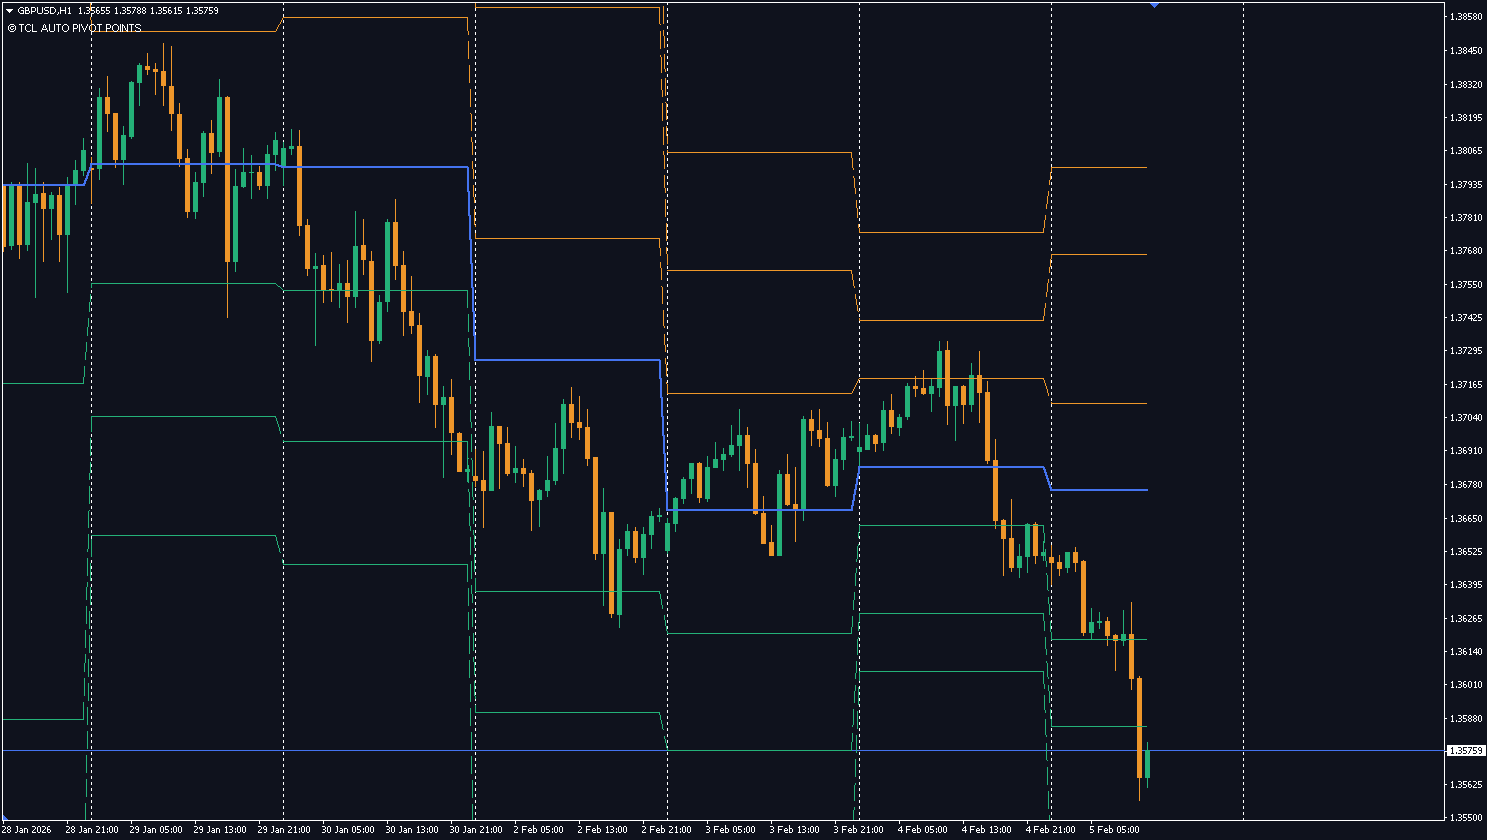
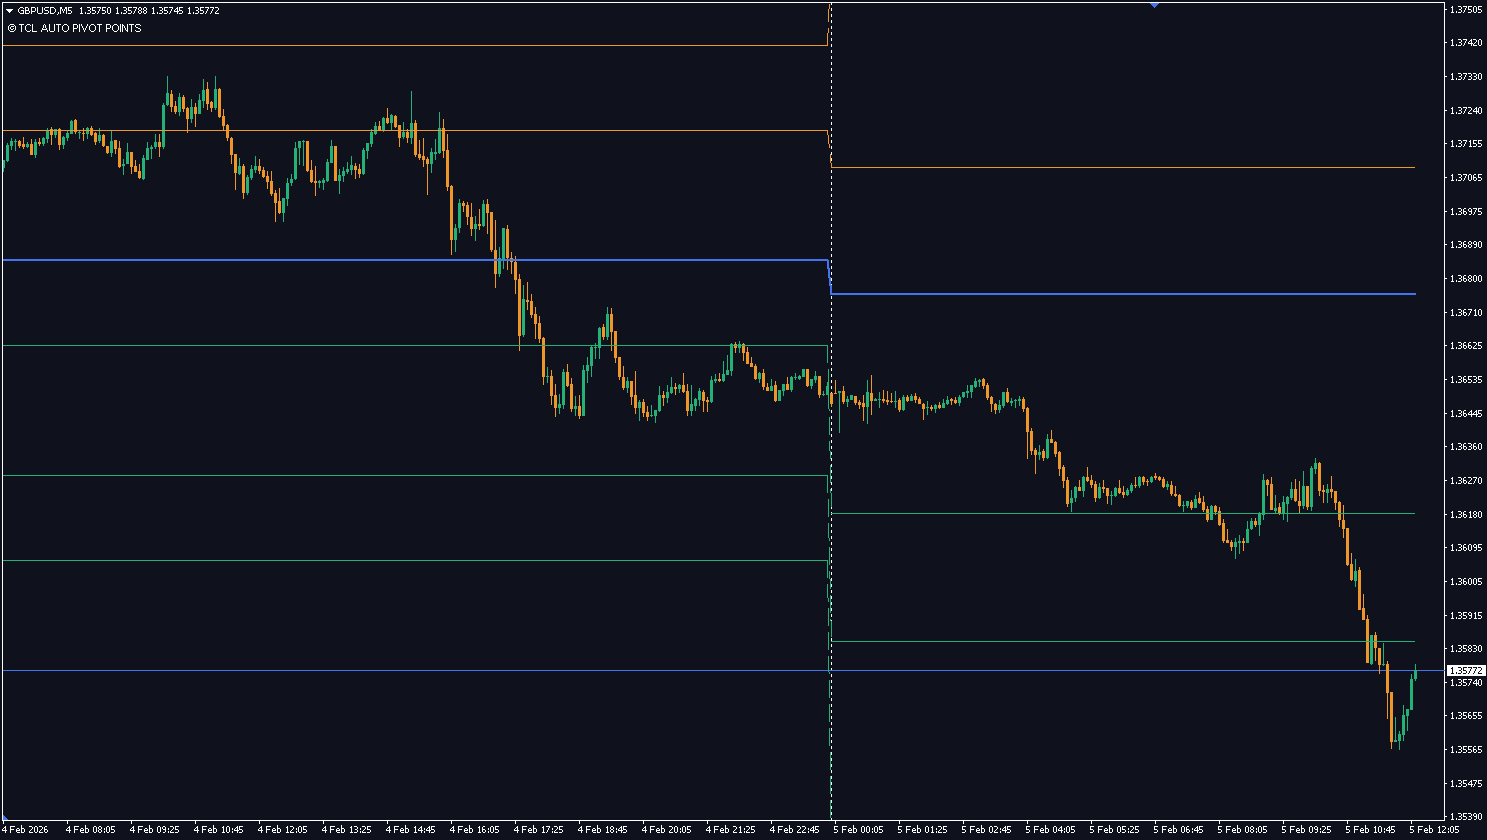
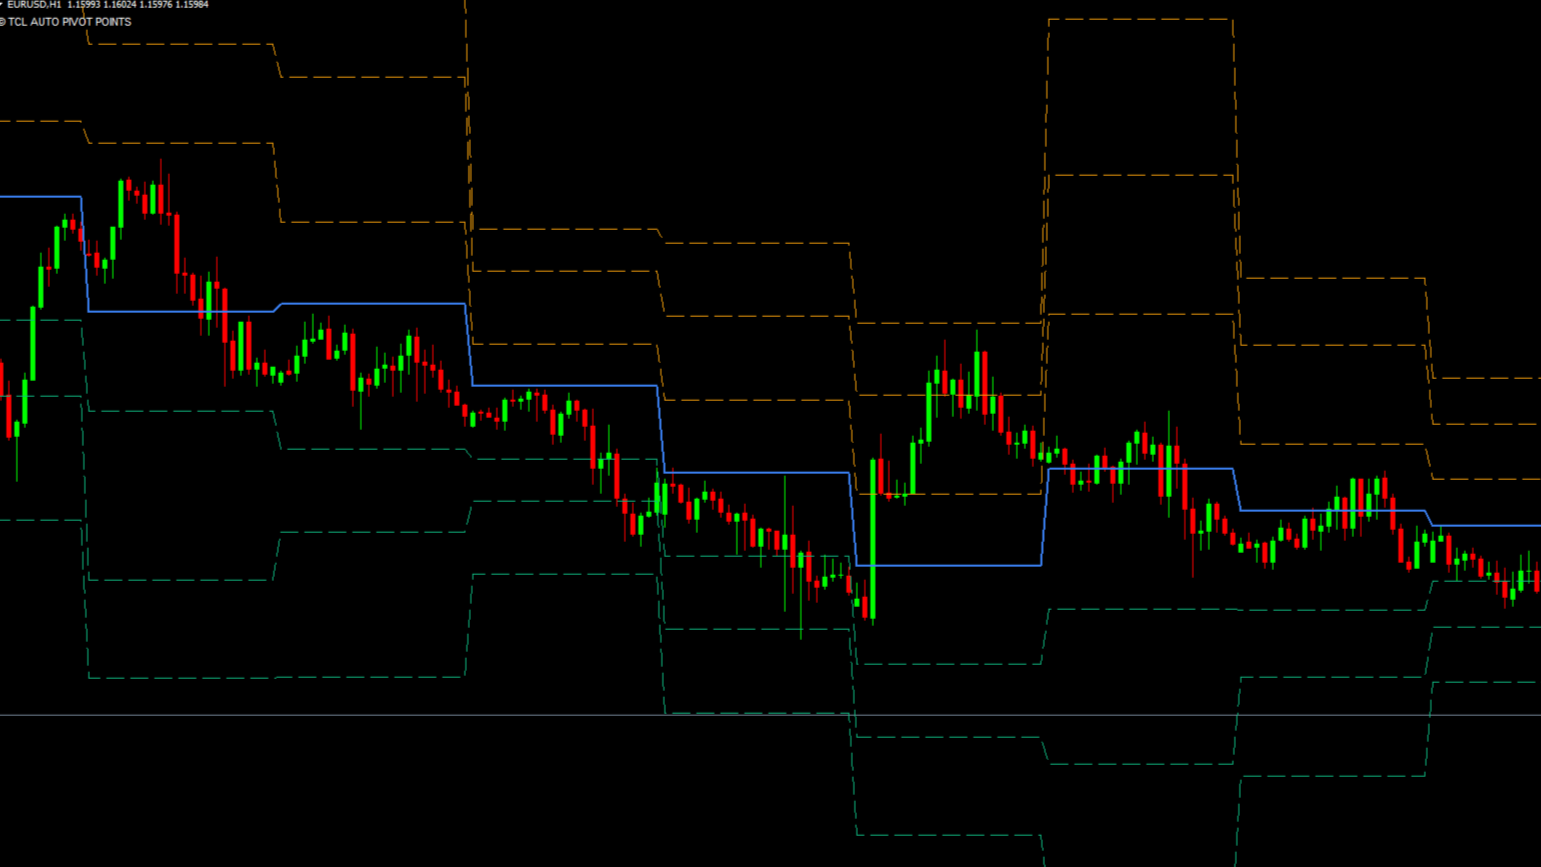
TCL AUTO PIVOT POINTS
Forget manual lines. Automatically plot accurate Classic, Fibonacci, Woodie, or Camarilla pivot points based on Daily, Weekly, or Monthly data.
FREE
4 Calculation Modes
Auto-Timeframe Detection
Institutional Levels (R3-S3)
Non-Repainting Levels
Create a free account to access.
User Reviews (1)
Danilo Motta
I use the Fibonacci pivot mode and the 38.2/61.8 levels are spot on. auto-timeframe detection is nice, it switches between daily weekly monthly pivots depending on what chart youre on. Has Classic Woodie and Camarilla modes too. R2/S2 are perfect for TP placement
Write a Review