A complete "Strategy-in-a-Box" that combines Dual-Deviation Bollinger Bands, RSI exhaustion, and a multi-factor Trend Filter to trade high-probability reversals without catching falling knives.
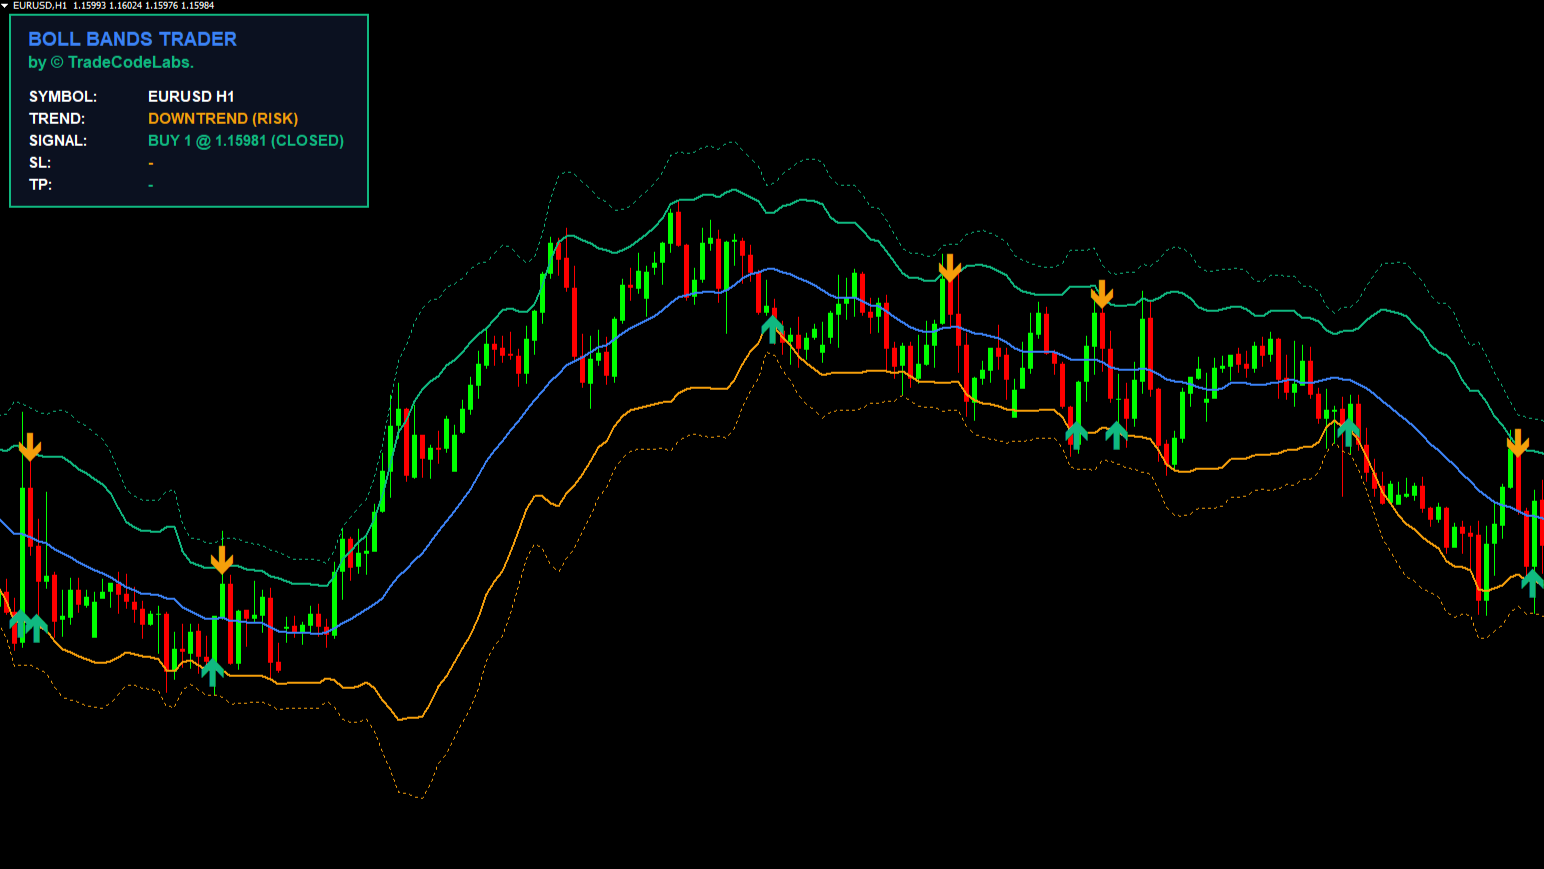
Bollinger Bands are famous for “Mean Reversion”—the statistical probability that price will snap back to the average after an extreme move. However, novice traders often lose their accounts because they blindly buy every time price touches the lower band. In a market crash or strong rally, price can “ride the bands” for days, triggering buy signal after buy signal that all fail. This is known as catching a falling knife.
The Solution: The “Trend Filter”
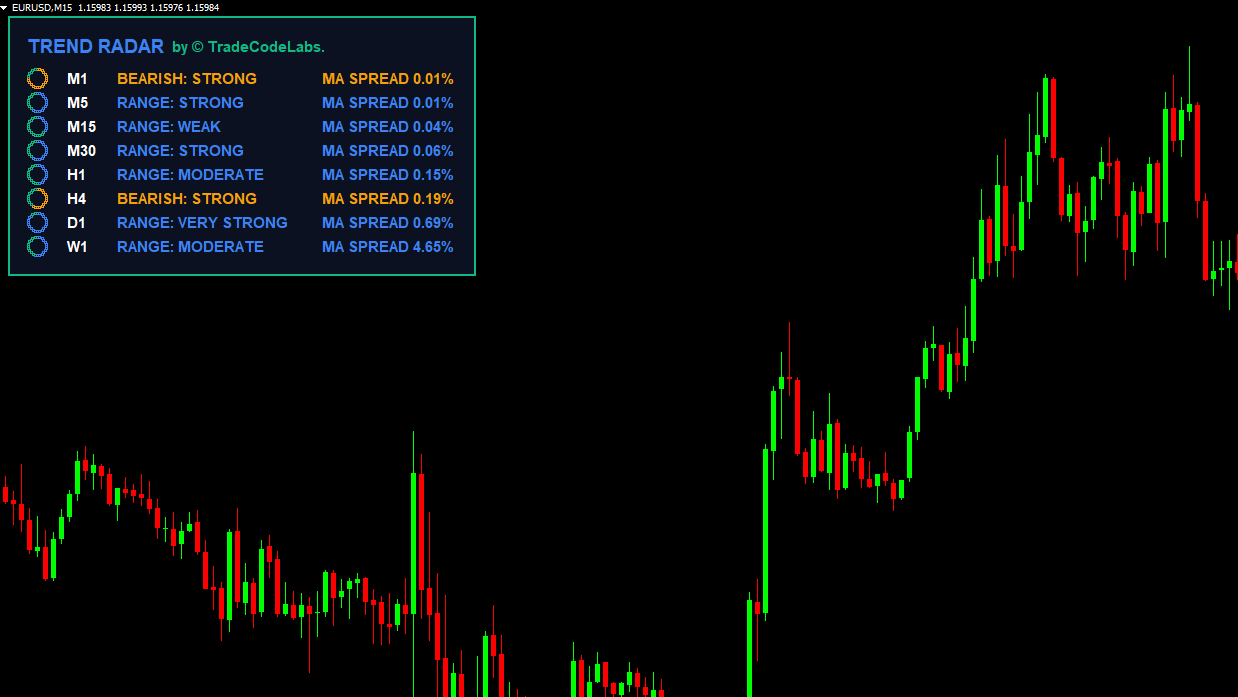
TCL Bollinger Bands Trader solves this by forcing every potential signal to pass a rigorous background check before it appears on your chart. The built-in “Trend Filter” analyzes market structure using three distinct metrics:
Moving Average (50 EMA): Determines the baseline directional bias.
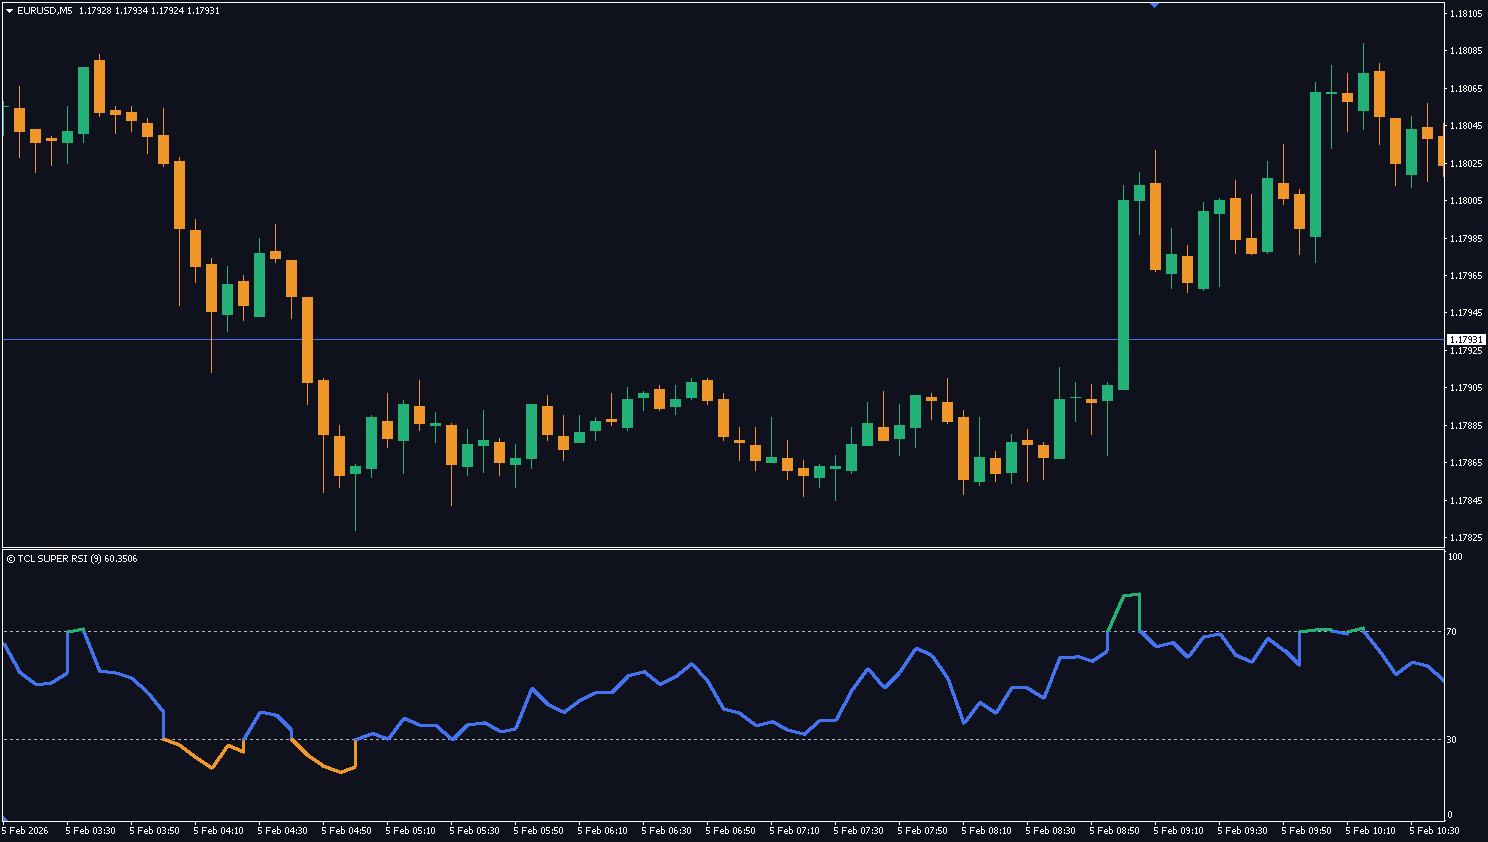
RSI (14): Checks for momentum validation (>55 for Uptrend, <45 for Downtrend).
MACD (12, 26, 9): Confirms volume pressure.
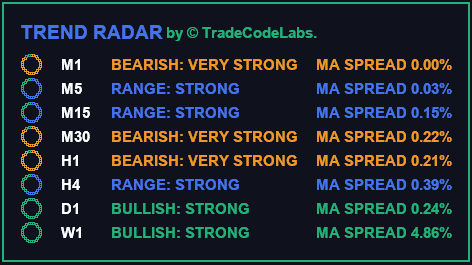
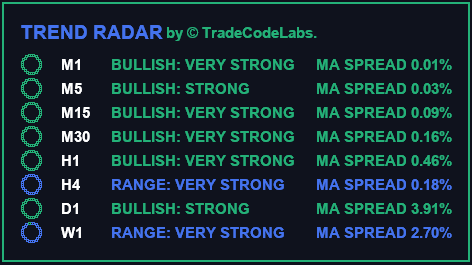
The Result: If the Trend Filter detects a strong “Super-Trend,” it blocks counter-trend signals. It protects you from trading against a runaway market, only allowing reversals when the market shows signs of weakness or ranging behavior.
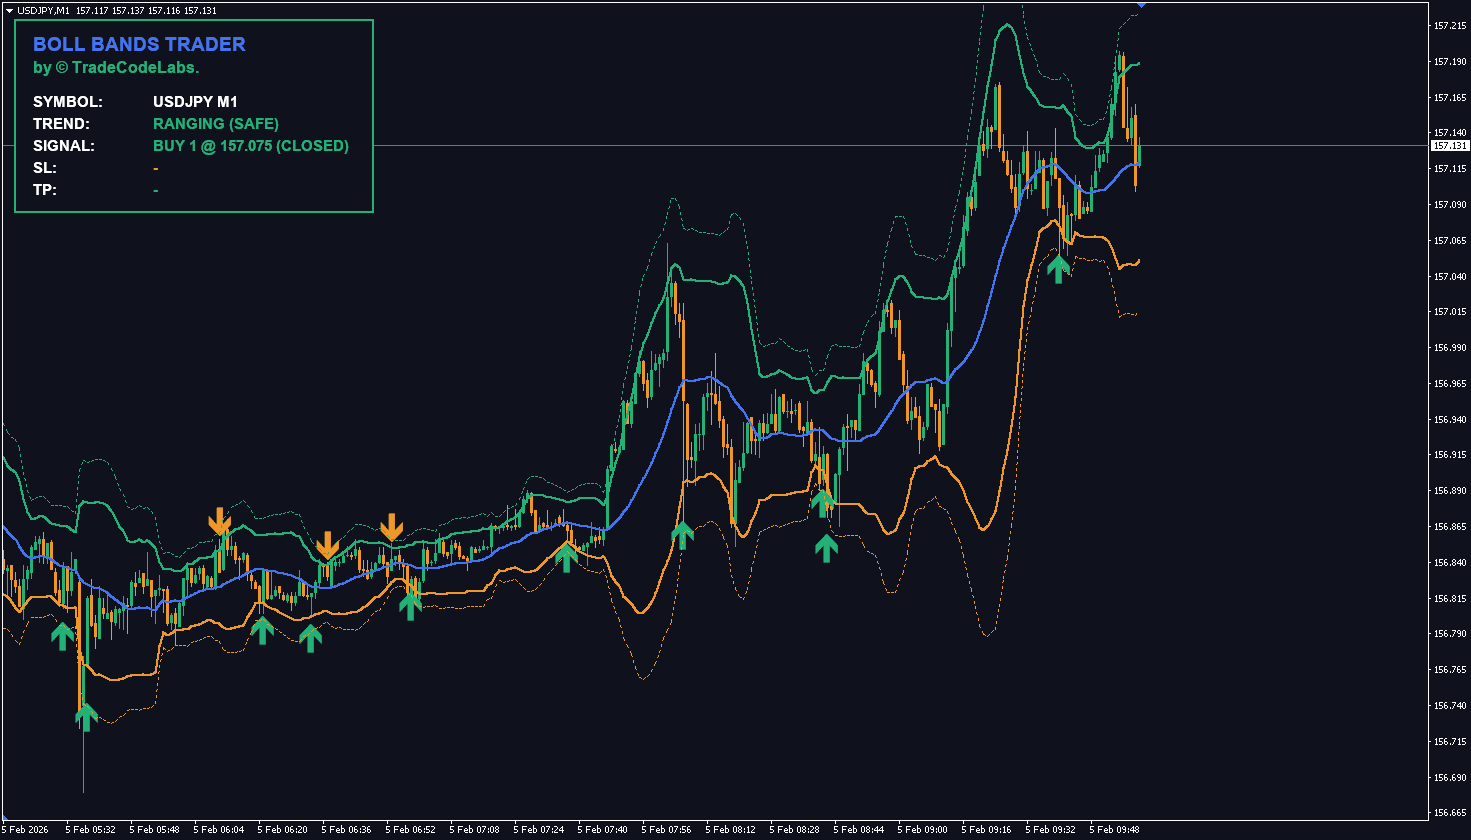
Dual-Layer Entry System
Professional traders rarely go “all in” on the first touch. This indicator supports a tiered entry approach:
Signal 1 (Standard): Triggered when price pierces the **2.0 Deviation** Band AND RSI is overextended. This is your primary entry for normal volatility.
Signal 2 (Extreme): Triggered when price stretches further to the **3.0 Deviation** Band. This highlights rare, 3-sigma events, often used for “scaling in” or aggressive sniper entries.
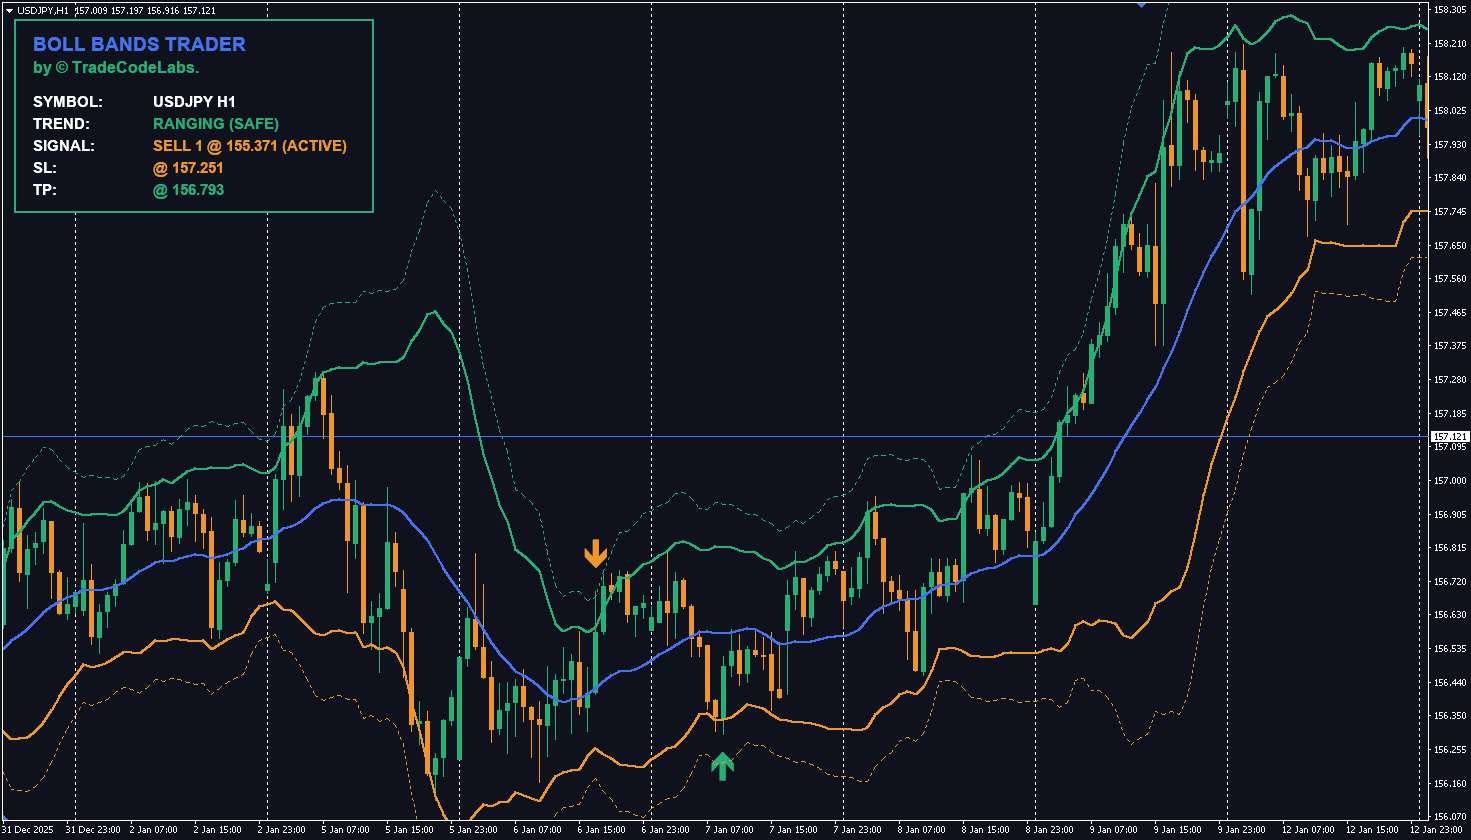
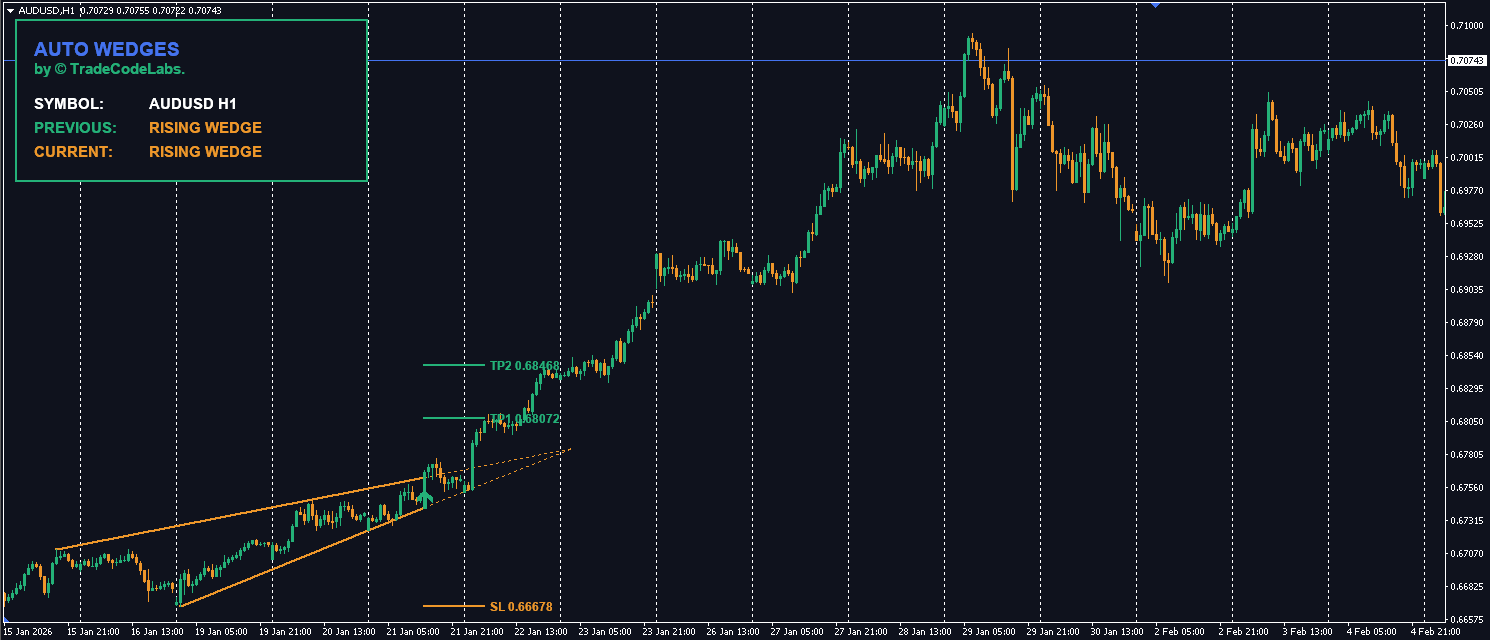
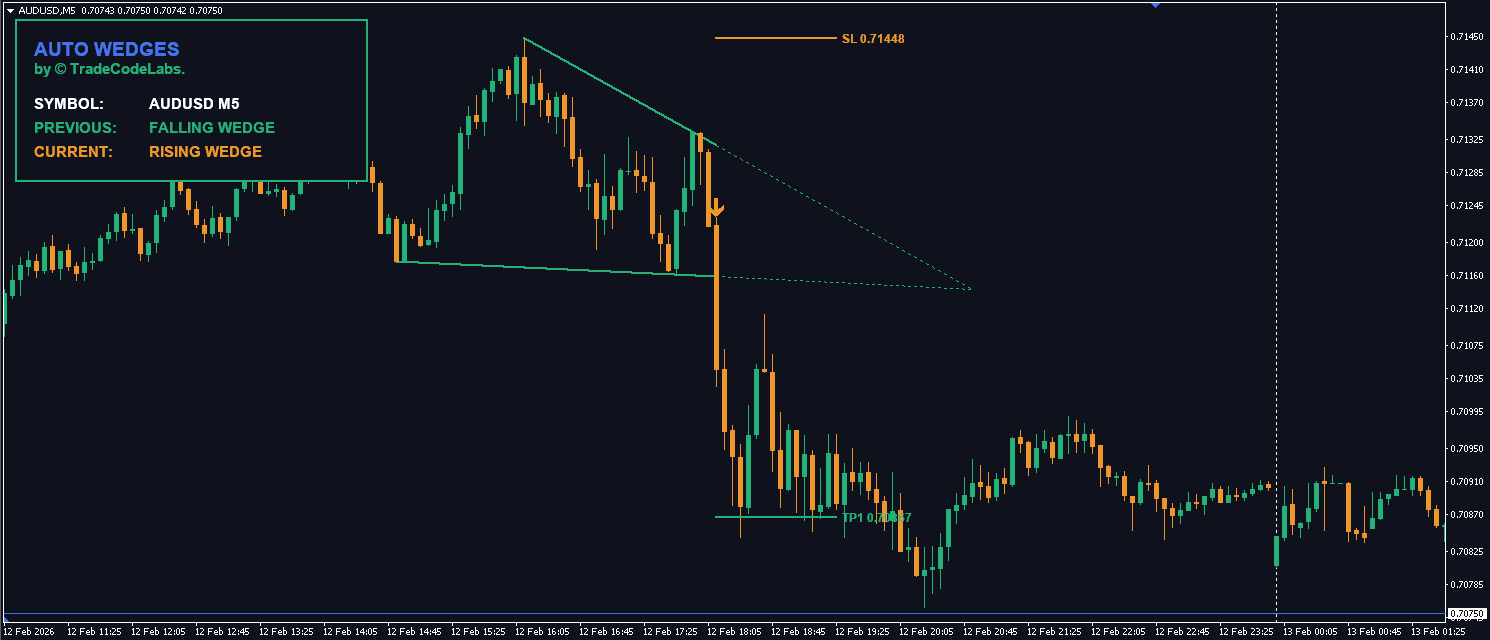
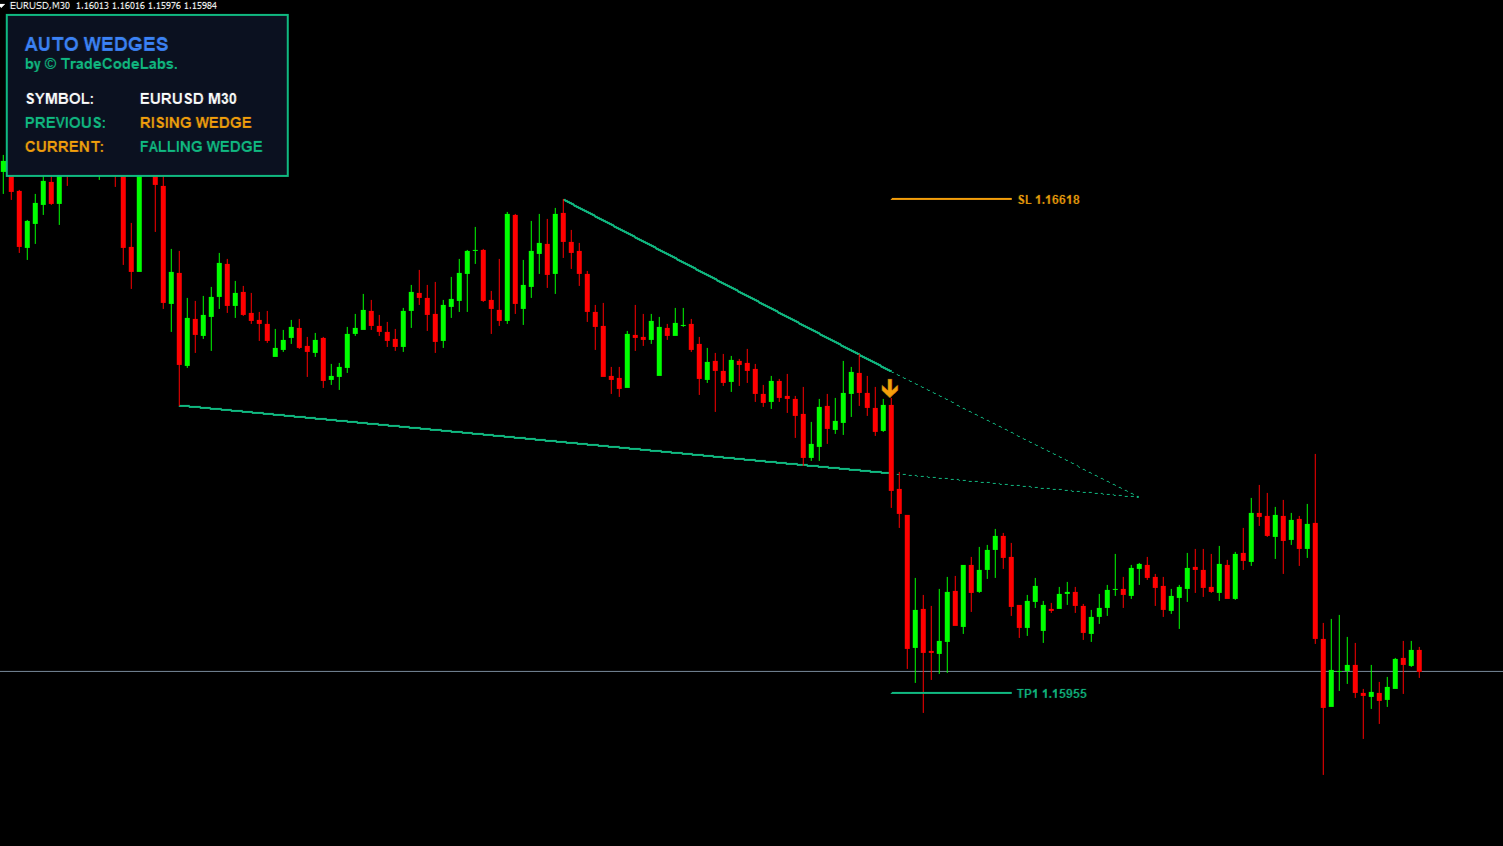
Smart Trade Management
The indicator doesn’t just give you an arrow; it gives you a plan. The on-chart Strategy Dashboard calculates your Stop Loss (based on fixed pips) and a Dynamic Take Profit that automatically adjusts to the Middle Band. As the market moves, your target moves, ensuring you exit exactly when price returns to the statistical mean.
Signal Level 1 vs Level 2 – When to Use Each
Signal
Deviation
RSI Condition
Best For
Risk Level
Level 1 (Standard)
2.0 σ
RSI overextended
Normal volatility — primary entries
Moderate
Level 2 (Extreme)
3.0 σ
RSI deeply oversold/overbought
Rare 3-sigma events — scale-in or sniper entries
Lower (higher probability)
Pro Tip: Use Level 1 as your main entry, then add to the position if price stretches to Level 2. This “scaling in” approach gives you a better average entry price while the 3-sigma level statistically has a very high reversion probability.
How the Trend Filter Protects You
The Trend Filter runs a 3-part background check before allowing any signal:
Component
What It Checks
Condition for Buy
Condition for Sell
50 EMA
Directional bias
Price above EMA
Price below EMA
RSI (14)
Momentum health
RSI > 55 (uptrend)
RSI < 45 (downtrend)
MACD (12,26,9)
Volume pressure
MACD bullish
MACD bearish
If all 3 confirm a “Super-Trend,” counter-trend signals are blocked — protecting you from buying into a crash or selling into a rally. You can disable this filter by setting Enable Trend Filter = false if you want to see all band touches.
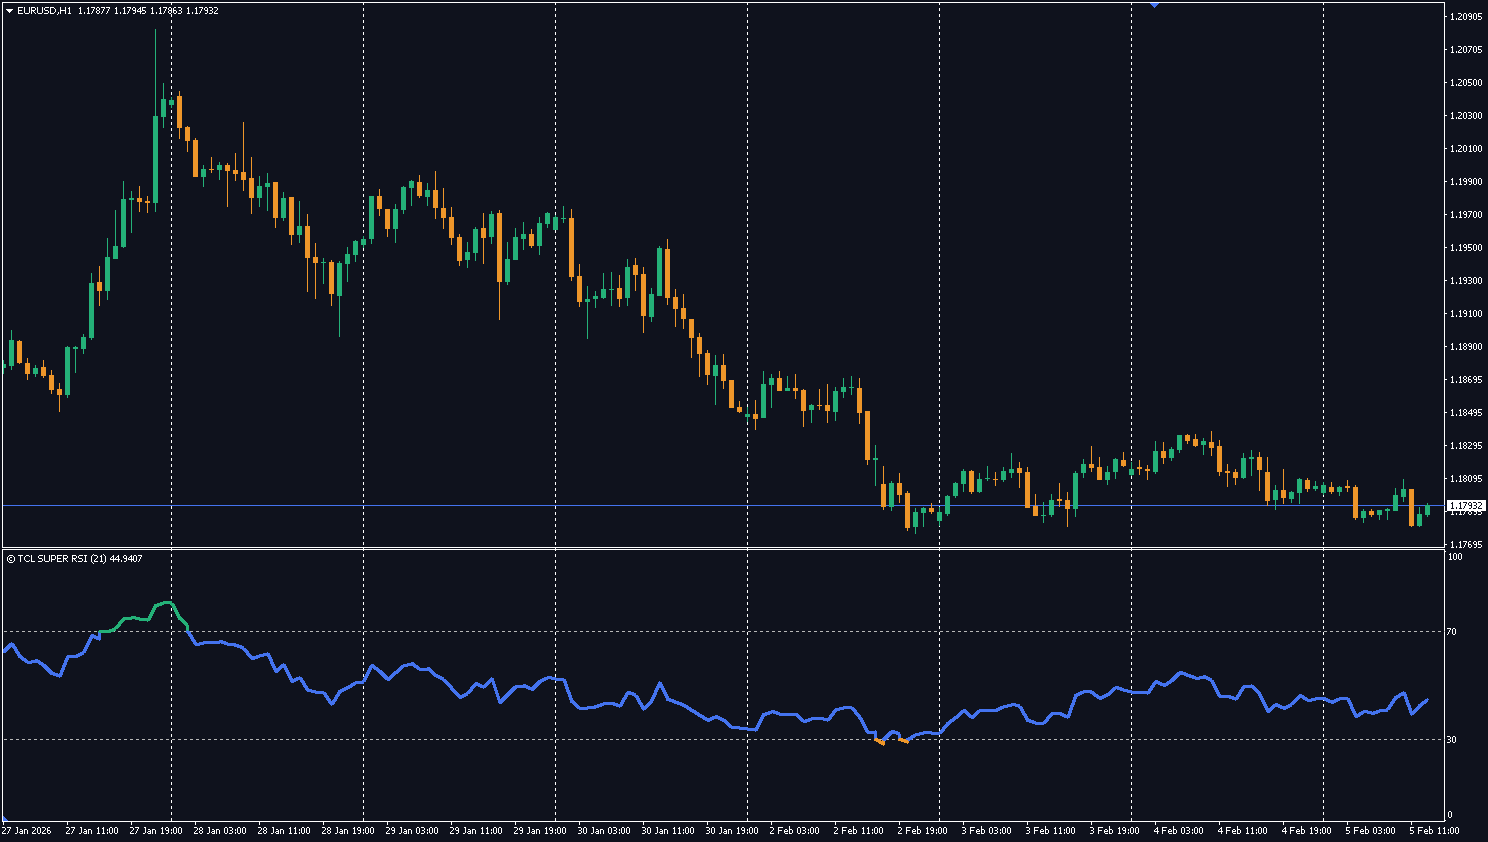
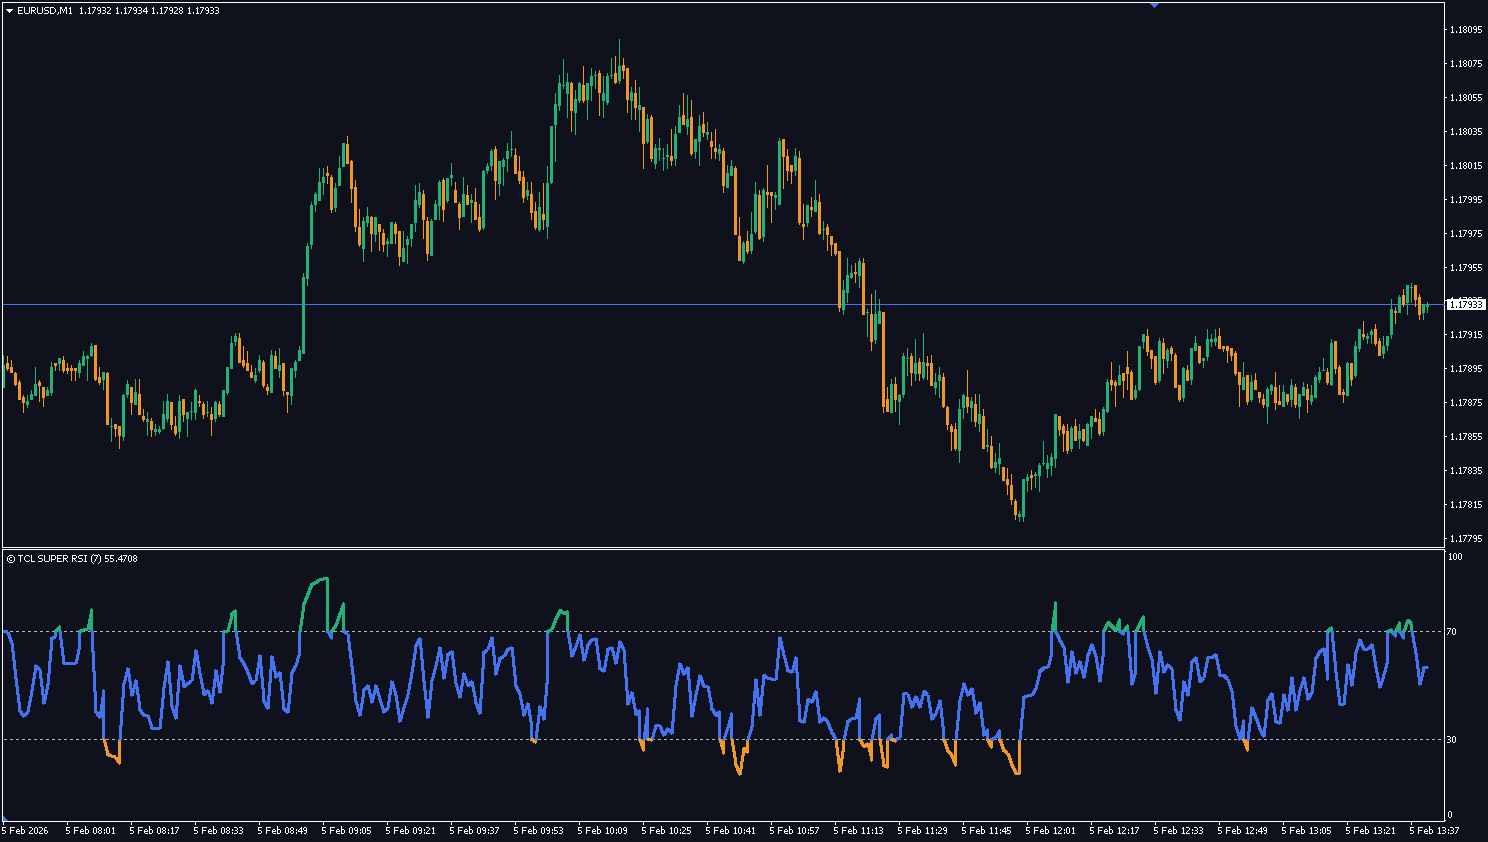
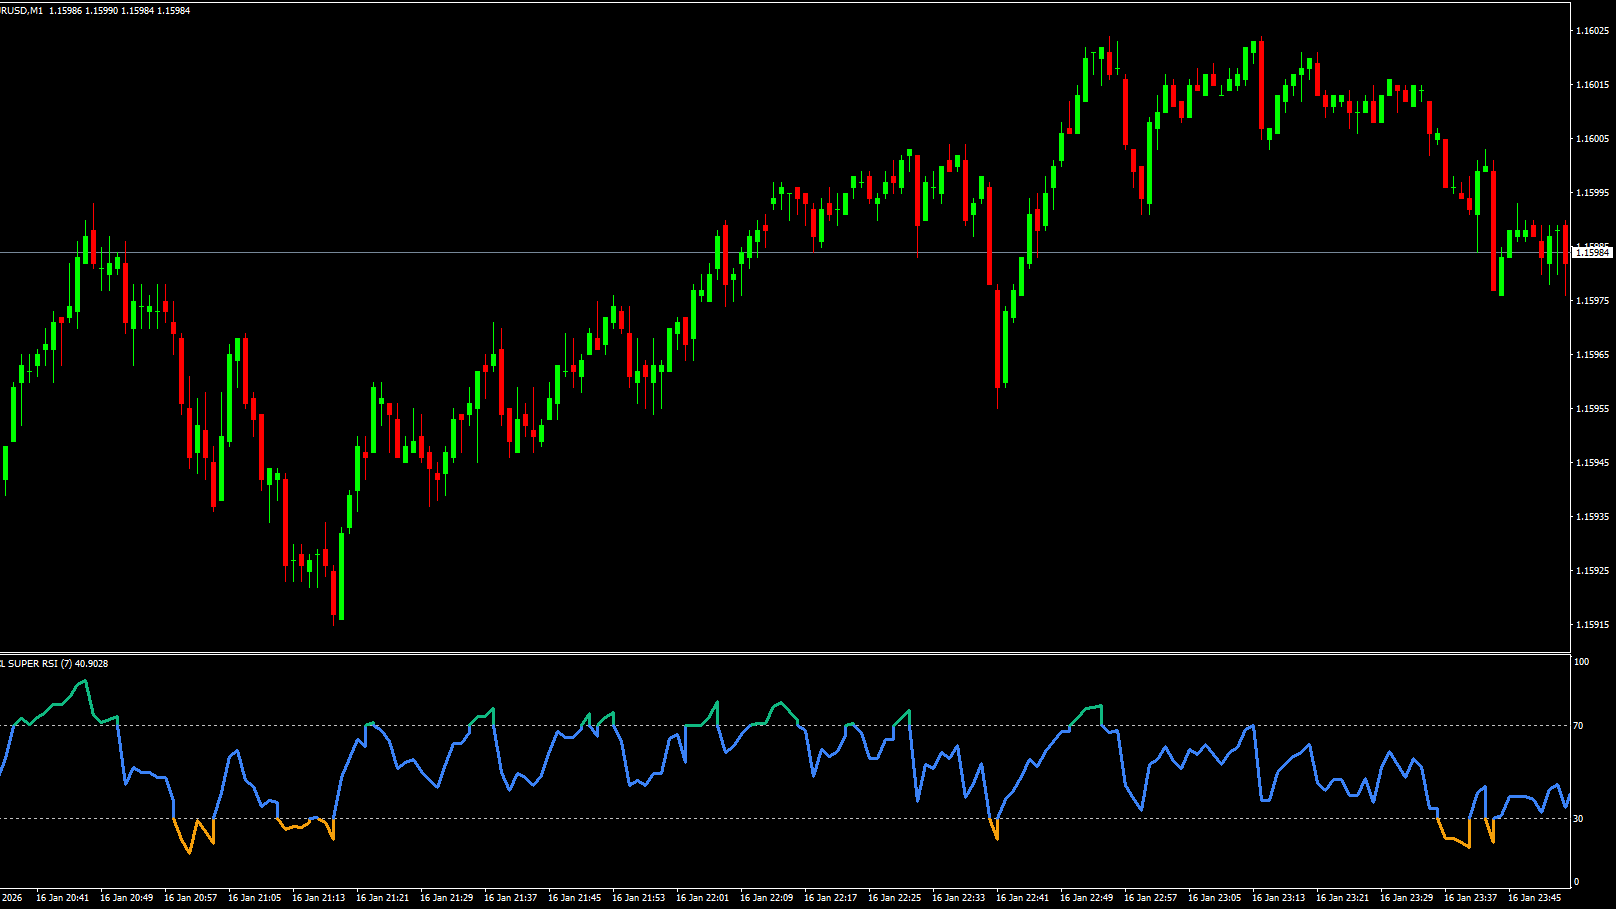
Related Indicators
TCL Super RSI — Enhanced RSI with overbought/oversold trading system
Session Timing: GMT timezone definitions with DST toggles for Sydney, London, and NY.
Performance Fixes: Max_Calc_Bars limit to prevent freezing, plus $O(1)$ Squeeze/ATR caching logic.
4.4
7 reviews
5 star
4
4 star
2
3 star
1
2 star
0
1 star
0
User Reviews (8)
S
slawko86
December 15, 2025
Really well thought out. The live dashboard showing current signal status and RSI state is super helpful. Only minor complaint is the dynamic TP to the middle band sometimes closes me out too early on strong trends. would like a fixed TP option too.
S
Sfiso Nkabane
December 18, 2025
The dual-layer entry system is what separates this from every other Bollinger indicator. Level 1 at 2.0 sigma for normal entries, Level 2 at 3.0 sigma for rare extreme setups. I scale in using both and the trend filter saved me from catching falling knives on GBPUSD during the December crash.
T
TOSEEF ADIL
January 4, 2026
upgraded from the free version of another BB indicator and the difference is night and day. the EMA+RSI+MACD composite trend filter actually works, no more catching falling knives on EURUSD. cant believe this is free tbh
M
Mpouki L.
January 28, 2026
I trade mainly mean reversions on H4 and this is perfect for that. When price hits the 3.0 deviation band with RSI deeply oversold its basically a guaranteed snapback. Got 4 profitable trades in a row on AUDUSD last week using just Level 2 signals.
V
vgkirans
February 19, 2026
works well on forex pairs but I had some issues on indices. The RSI filter seems calibrated for forex volatility, on US30 it filters out too many valid Level 1 signals. If you trade forex its great, just be aware on other instruments. The v2.0 SL/TP visualizer is really nice addition tho
TCL
TCL Team
February 24, 2026
Thanks for the detailed feedback. You’re right that the default RSI thresholds work best on forex pairs. For indices we’d suggest widening the overbought/oversold levels in the settings. We’ve addressed this in a recent update so please re-download and give it a try.
H
Hai Nguyen
March 10, 2026
Strategy in a box is the right description. I was skeptical but after 2 months on demo I moved to live and the trend filter blocking counter-trend signals has been consistently profitable on USDJPY H1. The v2.0 click-to-copy SL/TP is such a nice quality of life feature.
J
Jittapon
April 12, 2026
Very good indicator. Clean signals, good filtering, nice dashboard you can minimize per symbol. I pair it with TCL Power Meter to find which pairs have the strongest moves and then use boll bands trader for mean reversion entries. solid combo
Level 1 signals trigger at the standard deviation (2.0) and are heavily filtered by the trend engine. Level 2 signals trigger at the extreme deviation (3.0) — these are rare "over-extended" reversals that are often valid even against the trend.
The bands themselves do not repaint. Signal arrows appear when price touches the band and the RSI condition is met. The live dashboard locks the signal once confirmed on the current bar to prevent flickering.
It combines a 50 EMA, RSI, and MACD. For a Buy signal to be valid at Level 1, price must be above the EMA, RSI must be healthy (>55), and MACD must be bullish. If these conditions aren't met, the indicator treats the "dip" as a breakout and ignores it.
Yes. Set "Enable Trend Filter" to false if you want to see every single band touch, regardless of the trend direction.
Mean reversion is the statistical concept that price tends to return to its average after extreme moves. This indicator identifies when price stretches to the outer Bollinger Bands (2.0 or 3.0 standard deviations) and generates reversal signals back to the middle band (the mean).
The Take Profit dynamically adjusts to the Middle Band (20 SMA). As the market moves, your target moves with it — ensuring you exit exactly when price returns to the statistical mean.
Yes — the TCL Boll Bands Trader is completely free. Create a free account, download the .ex4 file, and install it on MT4. No limitations or premium unlock required.


User Reviews (8)
slawko86
Really well thought out. The live dashboard showing current signal status and RSI state is super helpful. Only minor complaint is the dynamic TP to the middle band sometimes closes me out too early on strong trends. would like a fixed TP option too.
Sfiso Nkabane
The dual-layer entry system is what separates this from every other Bollinger indicator. Level 1 at 2.0 sigma for normal entries, Level 2 at 3.0 sigma for rare extreme setups. I scale in using both and the trend filter saved me from catching falling knives on GBPUSD during the December crash.
TOSEEF ADIL
upgraded from the free version of another BB indicator and the difference is night and day. the EMA+RSI+MACD composite trend filter actually works, no more catching falling knives on EURUSD. cant believe this is free tbh
Mpouki L.
I trade mainly mean reversions on H4 and this is perfect for that. When price hits the 3.0 deviation band with RSI deeply oversold its basically a guaranteed snapback. Got 4 profitable trades in a row on AUDUSD last week using just Level 2 signals.
vgkirans
works well on forex pairs but I had some issues on indices. The RSI filter seems calibrated for forex volatility, on US30 it filters out too many valid Level 1 signals. If you trade forex its great, just be aware on other instruments. The v2.0 SL/TP visualizer is really nice addition tho
TCL
TCL TeamThanks for the detailed feedback. You’re right that the default RSI thresholds work best on forex pairs. For indices we’d suggest widening the overbought/oversold levels in the settings. We’ve addressed this in a recent update so please re-download and give it a try.
Hai Nguyen
Strategy in a box is the right description. I was skeptical but after 2 months on demo I moved to live and the trend filter blocking counter-trend signals has been consistently profitable on USDJPY H1. The v2.0 click-to-copy SL/TP is such a nice quality of life feature.
Jittapon
Very good indicator. Clean signals, good filtering, nice dashboard you can minimize per symbol. I pair it with TCL Power Meter to find which pairs have the strongest moves and then use boll bands trader for mean reversion entries. solid combo
Write a Review