Most volatility indicators, like Bollinger Bands, assume that market moves are normally distributed and symmetric. However, experienced traders know that price action is often skewed—panic selling is faster than buying. The TCL S&Q Super Bands addresses this by offering two superior calculation methods for defining Overbought and Oversold zones.
Two Powerful Modes
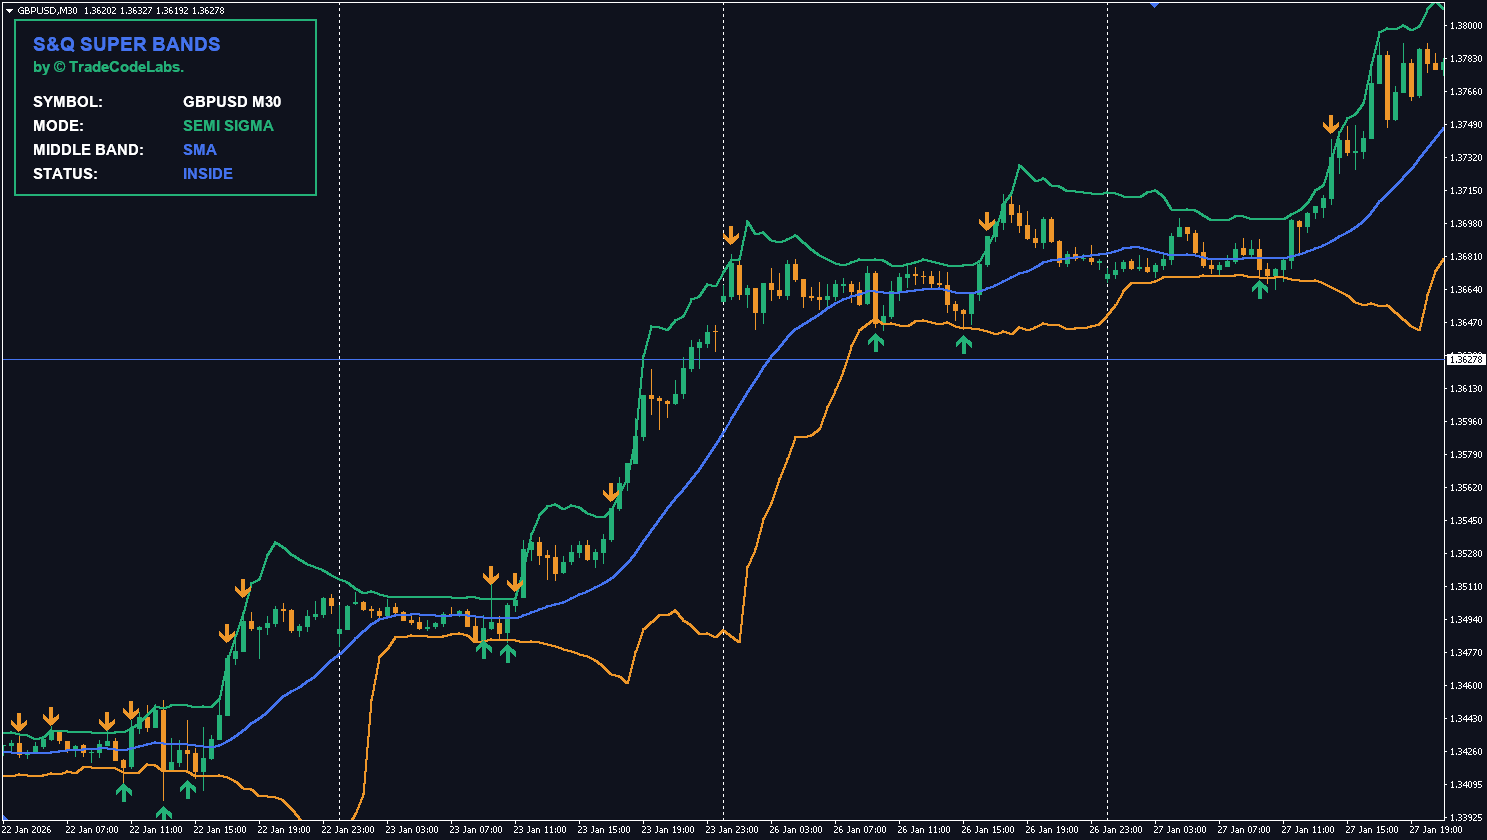
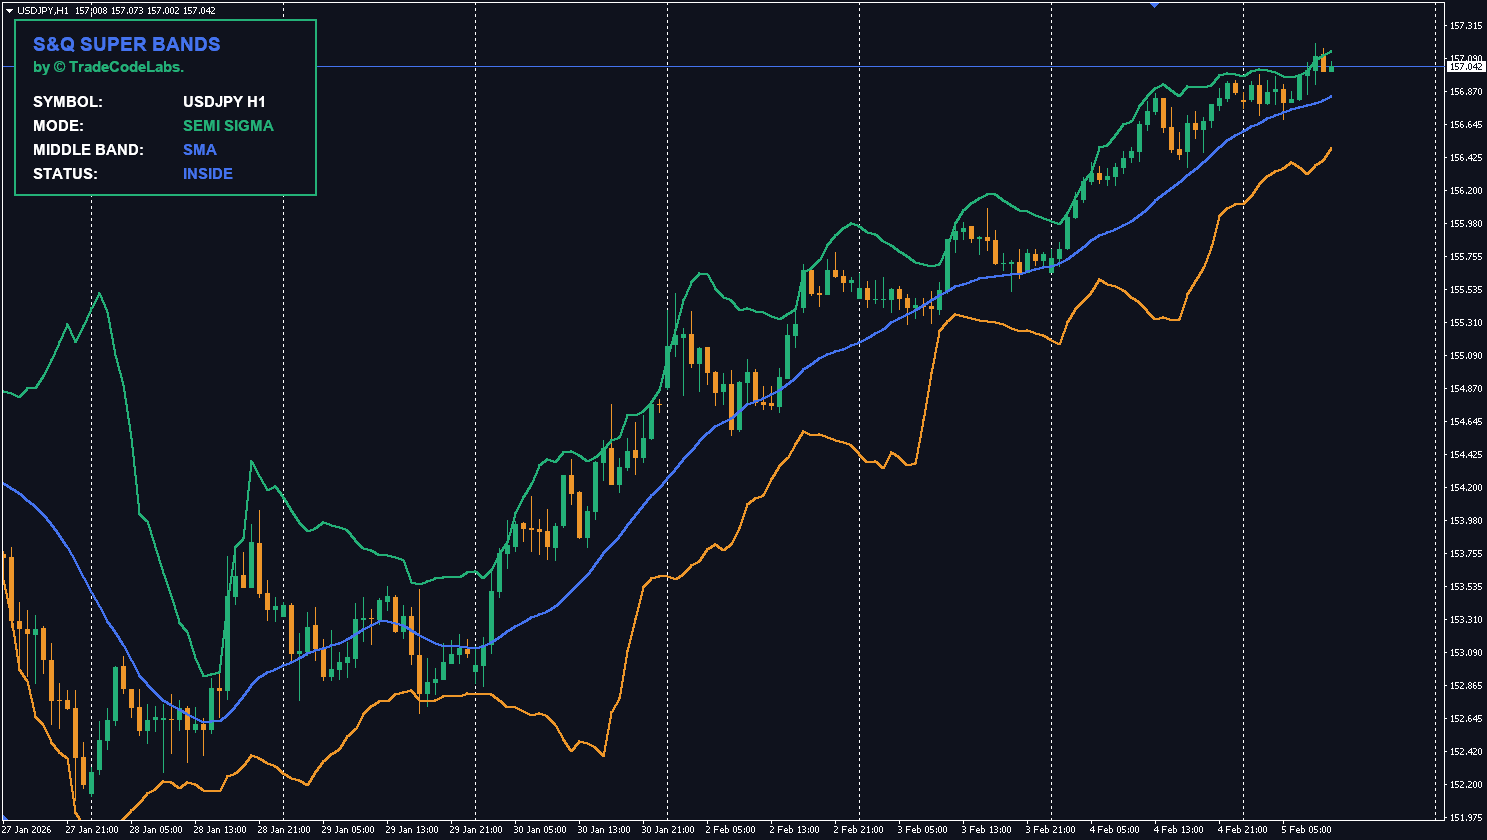
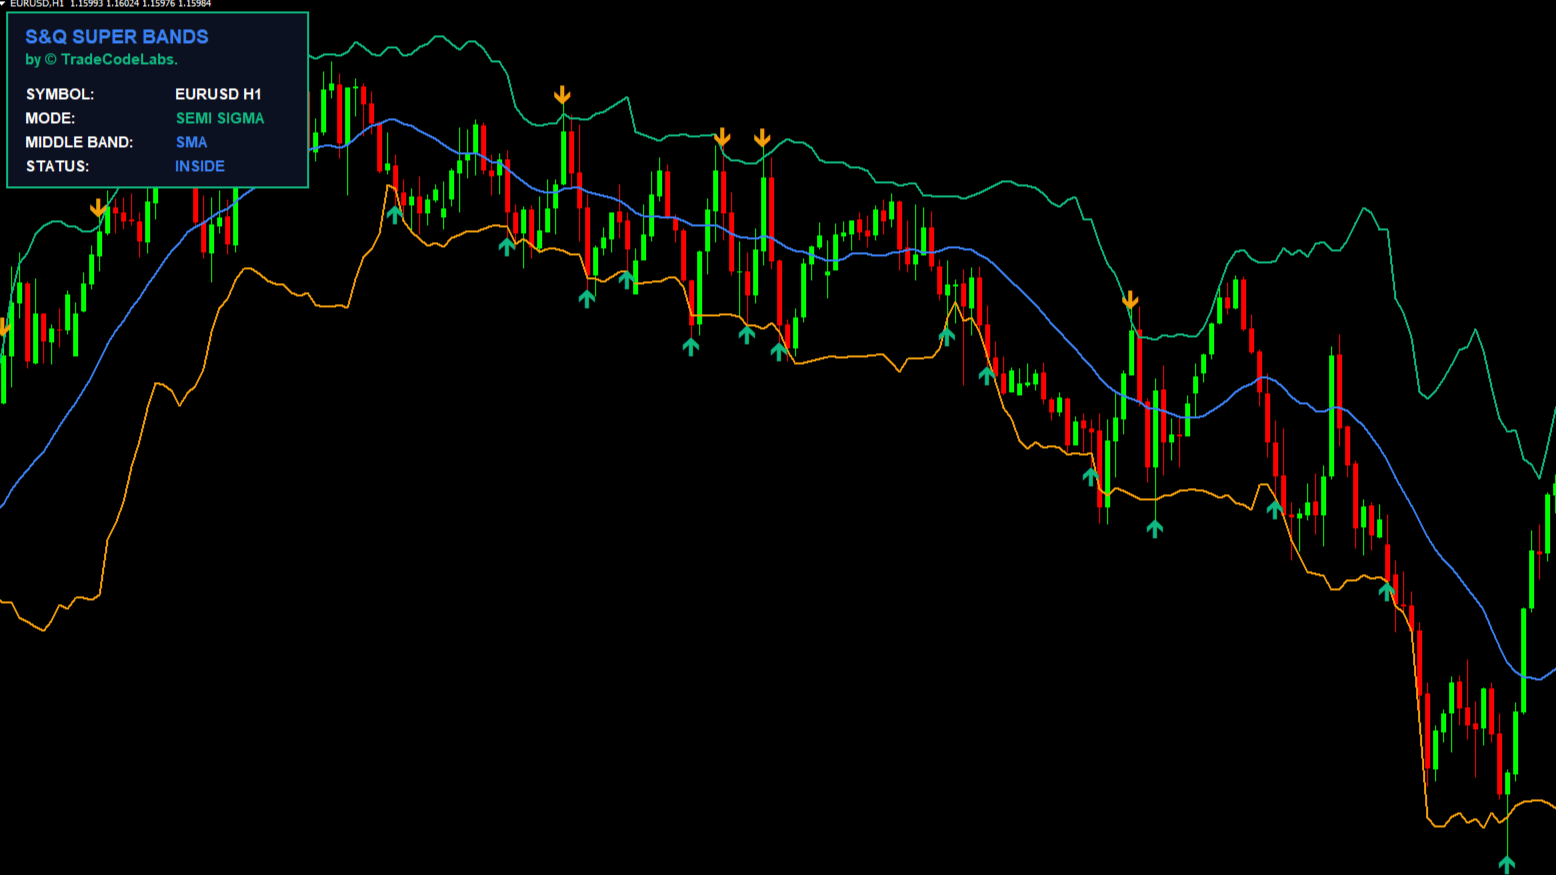
Semi-Sigma Mode (Semi-Deviation): Unlike Standard Deviation which treats upside and downside volatility the same, Semi-Sigma calculates them separately. If price is crashing, the Lower Band expands rapidly while the Upper Band stays stable. This provides accurate “catch” zones for falling knives without distorting the resistance levels.
Quantile Mode: This is a non-parametric approach. Instead of using averages, it looks at the raw historical distribution of price relative to the center. If you set it to 90% / 10%, the bands will strictly encompass the middle 80% of price action, making breakouts statistically significant events.
Center Line Options
You can choose the baseline for the bands:
SMA (Simple Moving Average): The classic smooth baseline.
Median: A robust baseline that ignores outliers. Ideal for “noisy” markets like Crypto or lower timeframe Forex.
How to Trade It
This is a classic Mean Reversion tool.
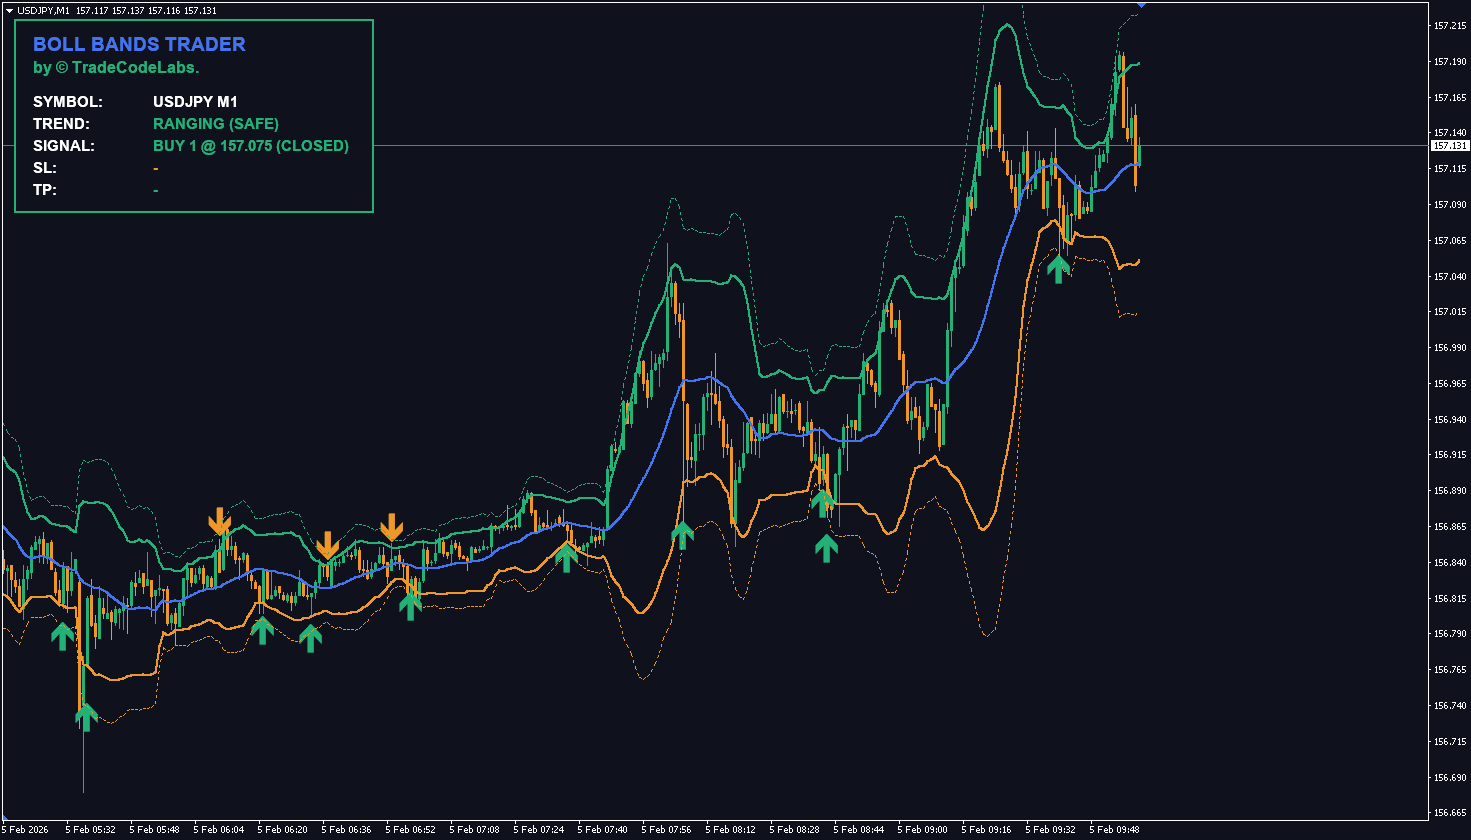
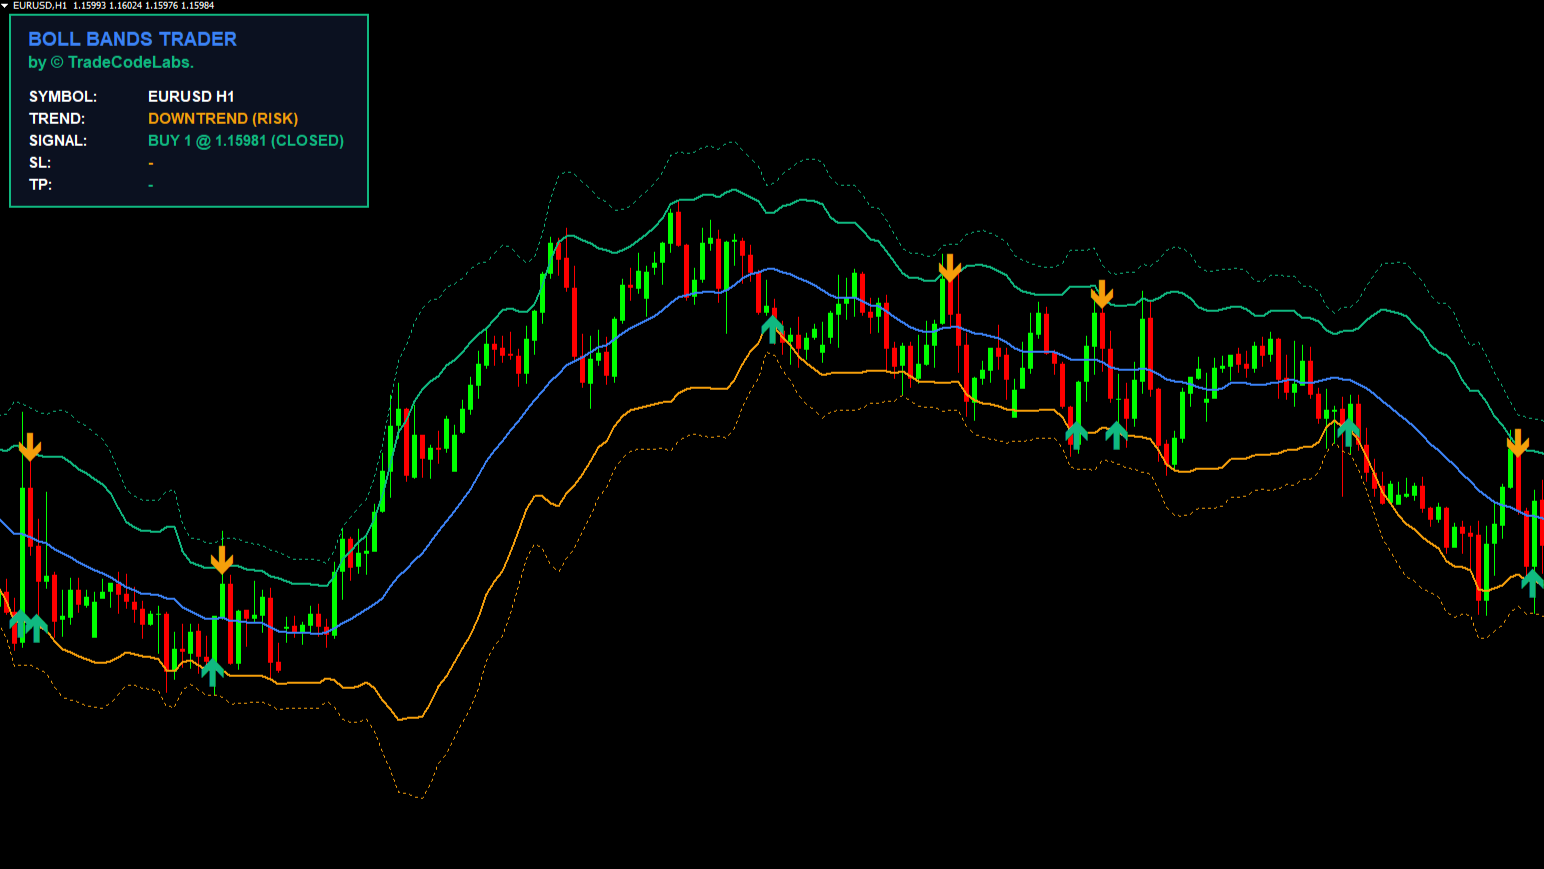
Buy Signal: When price pierces the Lower Band and rejects. The indicator plots a Green Arrow.
Sell Signal: When price pierces the Upper Band and rejects. The indicator plots an Orange Arrow.
The included Dashboard gives you a real-time status update (Inside, Overbought, or Oversold) and signal monitoring directly on the chart.
Semi-Sigma vs Quantile Mode — Which Should You Use?
Bands encompass exact % of price history (e.g., 80% at 90/10 quantile)
Best for
Trending markets with directional bias
Ranging/choppy markets where you want strict statistical zones
Breakout significance
Moderate — bands adapt dynamically
High — any breach is statistically outside the norm
Recommended for
Trend-following reversals
Strict mean reversion scalping
Pro Tip: Start with Semi-Sigma Mode — it handles real-world market asymmetry better than standard Bollinger Bands. Panic selling drops are faster and sharper than rallies, and Semi-Sigma captures this by expanding the lower band independently without distorting the upper resistance level.
S&Q Super Bands vs Bollinger Bands — Key Differences
Feature
Standard Bollinger Bands
S&Q Super Bands
Volatility calculation
Symmetric standard deviation
Semi-Deviation OR Quantile (asymmetric)
Assumes normal distribution
Yes
No — accounts for skewness
Center line
SMA only
SMA or Median (outlier-resistant)
Signal arrows
No
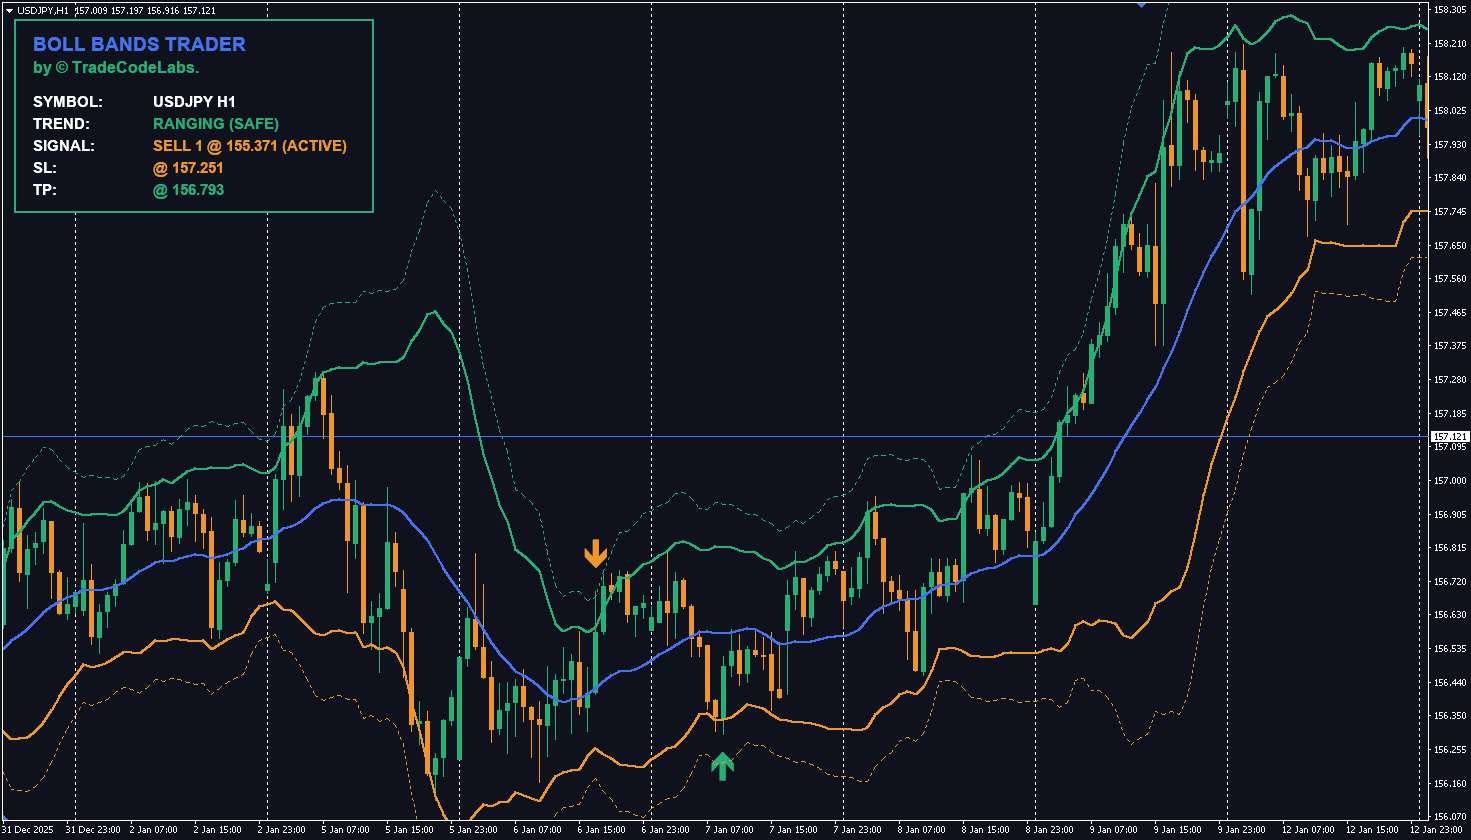
Yes — Buy/Sell on band rejection
Dashboard
No
Yes — Inside/Overbought/Oversold status
Alerts
No
Popup, Push, Email, Sound
EA compatible
Varies
Yes (Buffers 3 & 4)
Related Indicators
TCL Super RSI — Pair band signals with enhanced RSI confirmation
Choose 'Semi-Sigma' (Asymmetric) or 'Quantile' (Percentile).
Multiplier (Only for SEMI-SIGMA)
2.0
Multiplier for the Semi-Sigma bands (like StdDev).
Quantile High (Default 0.90)
0.90
Upper percentile for Quantile mode (0.0 to 1.0).
Quantile Low (Default 0.10)
0.10
Lower percentile for Quantile mode (0.0 to 1.0).
Price Source
P_CLOSE
Price used for calculation (Close or Body Center).
Show Dashboard
true
Toggle the on-chart status dashboard.
Show Signal Arrows
true
Toggle Buy/Sell arrows on the chart.
Dashboard Location
TL
Corner to display the dashboard (TL, TR, BL, BR).
Popup Alert
true
Enable MT4 popup alerts.
Push Notification
false
Enable mobile push notifications.
Email Alert
false
Enable email alerts.
Sound Alert
false
Enable sound alerts.
Sound File
"alert.wav"
Filename for the sound alert.
Version History
v1.0
Latest Nov 26, 2025
4.5
2 reviews
5 star
1
4 star
1
3 star
0
2 star
0
1 star
0
User Reviews (2)
F
Fazal Haq
January 25, 2026
Semi-Sigma mode is what makes this different. Regular bollinger treats upside and downside vol the same but markets arent symmetric. this one expands the lower band faster during crashes which makes way more sense. Quantile mode at 90/10 on gold H4 is also solid for mean reversion
S
smarteagle
March 18, 2026
took a bit to understand semi-sigma vs quantile but once I got it the signals are better than regular bollinger. switching center line to Median instead of SMA works way better on crypto. would be 5 stars with push alerts for band touches
Standard Deviation assumes upside and downside volatility are identical. Semi-Sigma calculates them independently, creating asymmetric bands that fit the price action better during trends — especially during sharp sell-offs where the lower band expands while the upper stays stable.
No. The indicator calculates based on historical data. Signal arrows appear when the Touch & Reject condition is met and do not vanish after the candle closes.
It works on all timeframes. M5 and M15 are excellent for scalping, while H1 and H4 are preferred for swing trading reversals.
Yes. The indicator uses standard index buffers (3 and 4) for Buy/Sell signals, making it easy to read with an EA.
Yes. It supports Pop-up, Mobile Push, Email, and Sound alerts so you never miss a signal.
Standard Bollinger Bands assume symmetric, normally distributed price action — which doesn't reflect real markets. S&Q Super Bands use Semi-Deviation (asymmetric volatility) or Quantile (non-parametric distribution) to create more accurate overbought/oversold zones, especially during panic sell-offs and volatile conditions.
The Median baseline ignores price outliers (spikes), making it more robust than SMA in noisy markets like Crypto or lower-timeframe Forex. It prevents a single extreme candle from shifting the entire band structure.
Yes — completely free. Create a free account, download the .ex4 file, and install on MT4. No limitations or premium unlock required.


User Reviews (2)
Fazal Haq
Semi-Sigma mode is what makes this different. Regular bollinger treats upside and downside vol the same but markets arent symmetric. this one expands the lower band faster during crashes which makes way more sense. Quantile mode at 90/10 on gold H4 is also solid for mean reversion
smarteagle
took a bit to understand semi-sigma vs quantile but once I got it the signals are better than regular bollinger. switching center line to Median instead of SMA works way better on crypto. would be 5 stars with push alerts for band touches
Write a Review