
PRO
MT4
MT5
(4 Reviews)
16 Installs
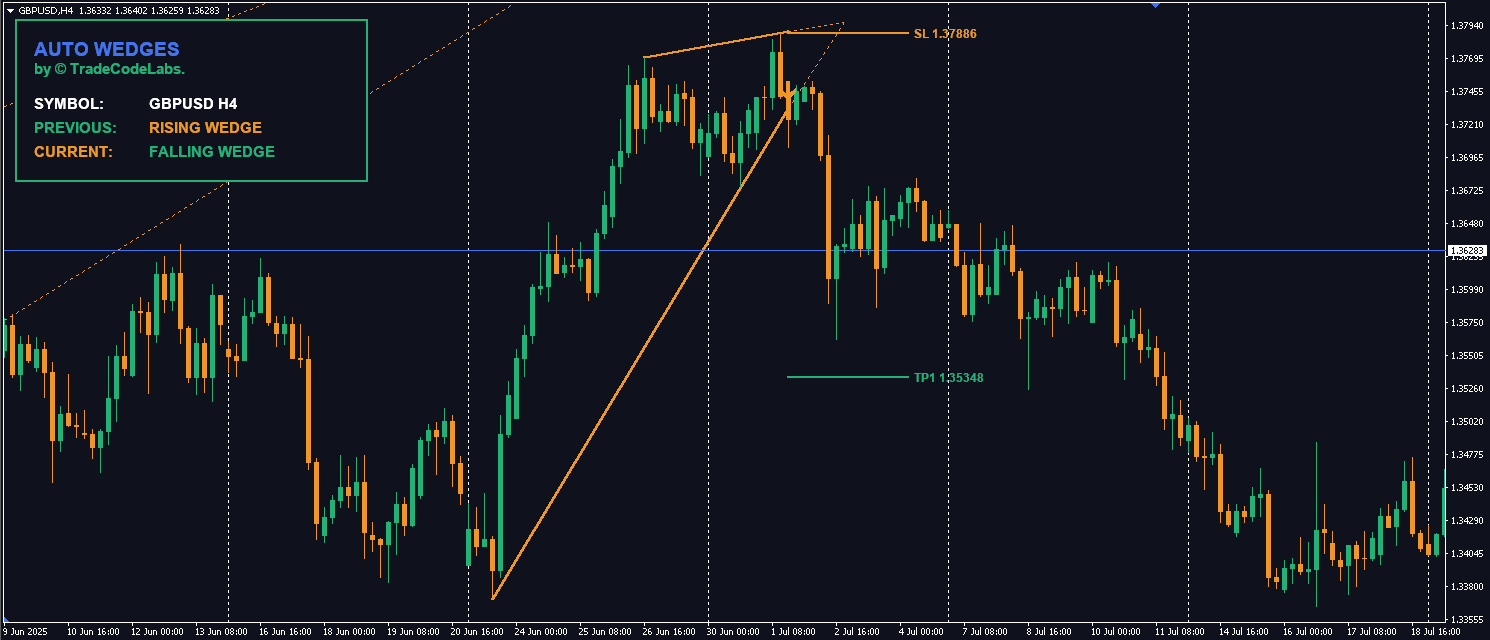
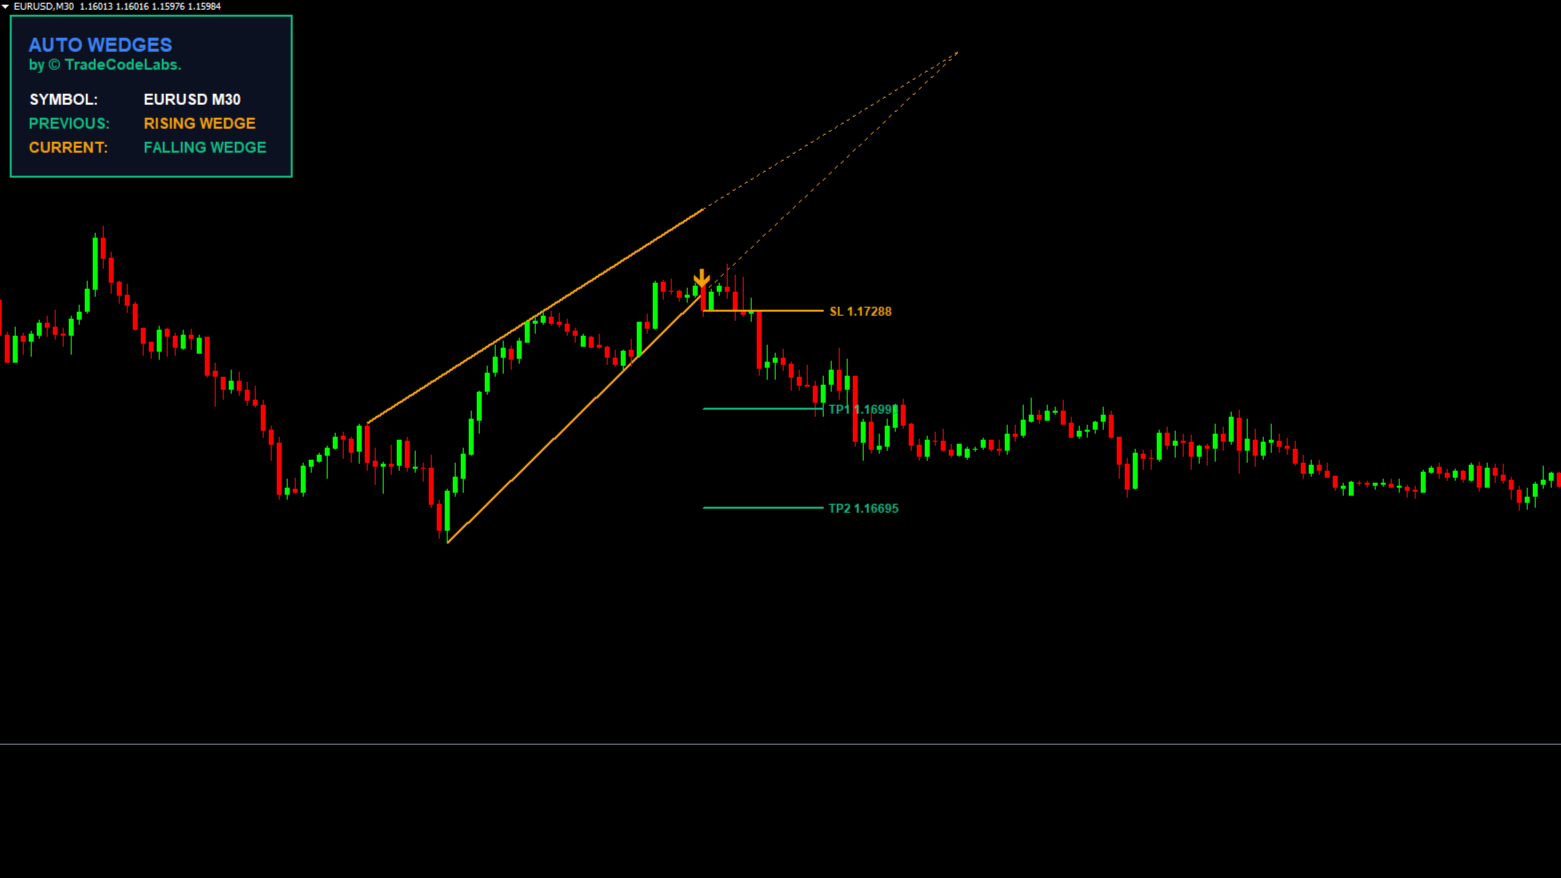
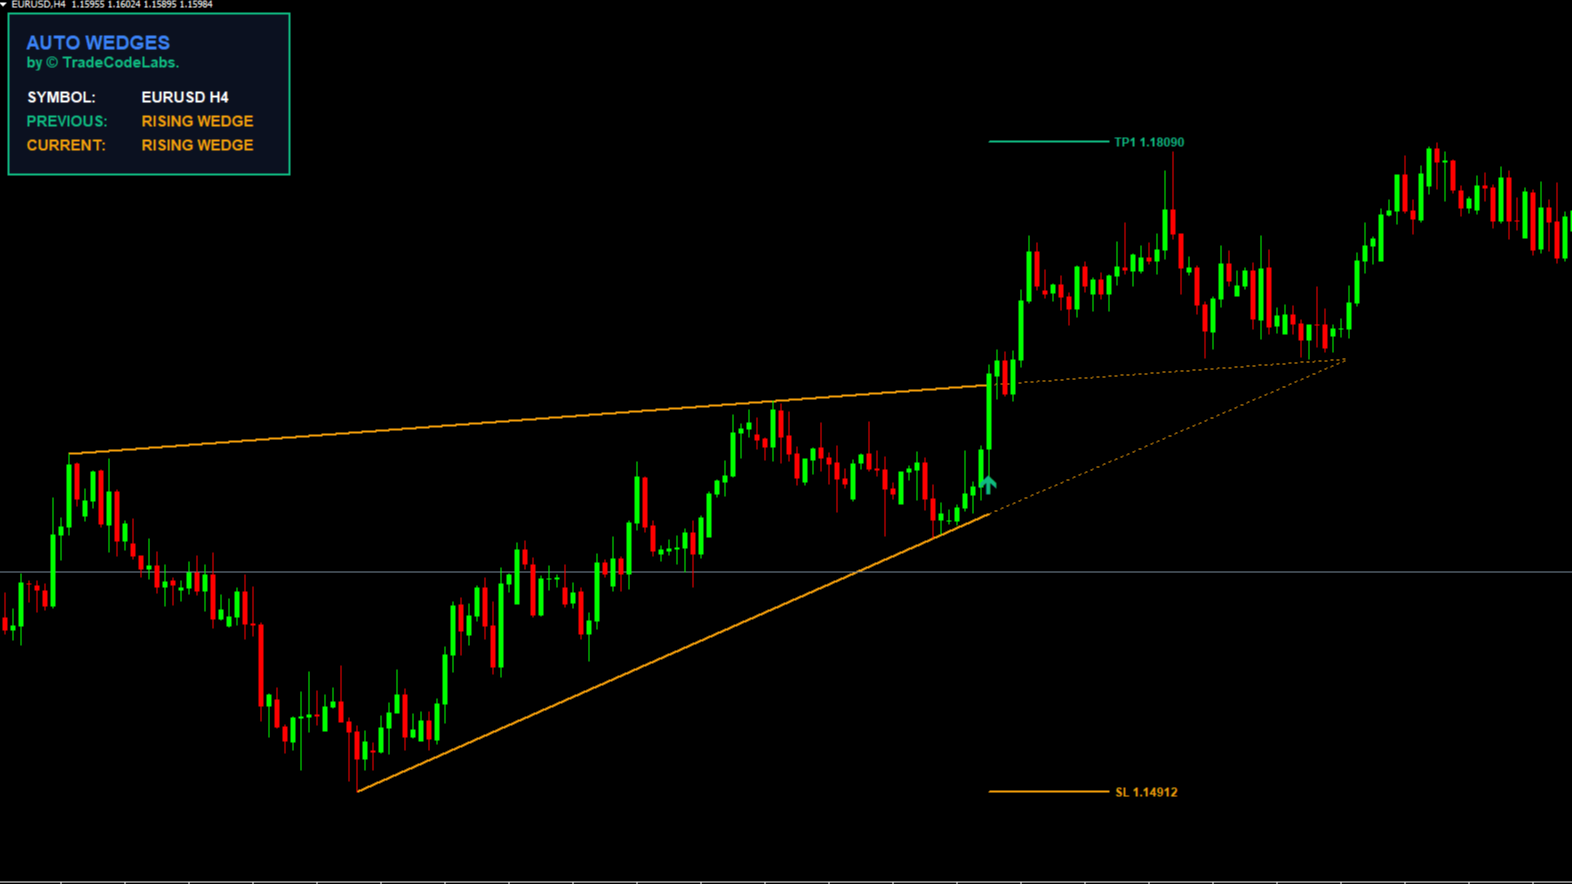
TCL AUTO WEDGES
A professional wedge pattern detector that automatically identifies high-probability reversals and plots precise breakout targets.
$48
$74.99
Save 36%
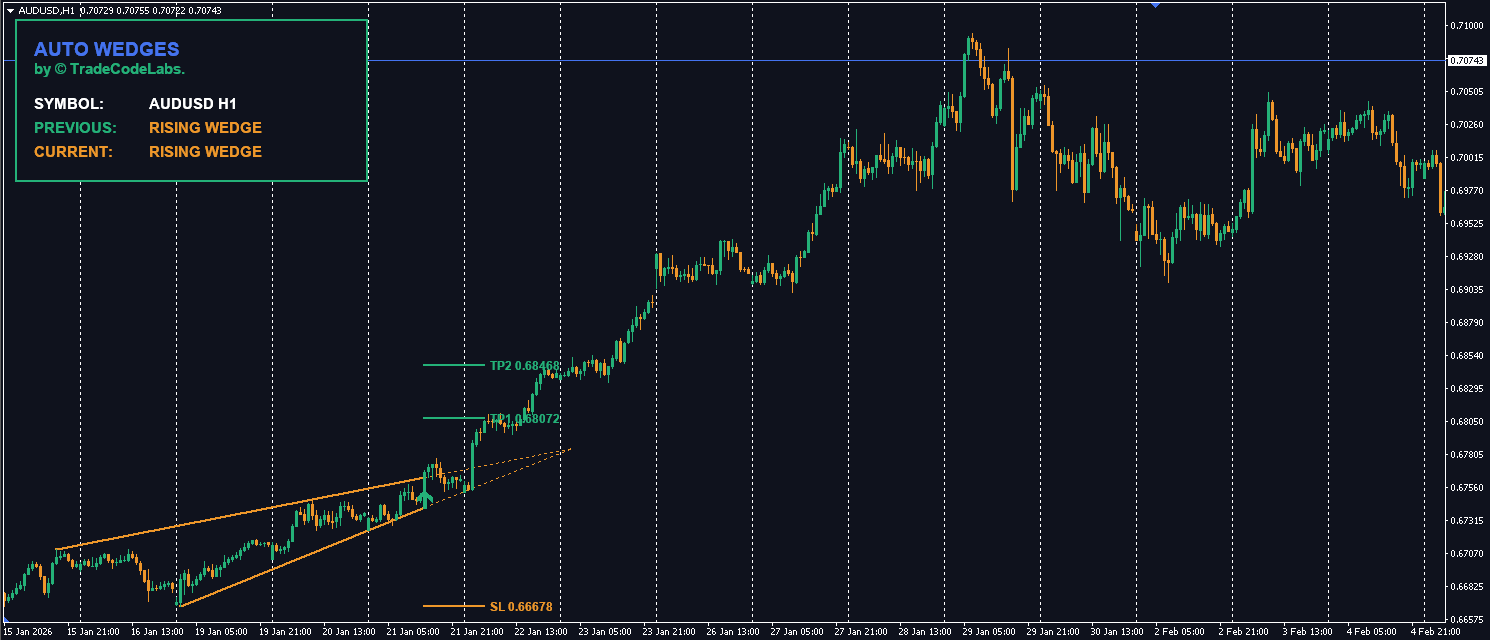
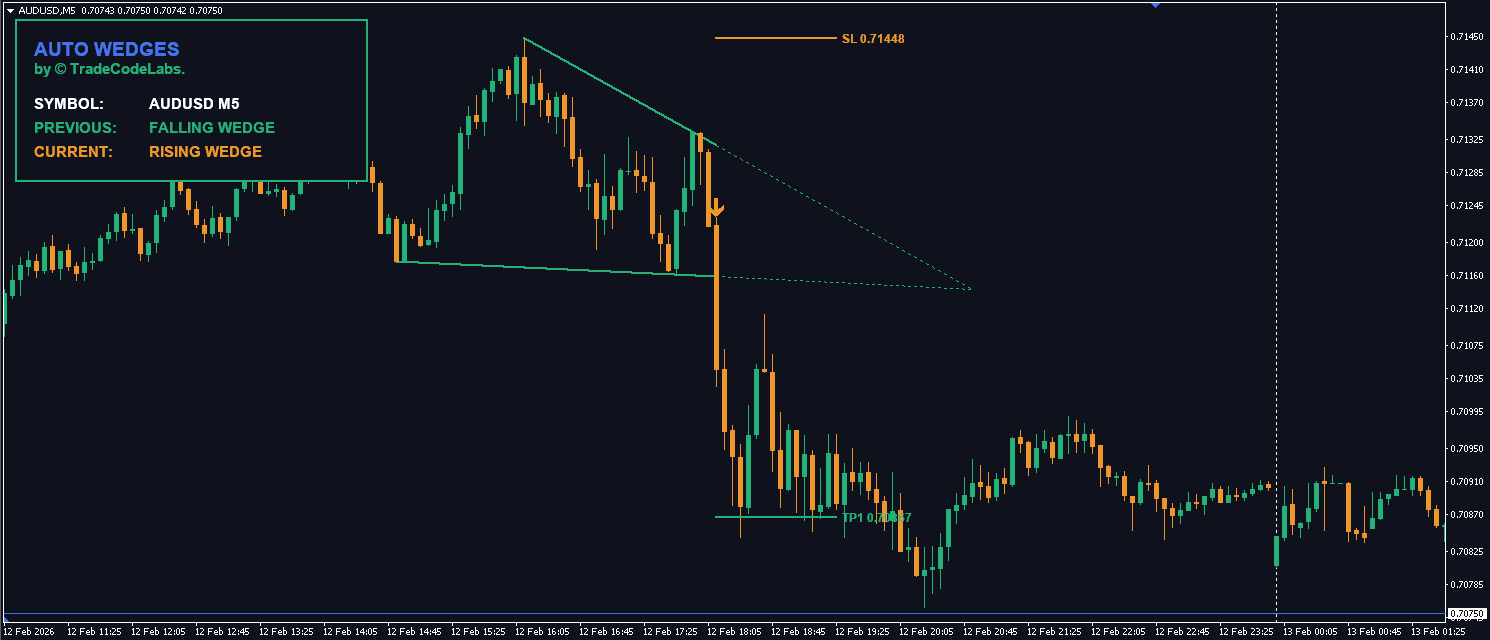
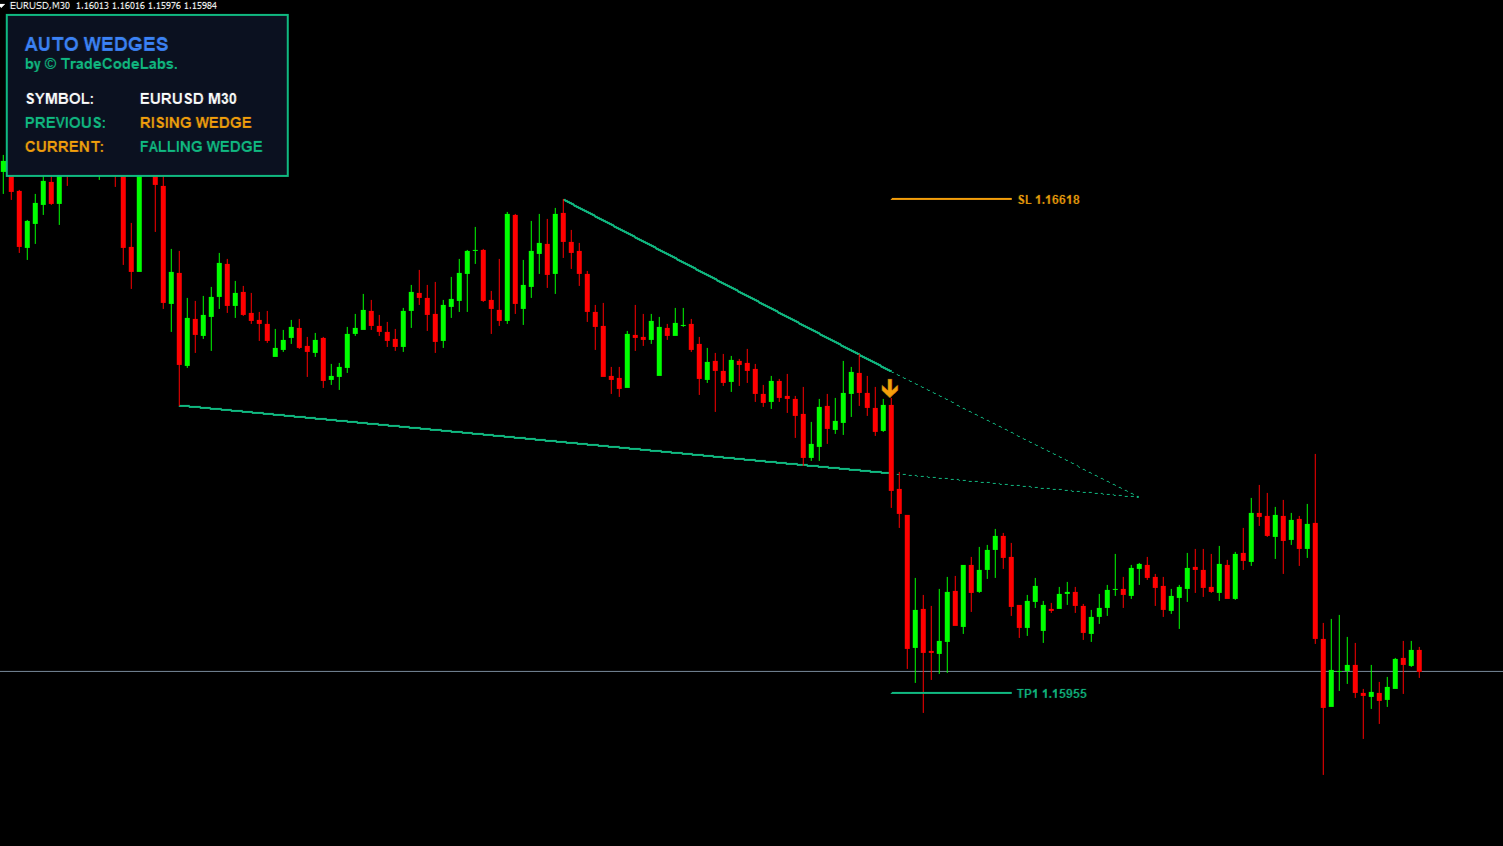
Falling & Rising Wedges
Breakout Trade Targets
Automated ZigZag Logic
Real-Time Dashboard
Secure payment • One-time purchase, no subscriptions

User Reviews (5)
Sergio Caramelli
falling wedges are my bread and butter for reversal entries and this nails them. TP1/TP2/TP3 are well calculated and SL goes at the last swing inside the wedge. combined with Auto Triangles all my pattern trading is covered
MooJah
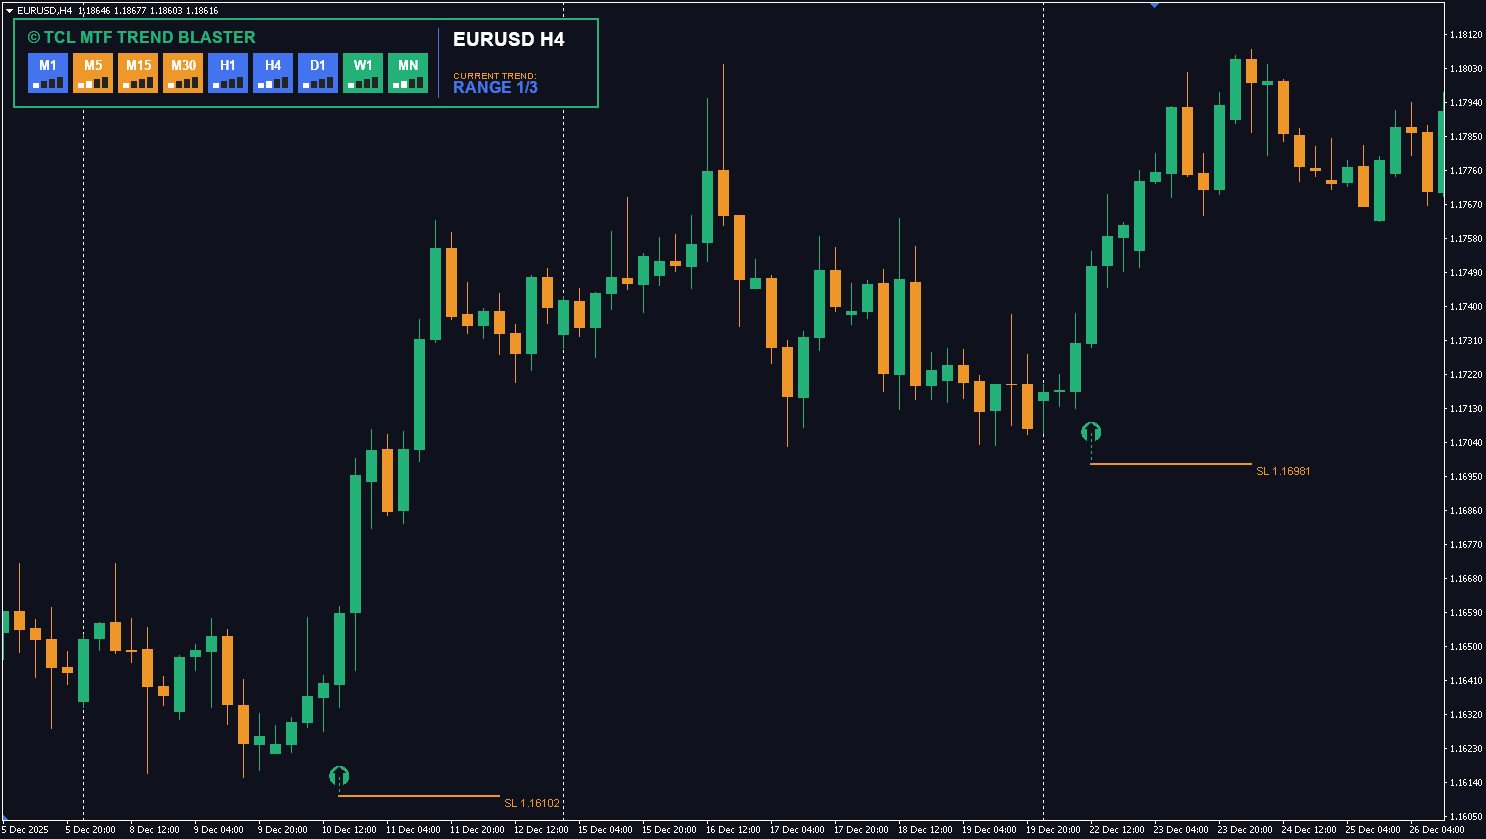
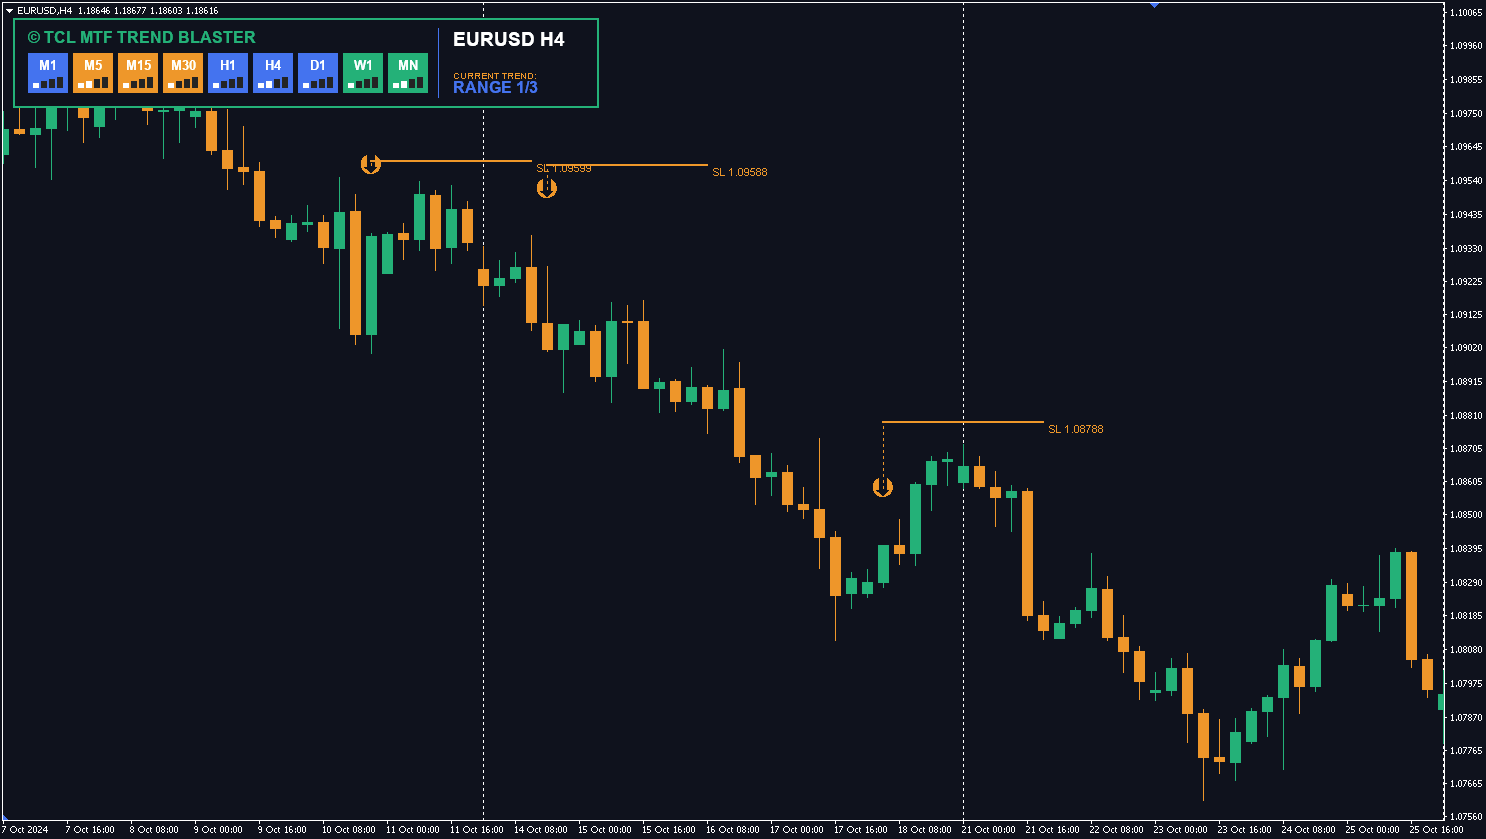
Good tool. wedges are harder to detect than triangles so expect some false positives on lower TFs. works best on H4 and D1. I pair it with MTF Trend Blaster to confirm breakout direction. worth the price
Nelton Manikkam
Decent indicator. On GBPUSD H1 it sometimes flags a rising wedge that is really just a channel. On H4+ the distinction between wedge and channel is cleaner and detection is much better. The TP calculation and SL placement are well done though. Maybe a future update could add a confidence score per pattern.
TCL
TCL TeamGood feedback. Wedge vs channel distinction is inherently harder on lower TFs because the converging trendlines need more data points. We tightened the convergence angle threshold in a recent update which should reduce false positives on H1. A confidence score is also on our roadmap.
Gideon96
few but very high accurate signals.
Write a Review