The Silent Risk Killer
Many traders unknowingly stack risk by trading pairs that move identically. If you buy EURUSD and sell USDCHF, you are effectively doubling your bet on a weak Dollar. The TCL Correlation Matrix makes these invisible relationships visible. It calculates the statistical correlation between the current chart symbol and a basket of other assets over a customizable lookback period.
Understanding the Values
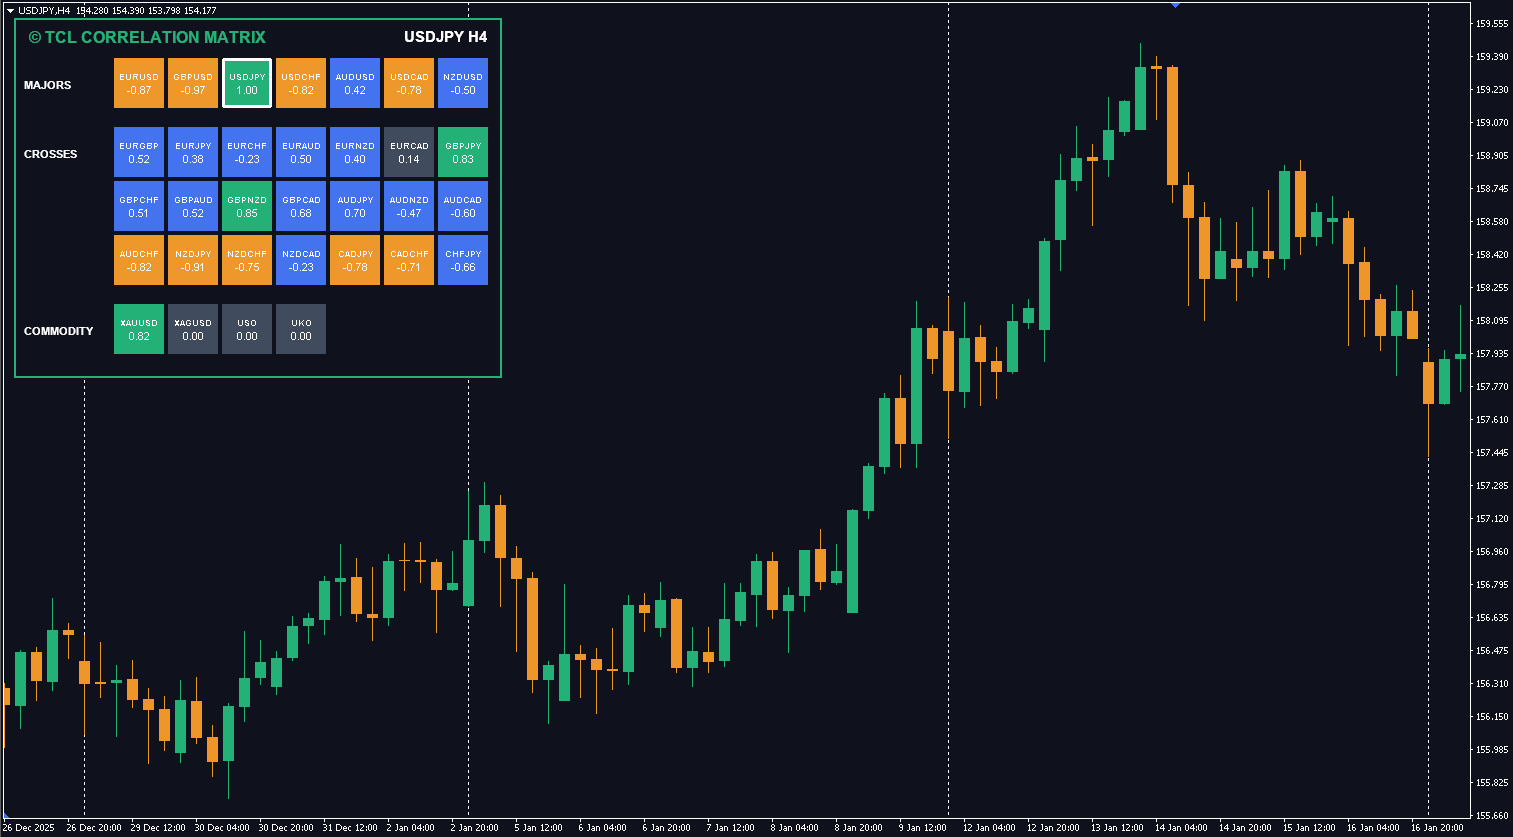
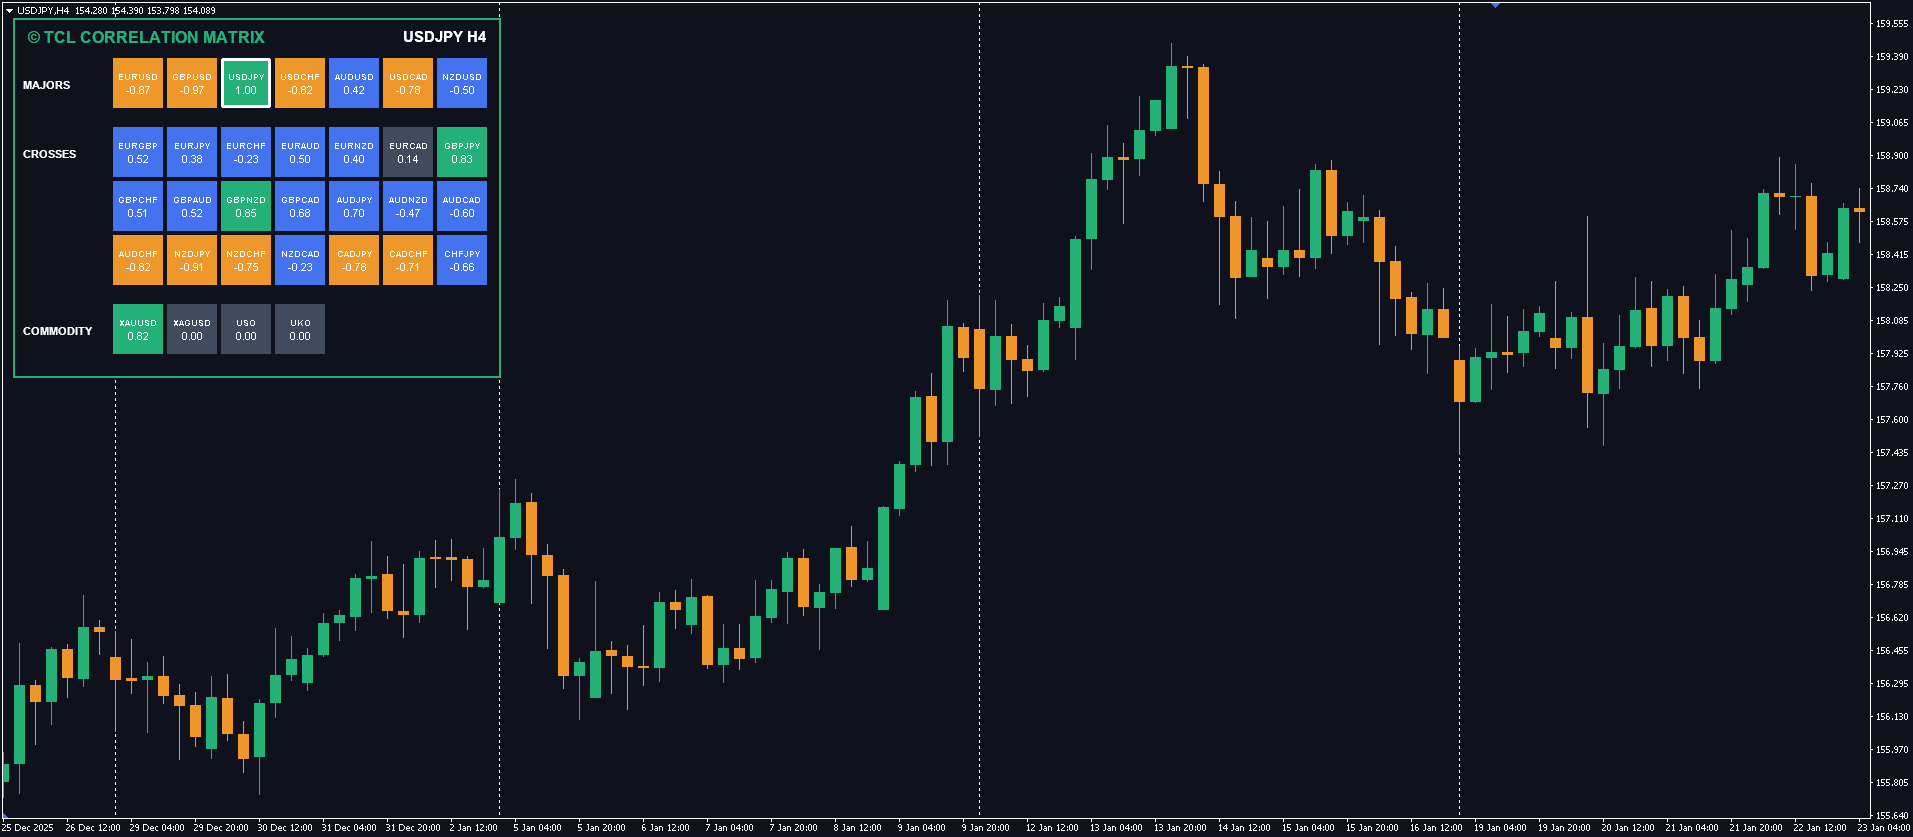
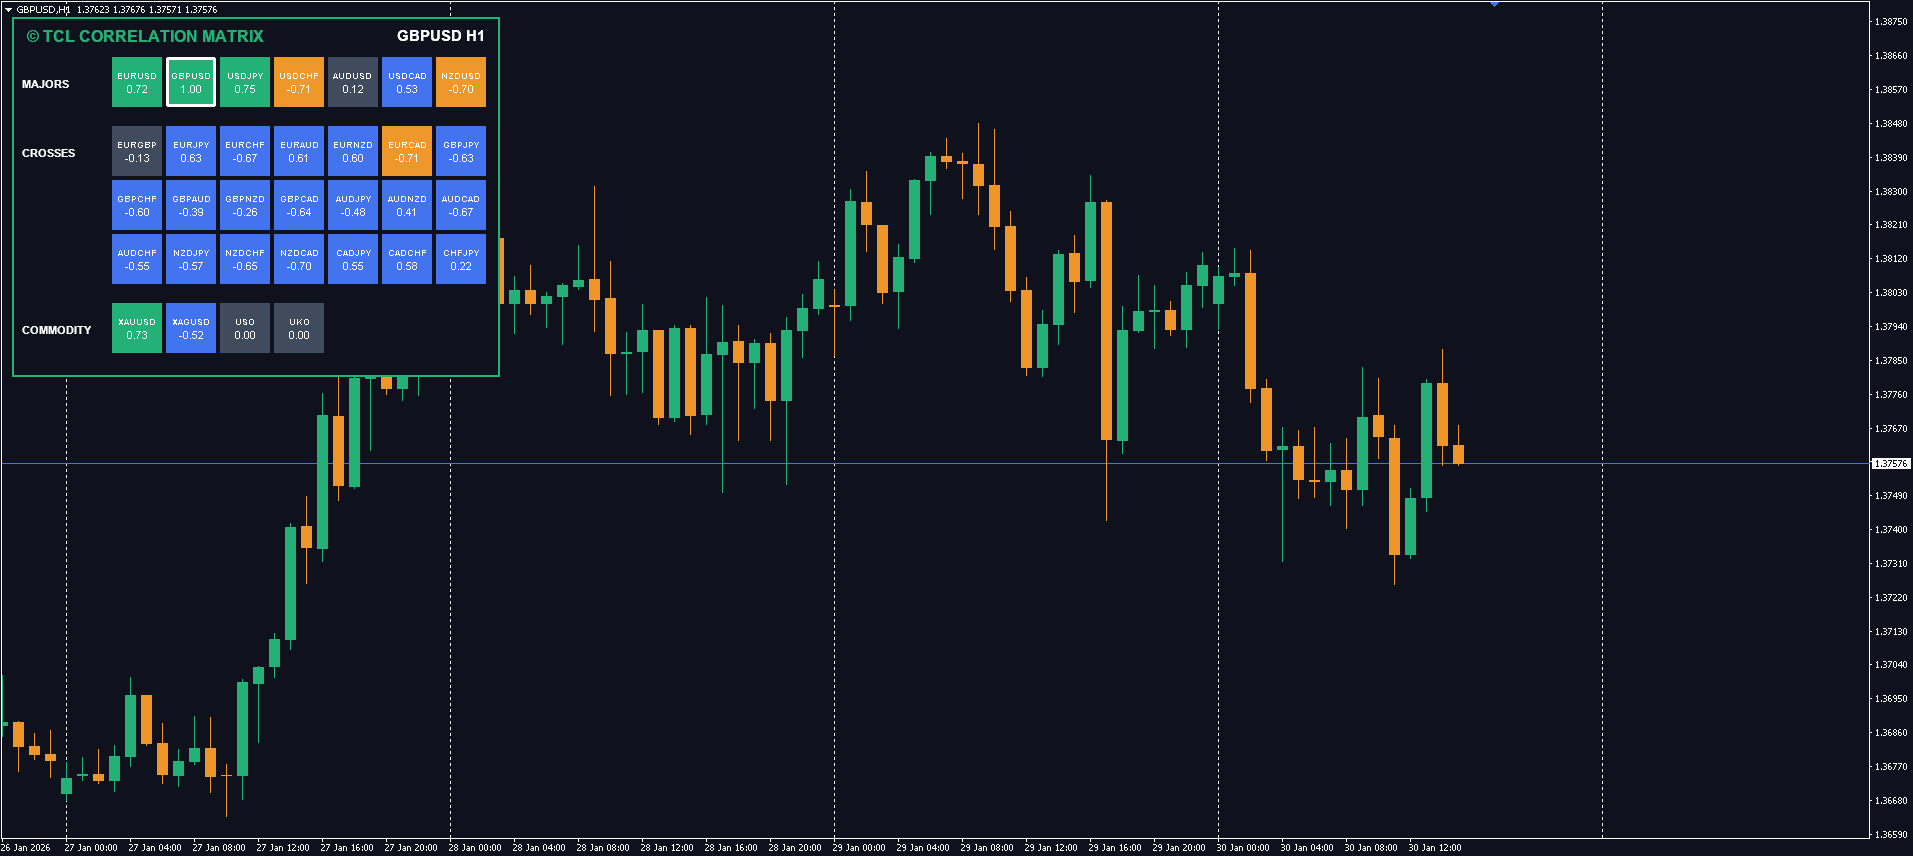
The matrix displays a coefficient value for each symbol, ranging from -1.00 to +1.00:
- Strong Positive (> 0.70): Green. The assets move together strongly. Buying both doubles your risk. Ideally, you should trade one or the other, but not both in the same direction.
- Strong Negative (< -0.70): Orange. The assets move in opposite directions strongly. Buying one acts as a hedge for the other.
- Moderate Positive( +0.15 to +0.7): Blue. The assets move together moderately. Buying both doubles your risk. Ideally, you should trade one or the other, but not both in the same direction.
- Moderate Negative( -0.15 to -0.7): Blue. The assets move in opposite directions moderately. Buying one acts as a hedge for the other.
- Weak / None (-0.15 to 0.15): Grey. The assets are uncorrelated. This is ideal for diversification as their price movements are independent.
Full Market Coverage
Unlike simple Forex scanners, this tool is built for the modern multi-asset trader. It supports 6 distinct blocks of assets: Majors, Crosses, Exotics, Commodities (Gold/Oil), Crypto (BTC/ETH), and a Custom “Others” block. You can toggle each block on or off to keep your dashboard clean and focused on the markets you actually trade.
How to Use the Correlation Matrix in Your Trading
Strategy 1: Avoid Doubling Risk
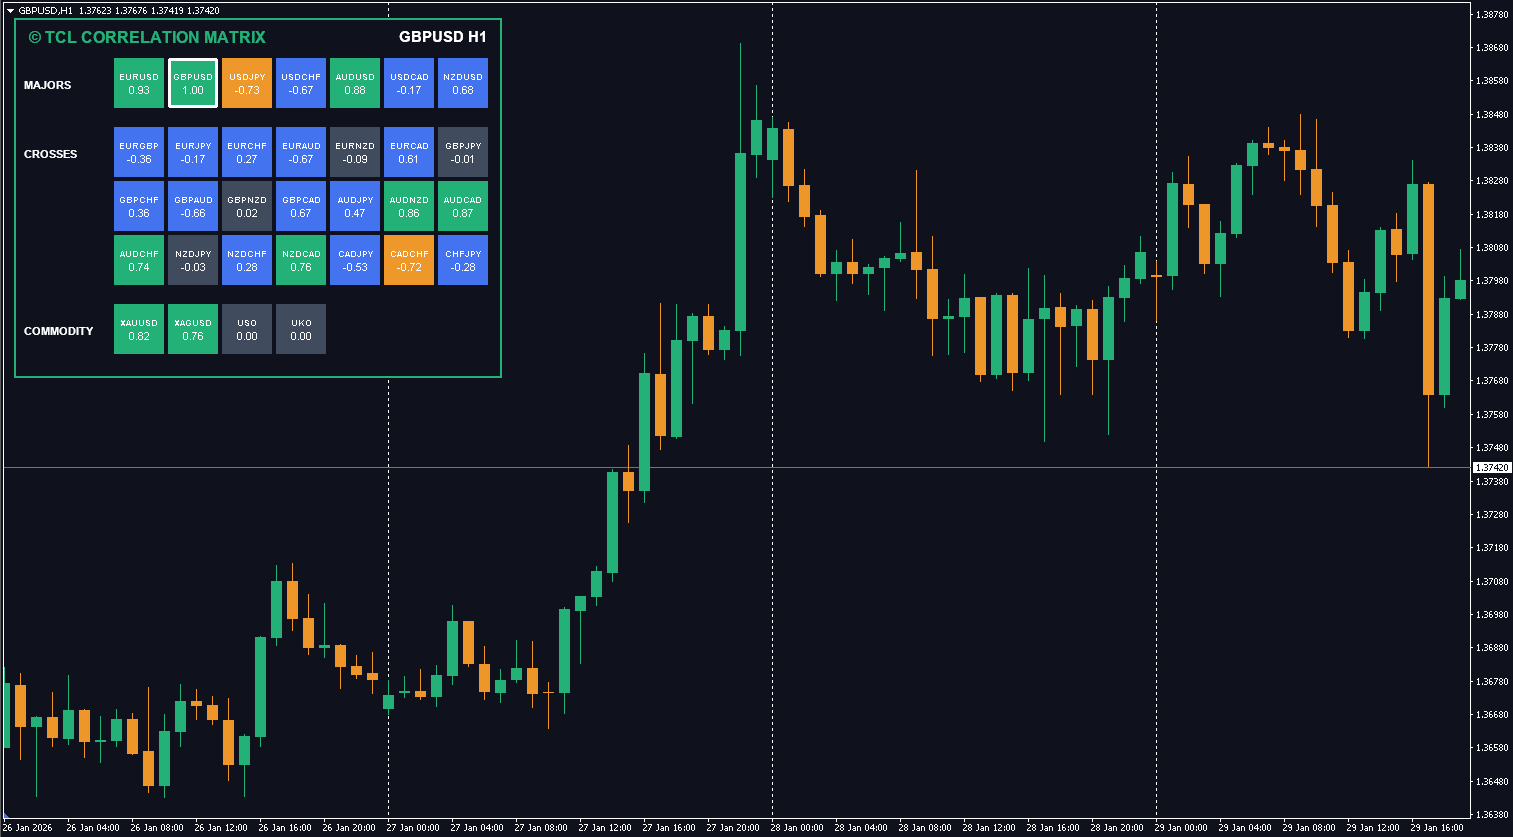
Before opening a new trade, check the correlation matrix. If your new pair is strongly correlated (> 0.70) with an open position in the same direction, you’re effectively doubling your exposure. Example: Going long EUR/USD and long GBP/USD simultaneously — these pairs often correlate at 0.80+.
Strategy 2: Find Hedging Opportunities
Look for pairs with strong negative correlation (< -0.70). If you’re long EUR/USD and want partial protection, consider a smaller long position on USD/CHF, these pairs typically show strong inverse correlation.
Strategy 3: Diversify Your Portfolio
For genuine diversification, trade pairs with weak or no correlation (-0.15 to +0.15). This means your trades move independently a loss on one doesn’t guarantee a loss on the other.
Strategy 4: Cross-Asset Analysis
Use the Commodities and Crypto blocks to spot inter-market relationships. Gold/USD, Oil/CAD, and BTC/Risk-on pairs often show meaningful correlations that give you an edge if you track them.
Related Tools

User Reviews (2)
Robert Braccio
I was trading EURUSD and GBPUSD same time without realizing they were 0.85 correlated, basically doubling my risk. this matrix made it obvious. scans 42+ symbols across forex crypto commodities. you can toggle asset blocks on off to keep it clean
erhiel
essential for anyone trading multiple pairs. I trade 6 pairs and this helps me avoid being overexposed. color coding makes it easy to spot correlations at a glance. great free tool
Write a Review