WEEKEND15
Browse our collection of professional trading tools. From automated price action scanners to advanced risk management utilities.
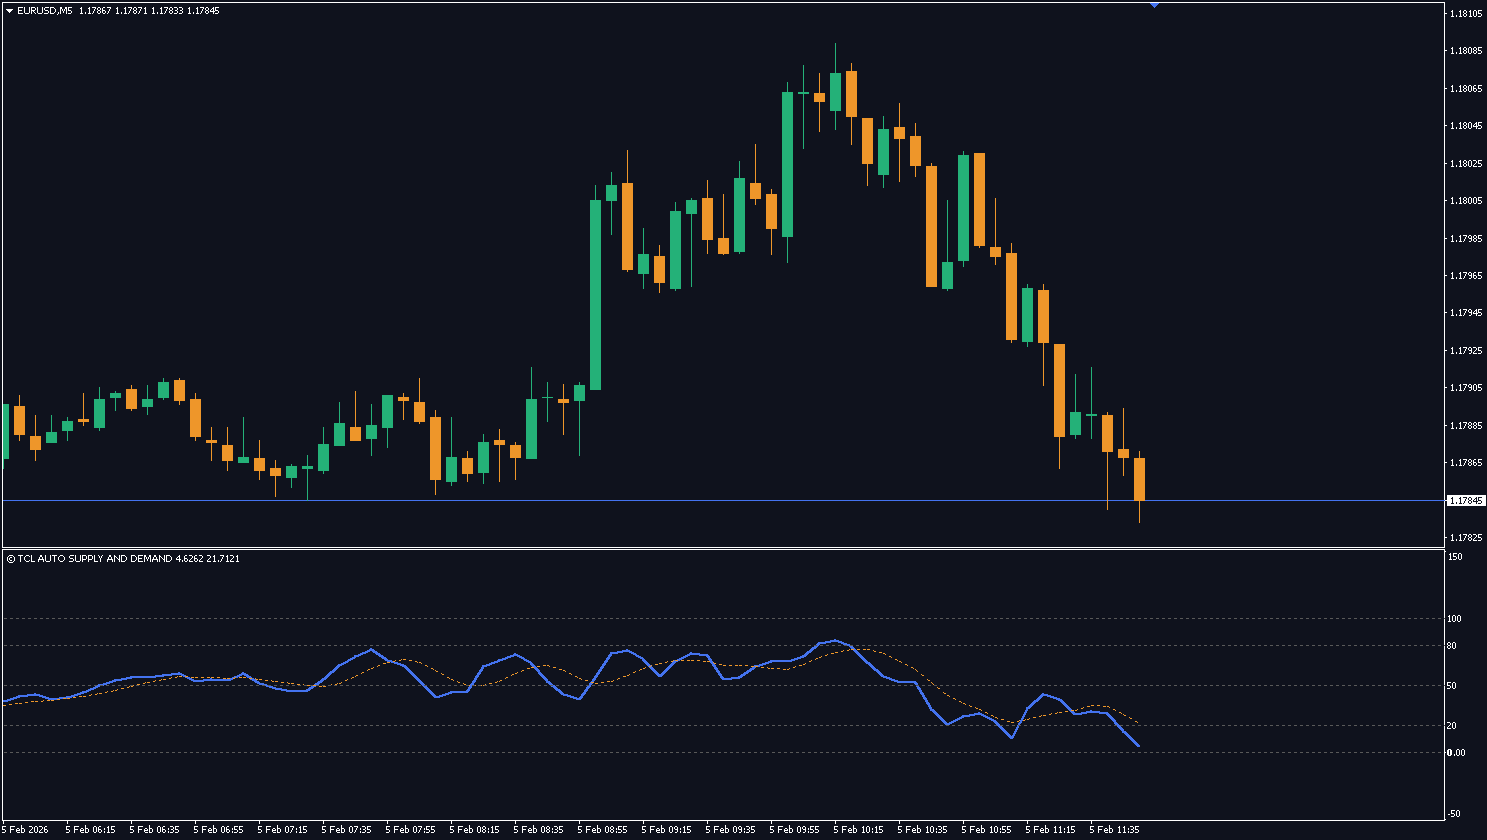
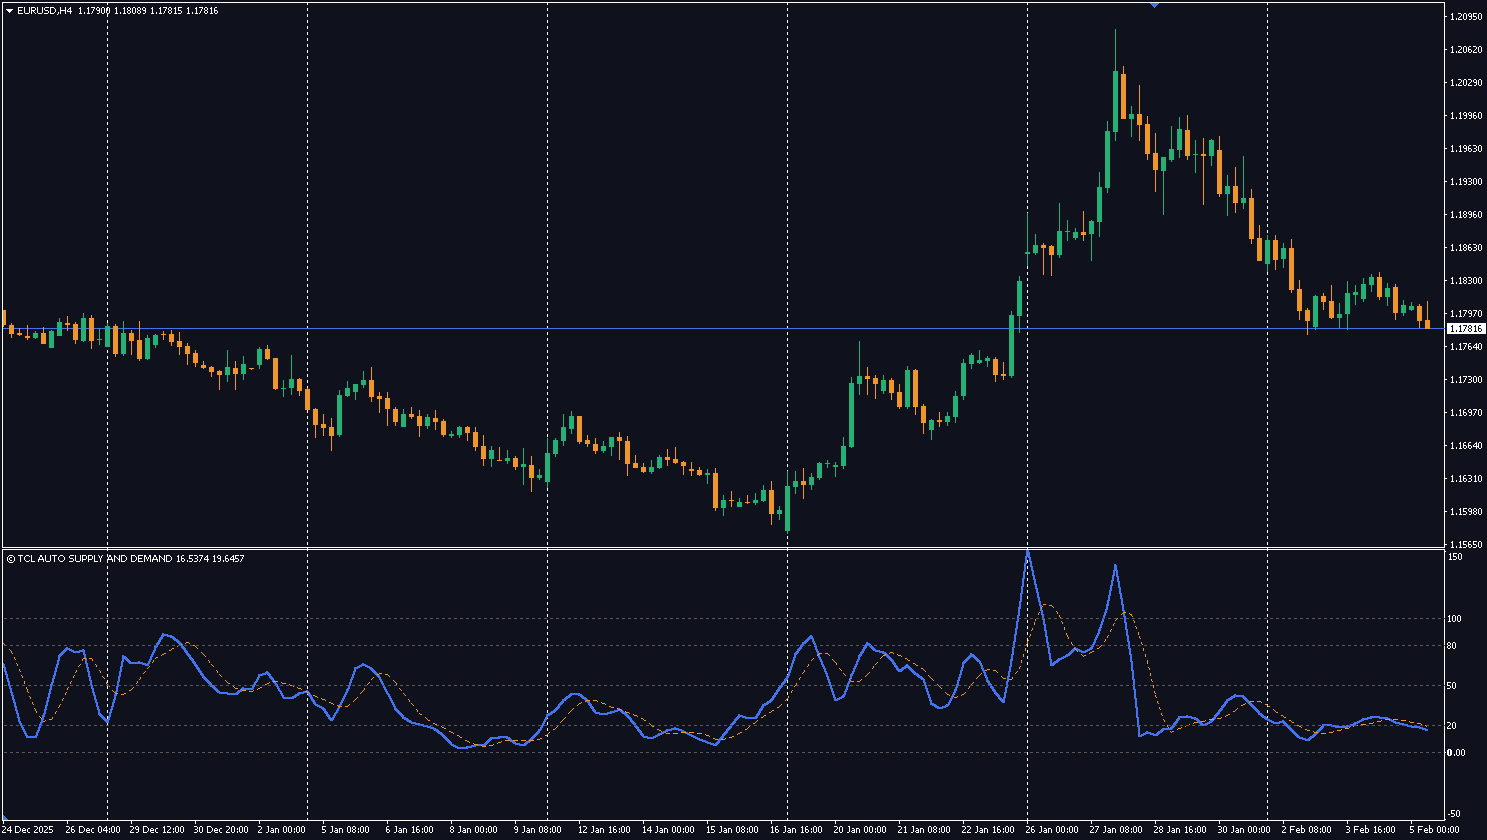
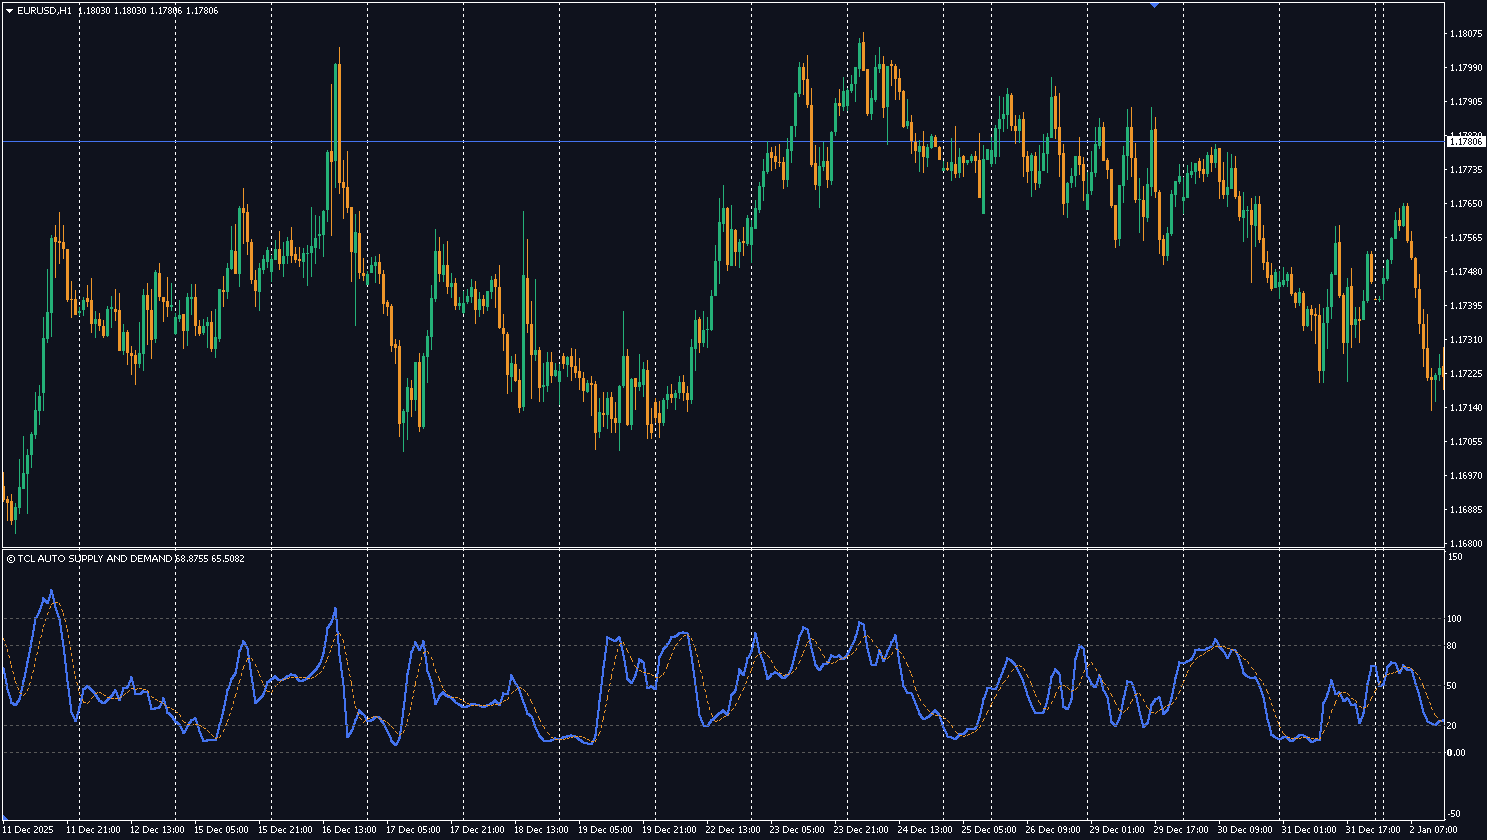
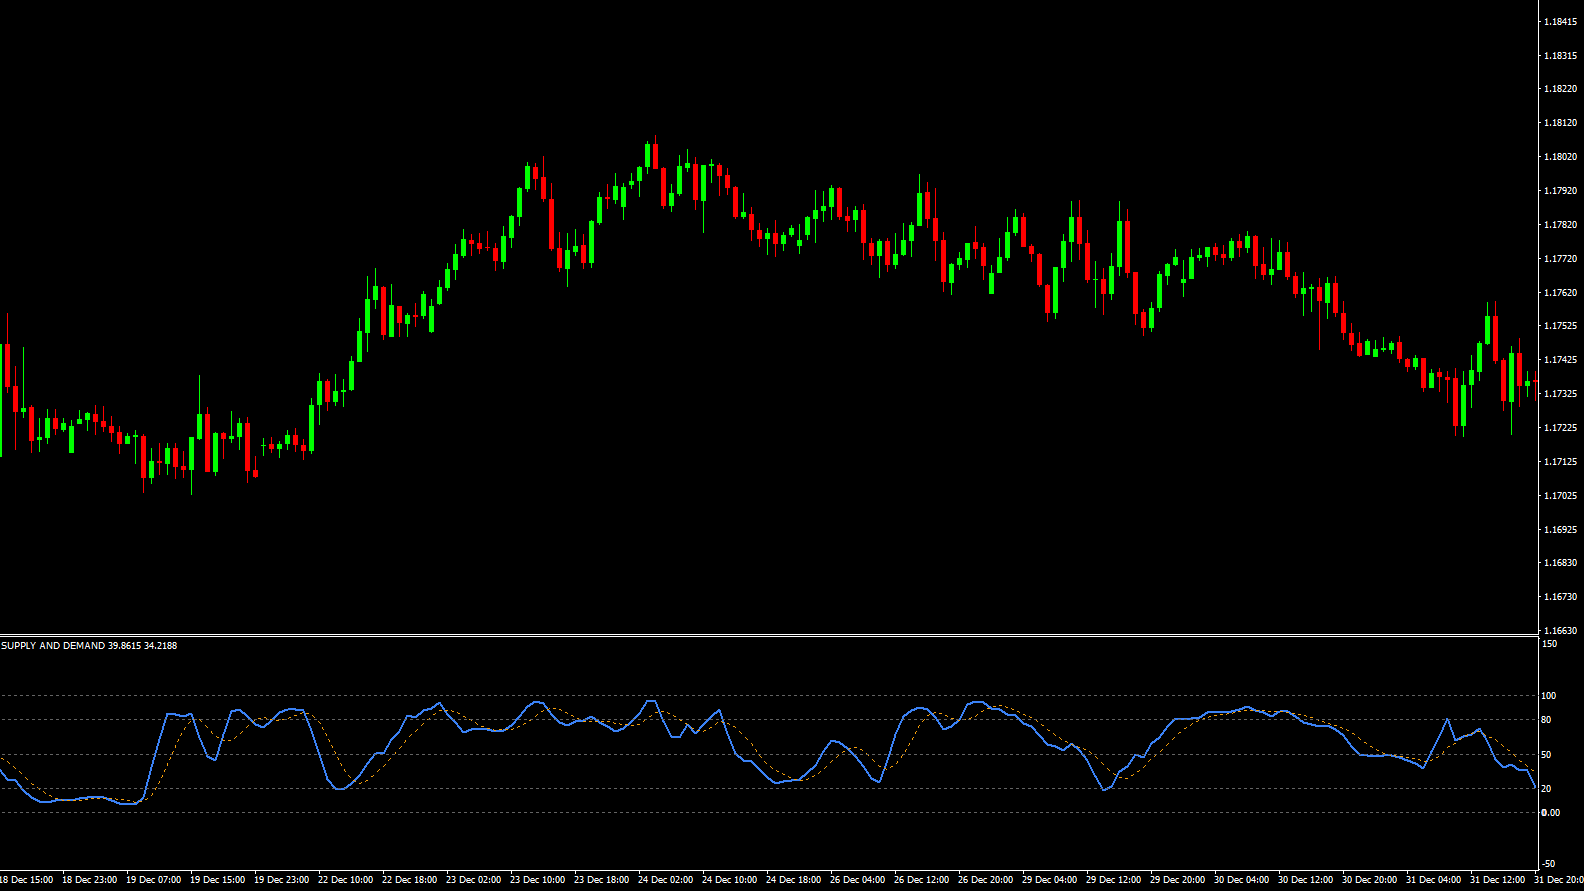
Trading Supply and Demand usually requires messy charts full of boxes. The TCL Auto S&D Oscillator simplifies this by automatically detecting valid, unbroken zones in history and plotting price’s position relative to them as a clean 0-100 value.
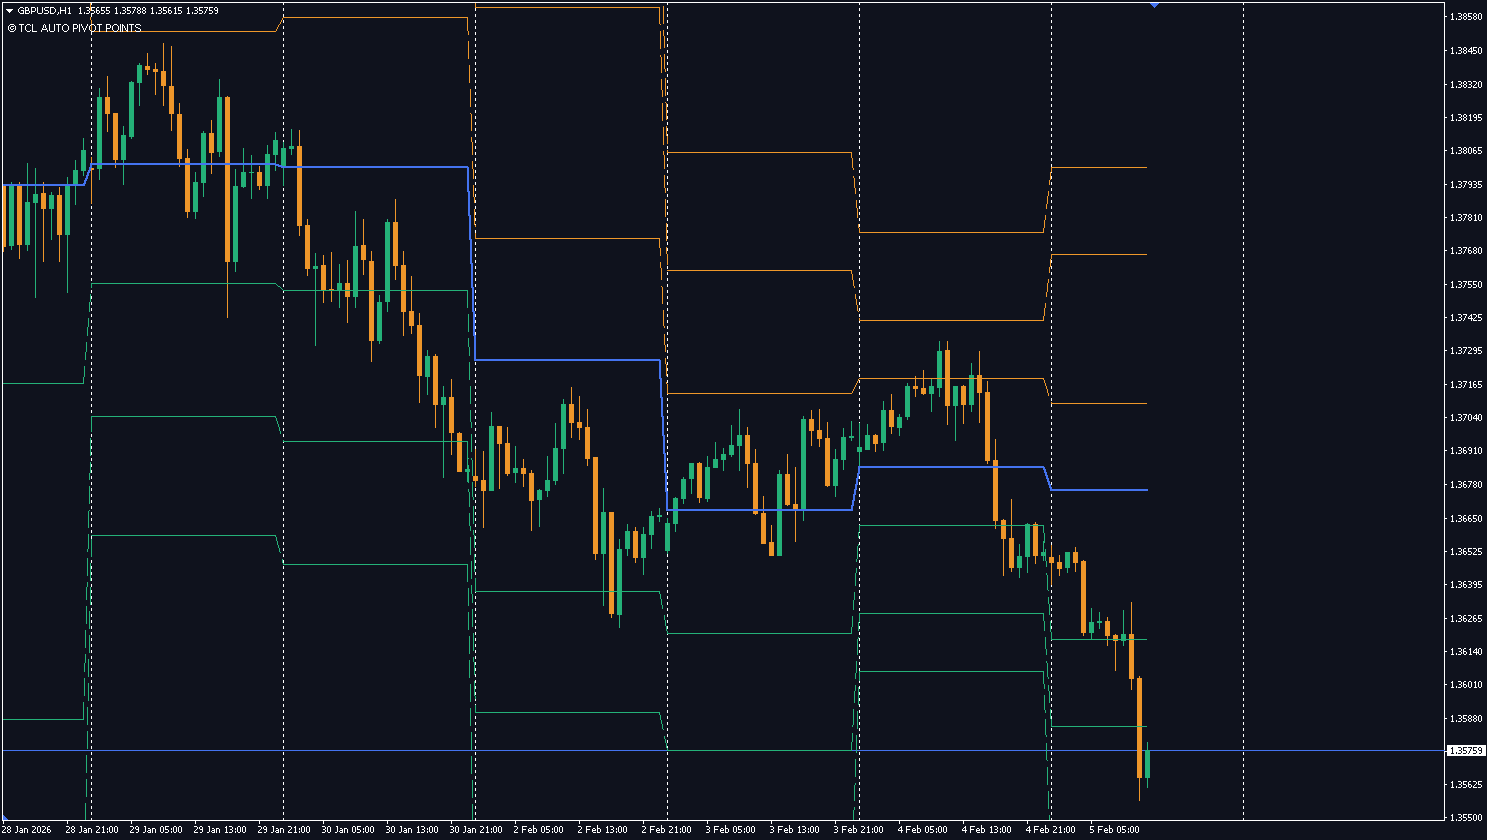
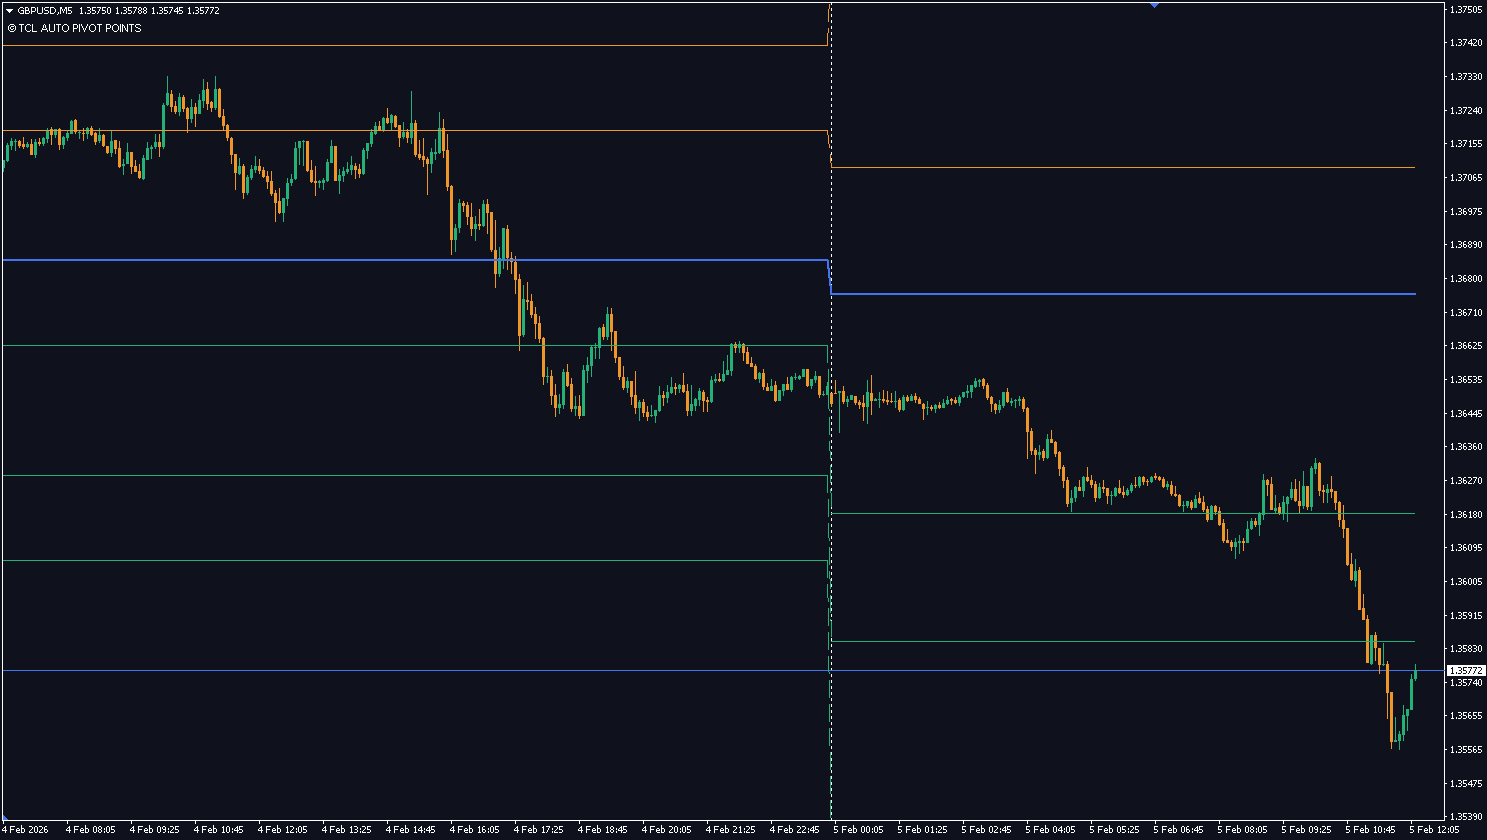
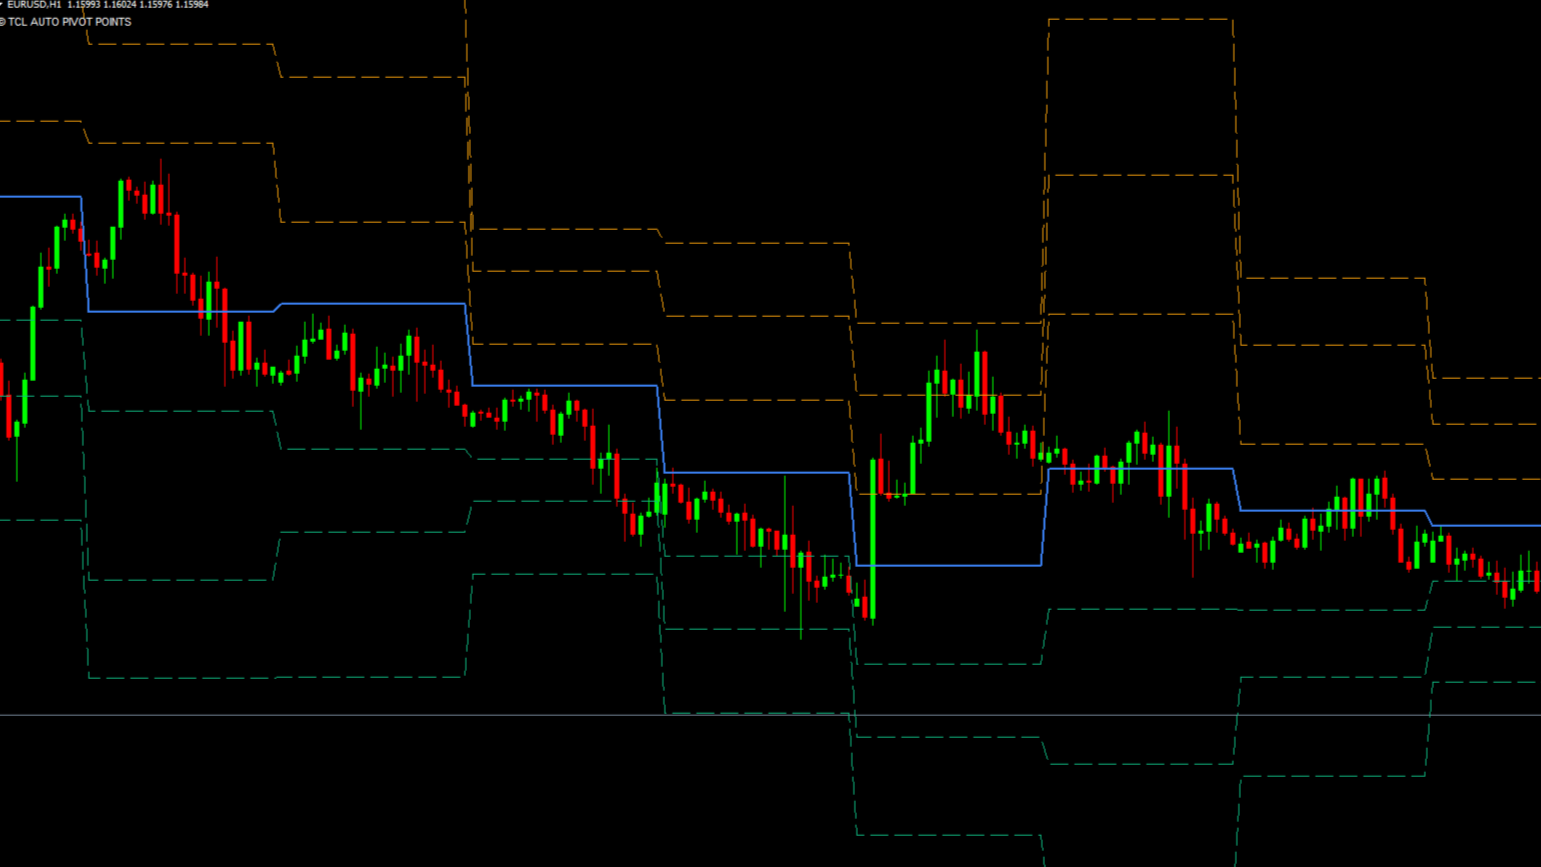
Support and resistance are key to every strategy, but drawing them manually is tedious. The TCL Auto Pivot Points indicator does the math for you, projecting institutional price levels (R1-R3, S1-S3) directly onto your chart using your preferred calculation method.
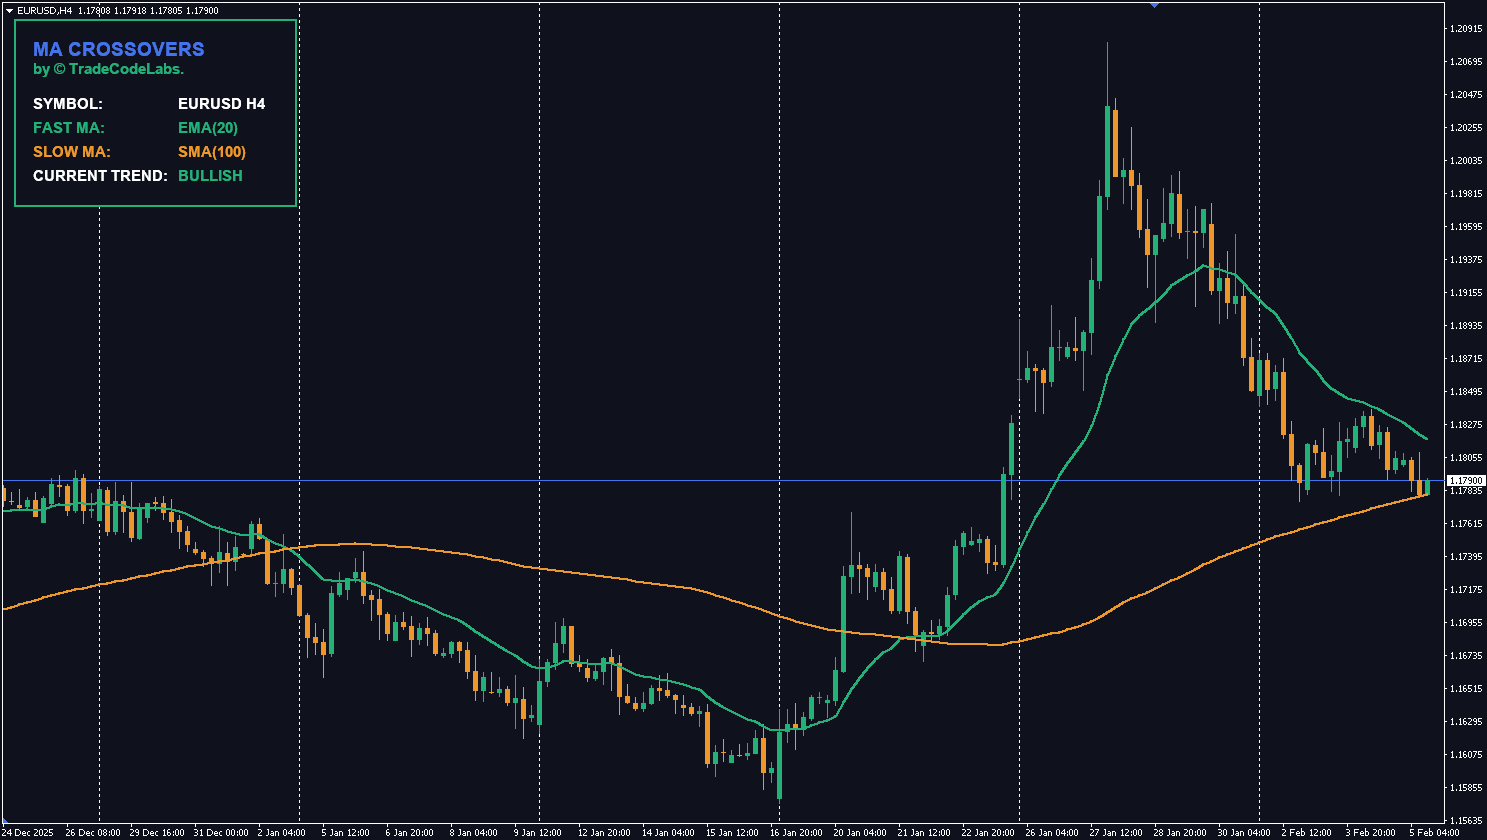
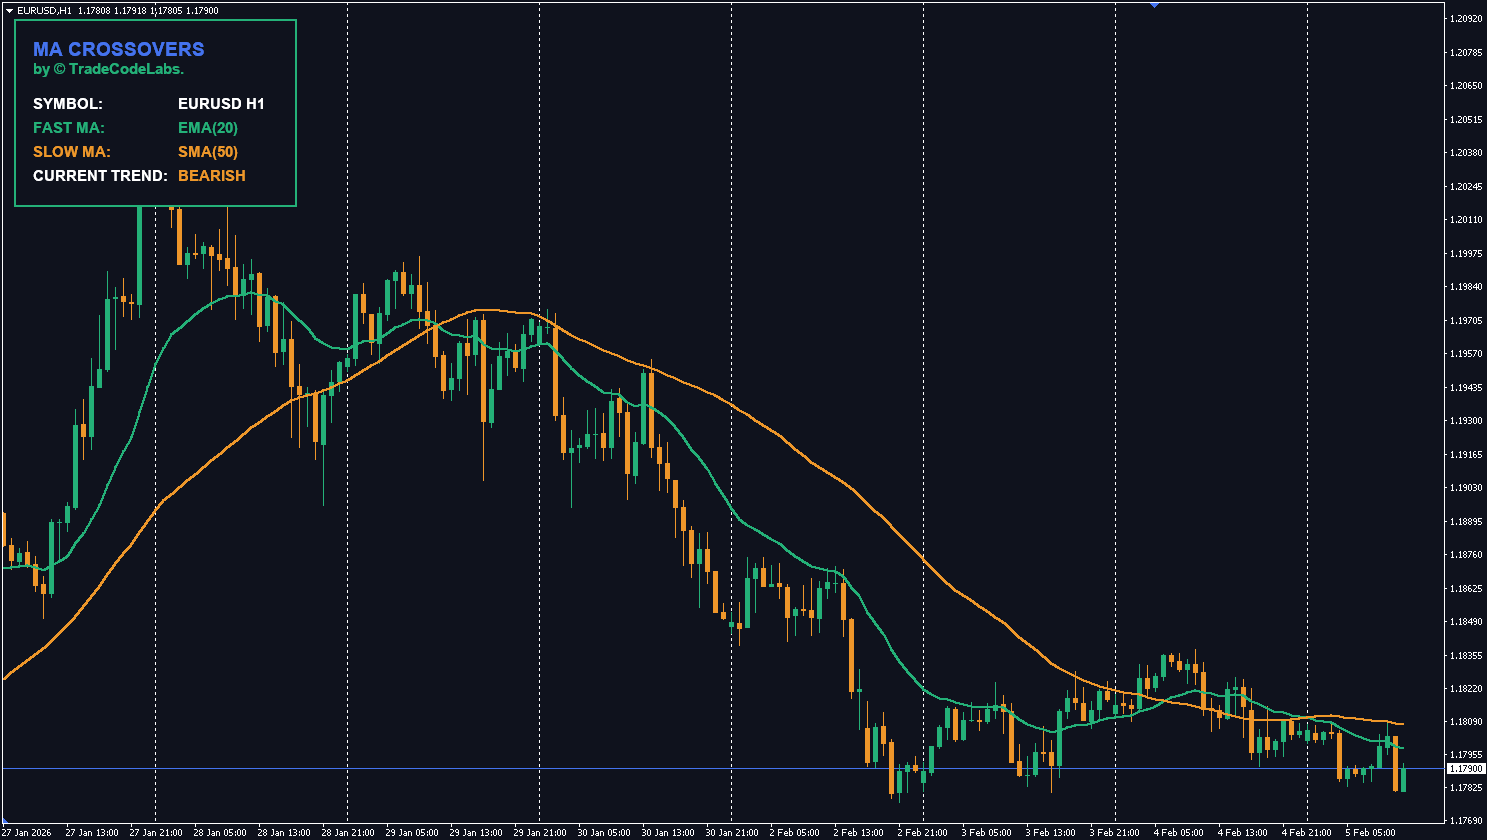
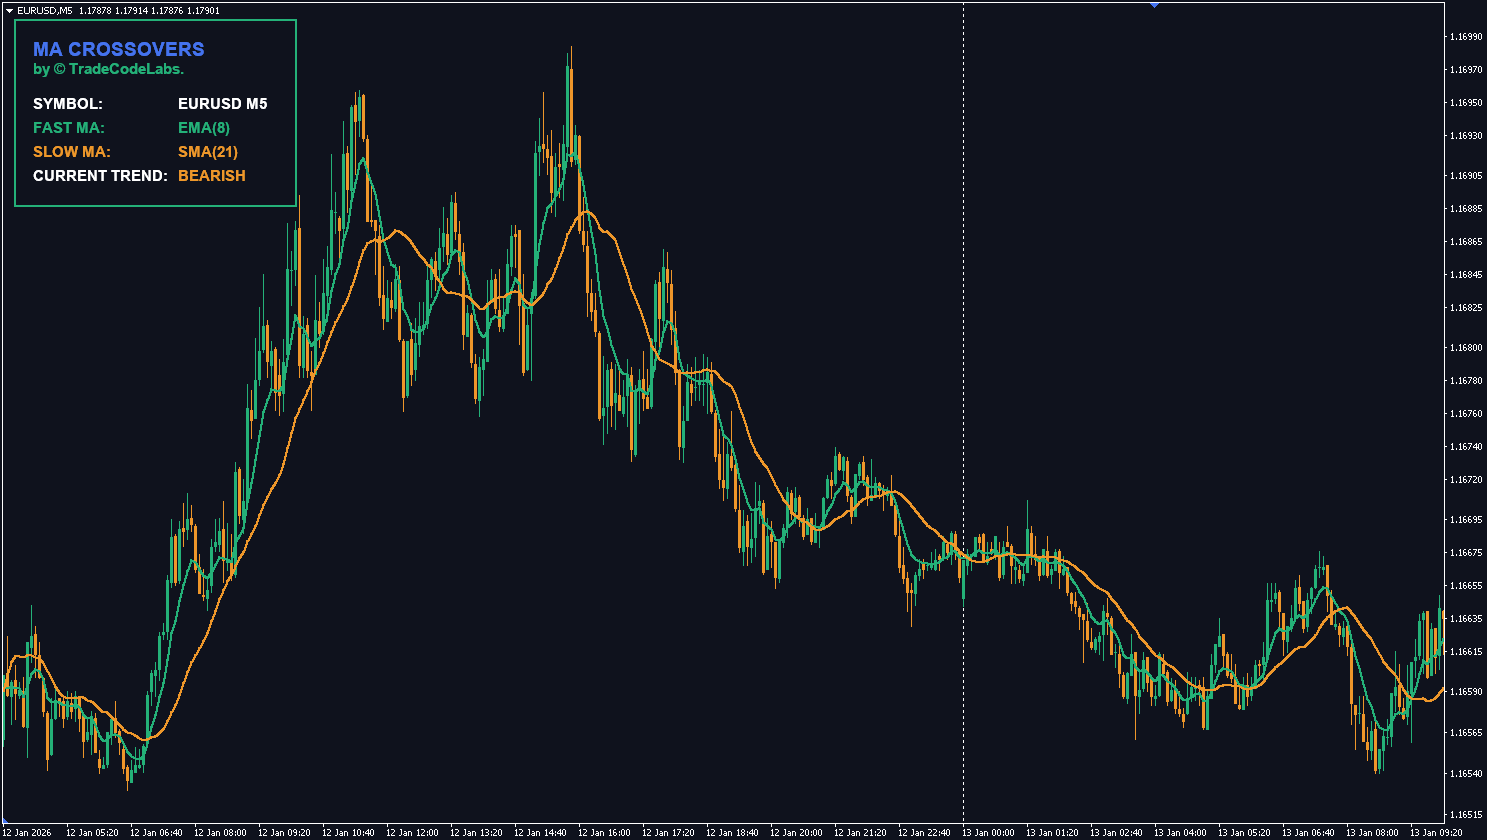
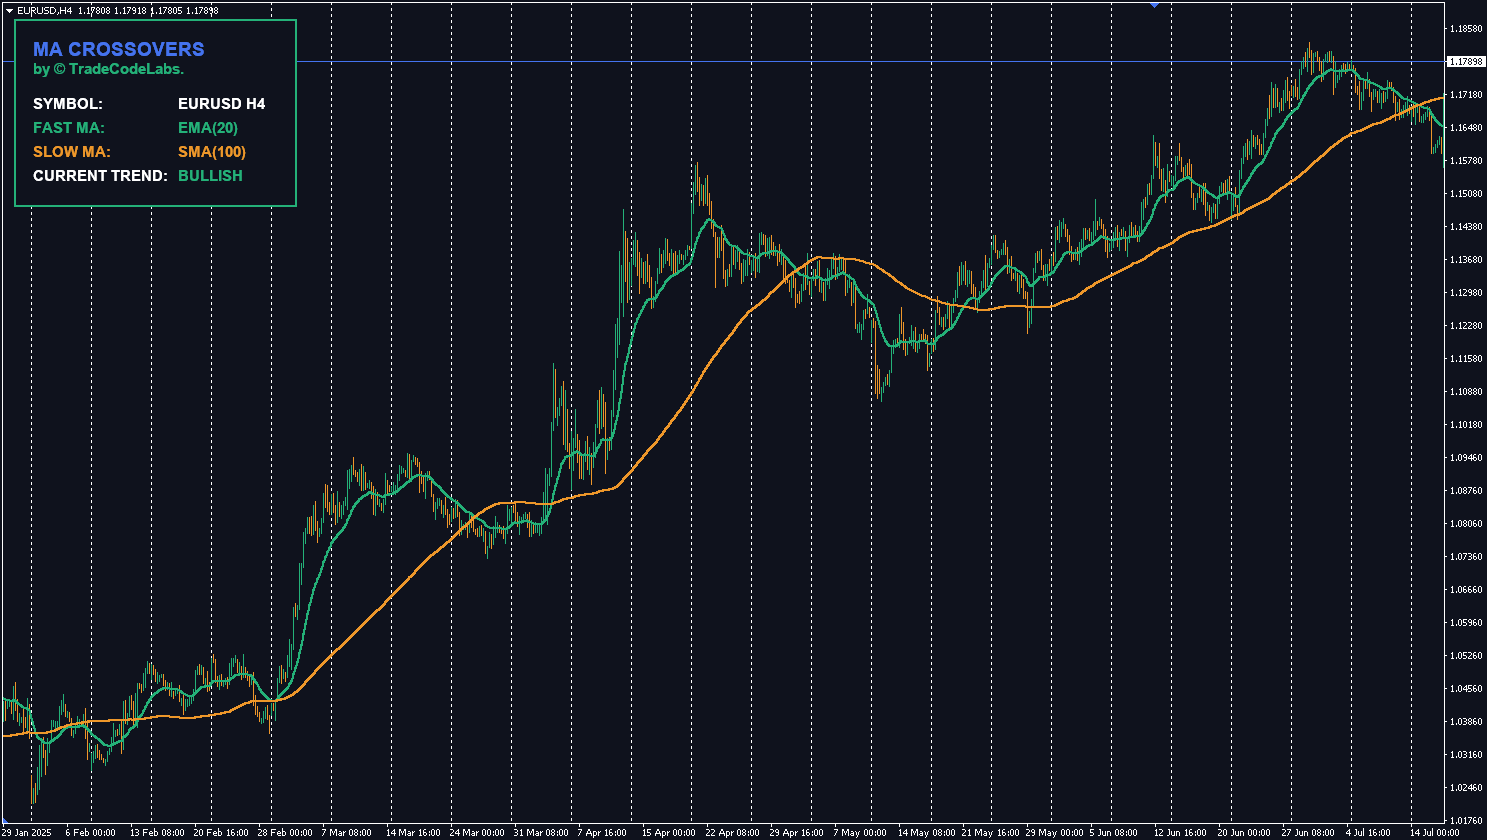
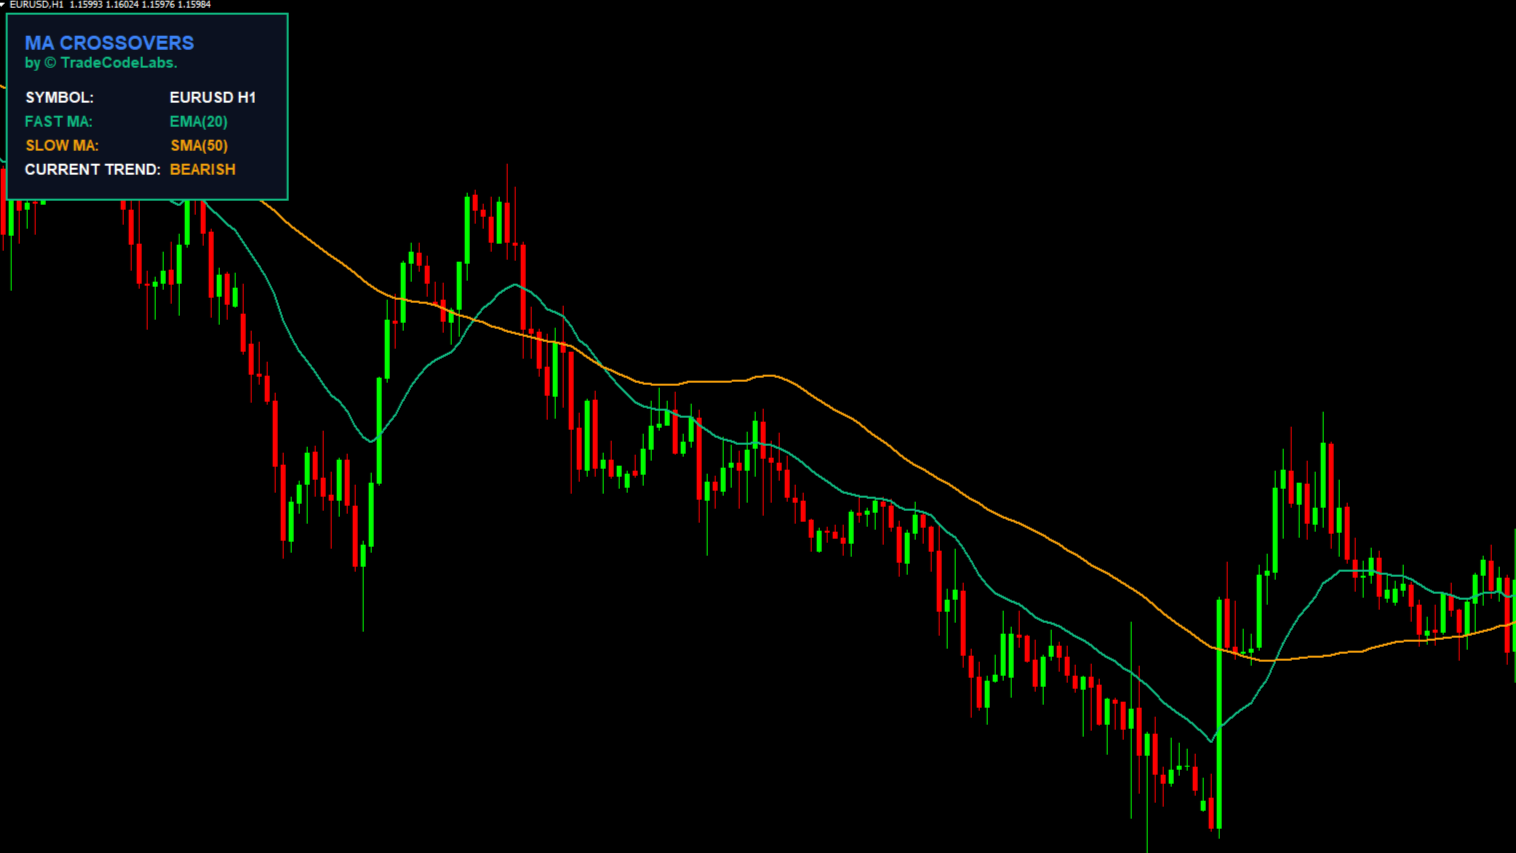
Catch every trend reversal. The TCL MA Crossovers indicator allows you to fine-tune Fast and Slow Moving Averages for every single timeframe independently. It features a live dashboard and sends instant alerts (Popup, Email, Push) when a crossover is confirmed.
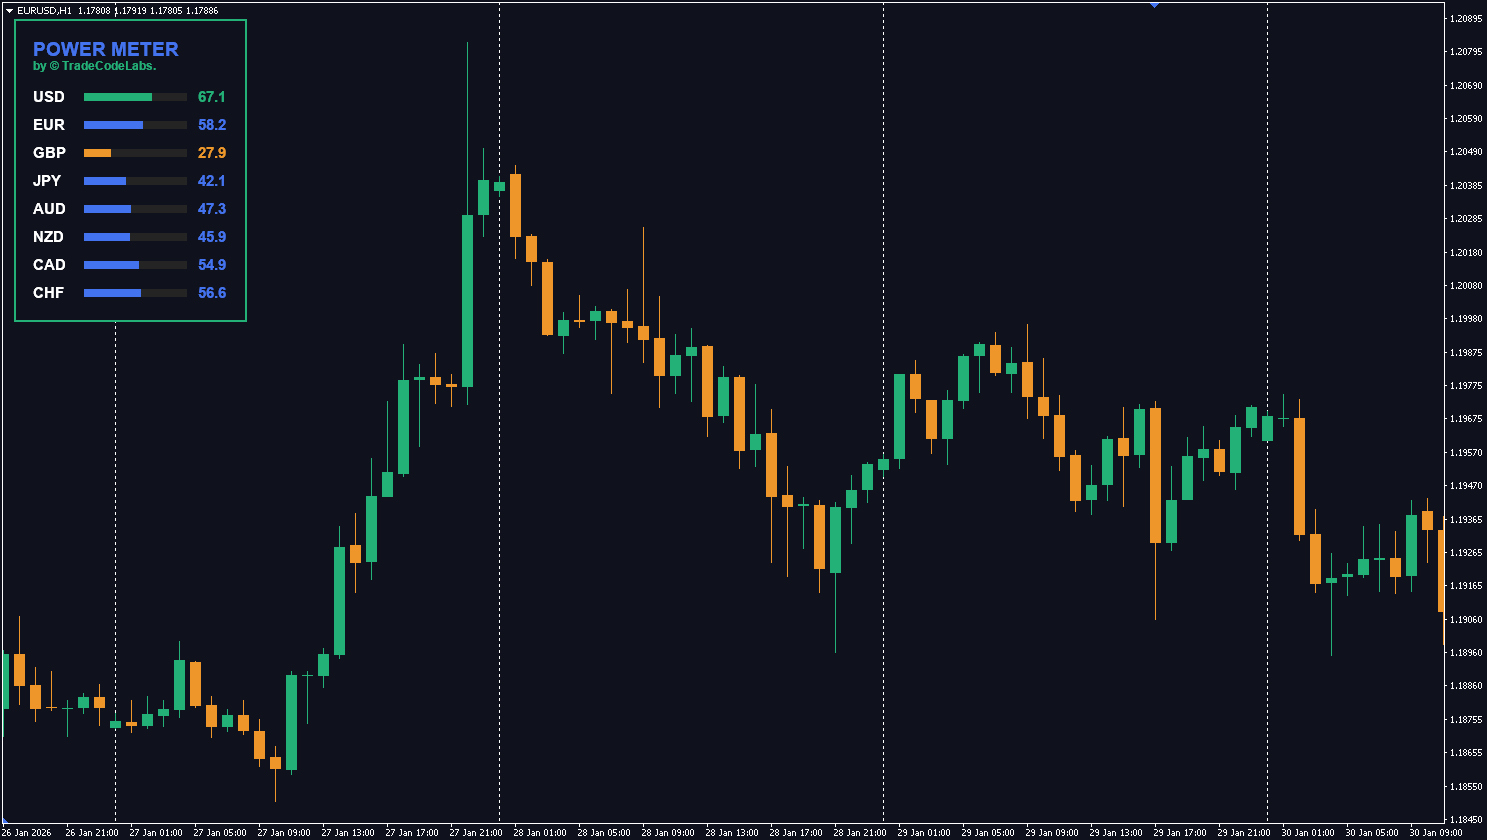
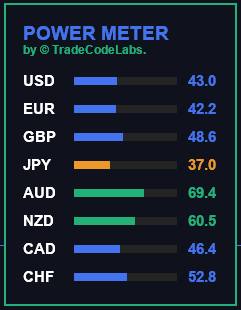
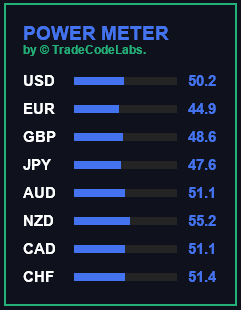
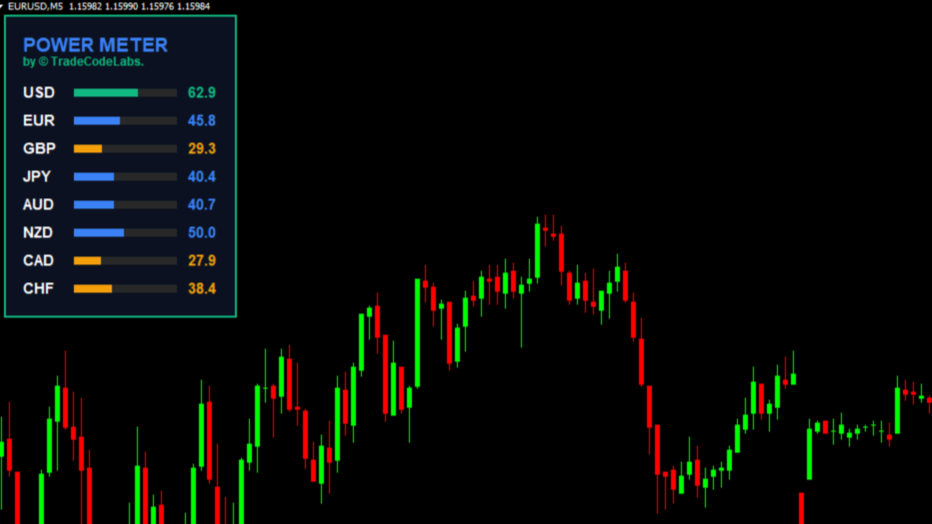
Stop guessing which pair to trade. The TCL Power Meter analyzes 8 major currencies against the entire market using an aggregated RSI formula, giving you a clear 0-100 strength score to spot trends instantly.
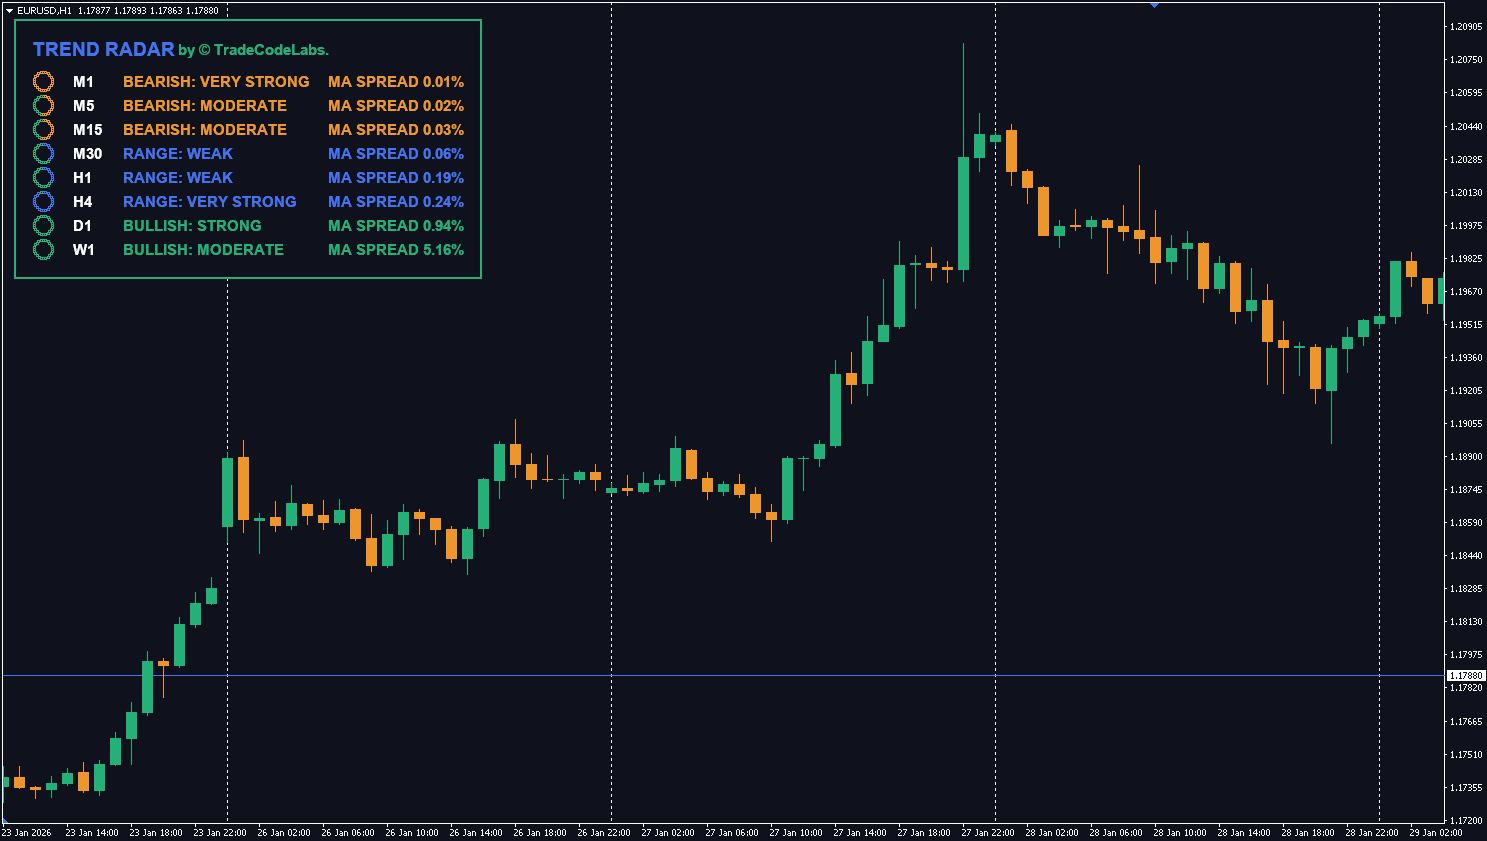
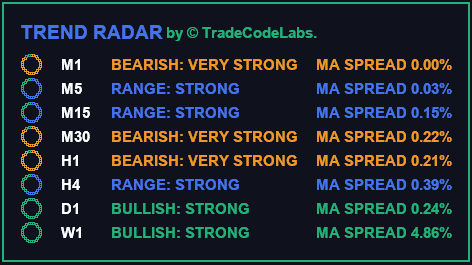
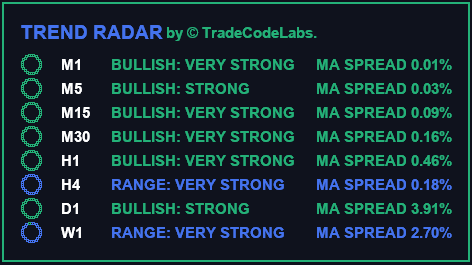
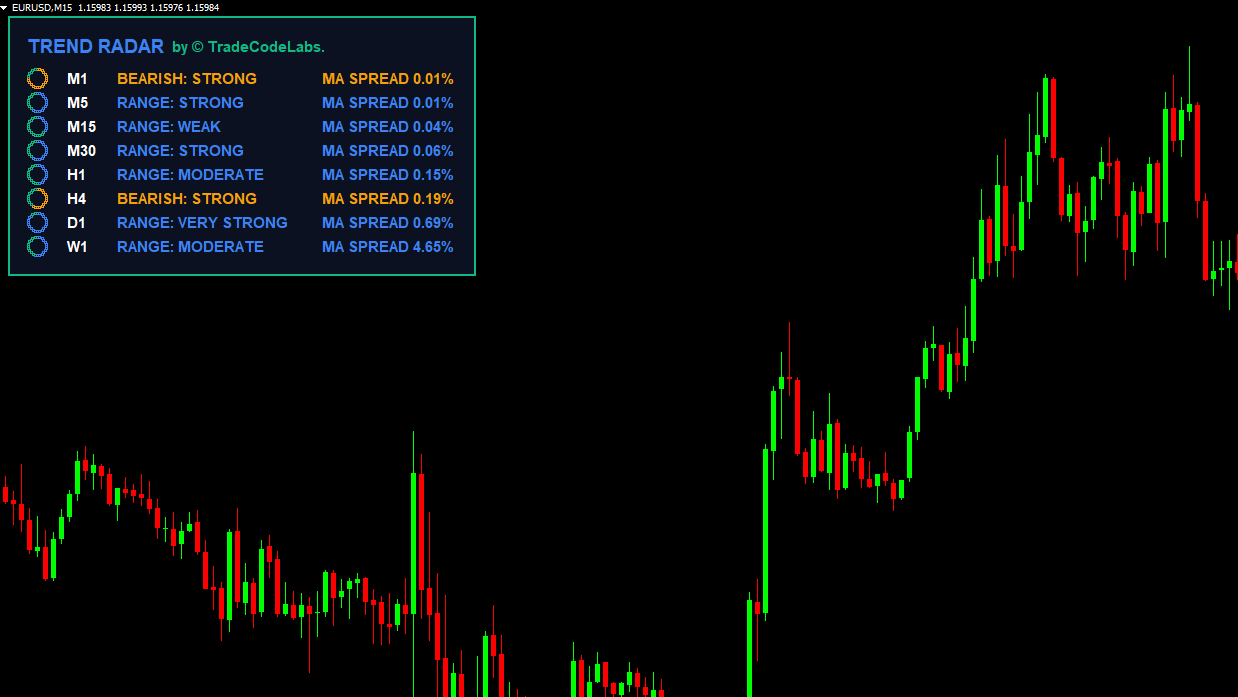
Stop switching charts to check the trend. TCL Trend Radar brings the entire market structure to a single dashboard. It uses a "Triple-Lock" algorithm (MA Cross + DMI + ADX) to grade trends from "Weak" to "Very Strong," visualized by a unique "Power Ring" gauge. Includes optional 200 SMA trend filtering and global alerts.
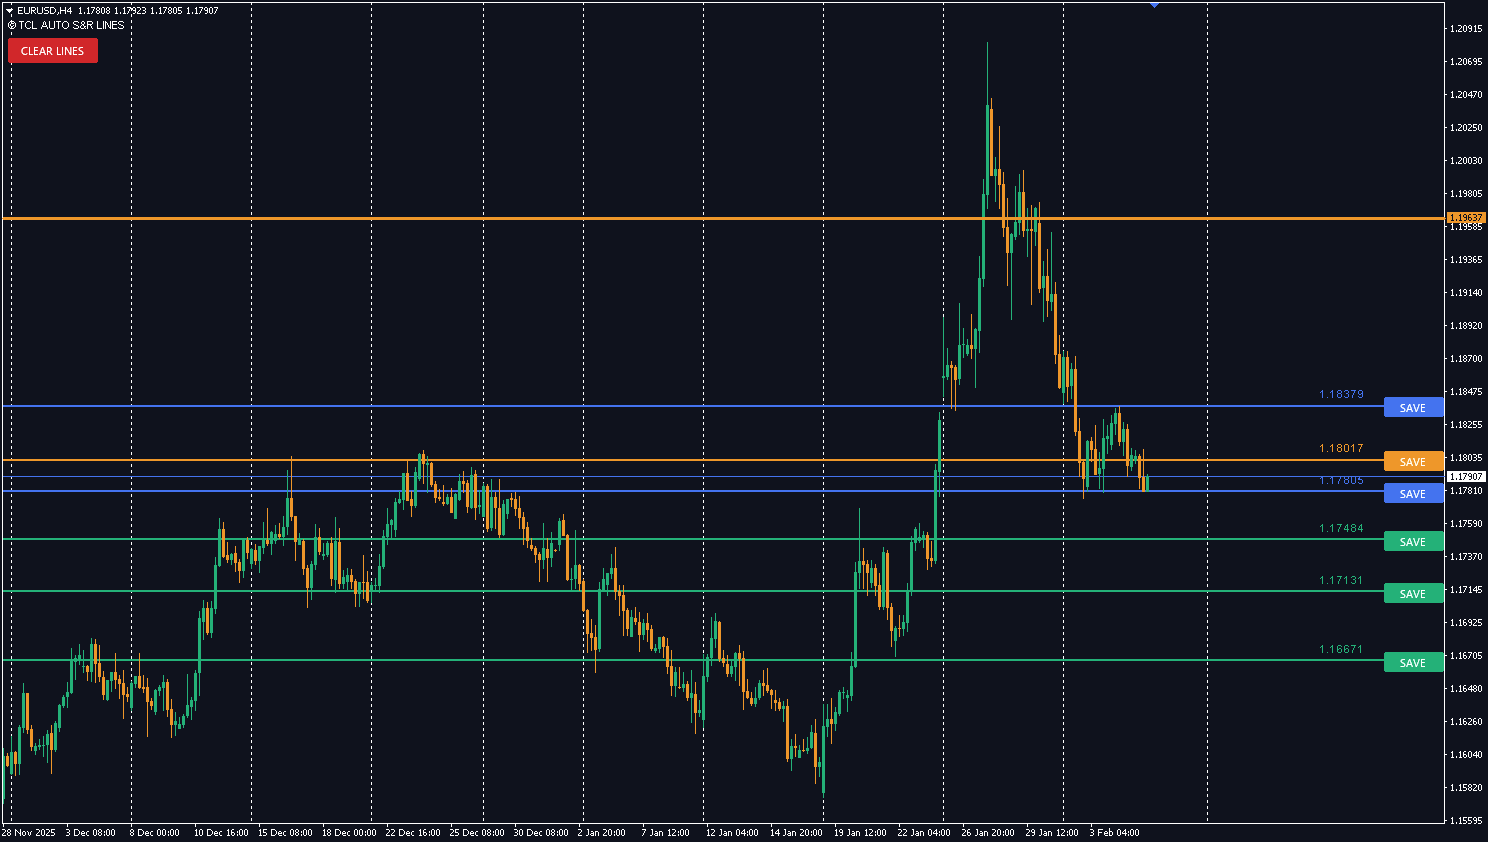
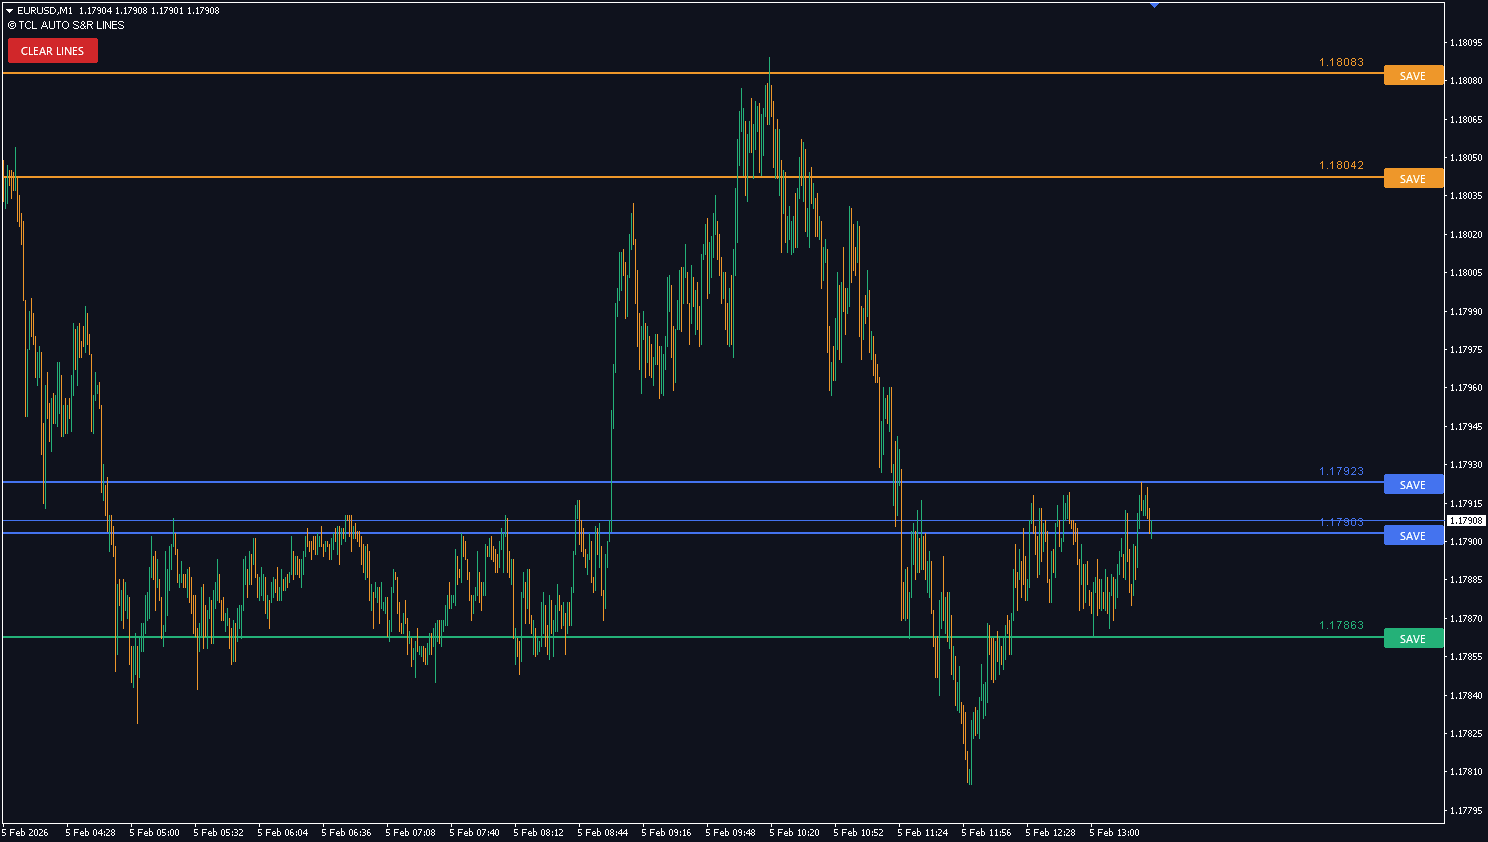
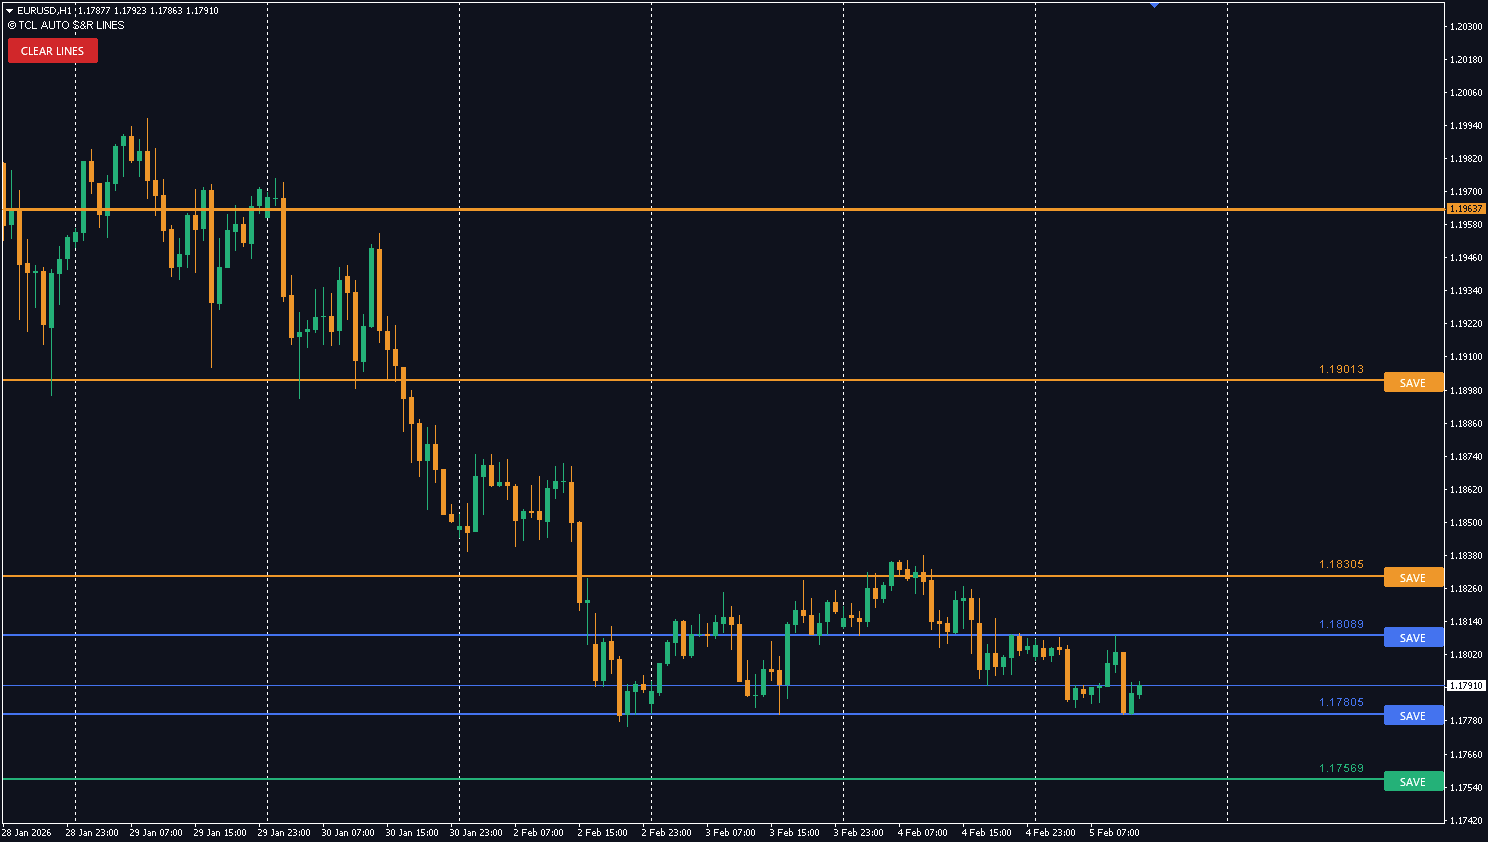
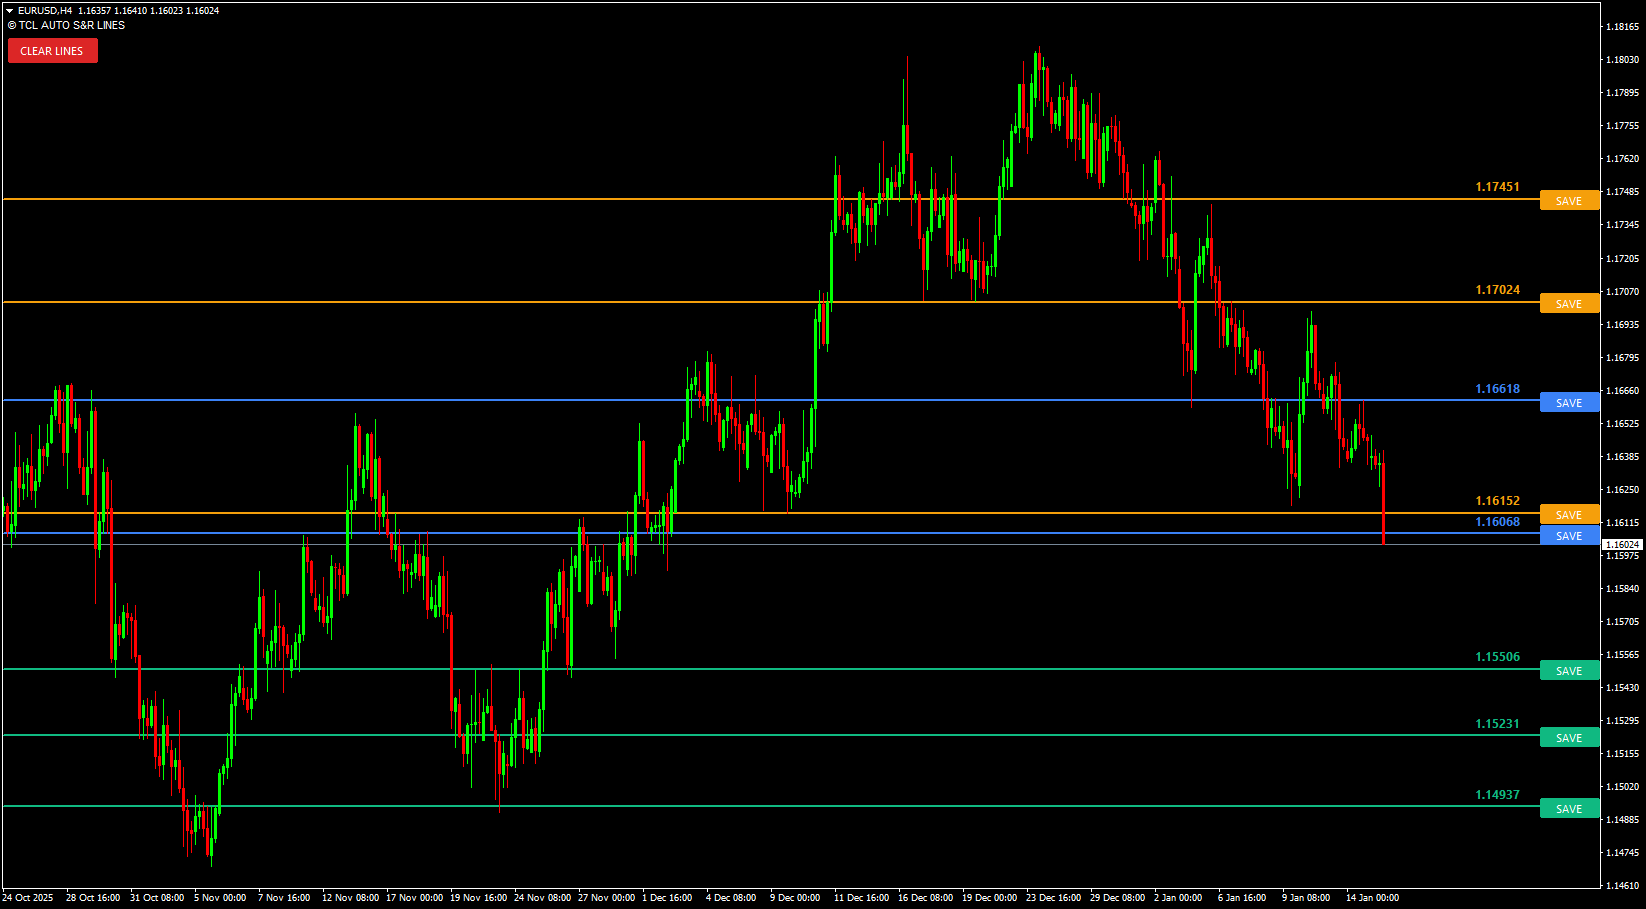
Stop guessing where to draw your lines. This indicator automates technical analysis by identifying high-probability Support and Resistance zones using a hybrid algorithm. Features exclusive One-Click Level Locking to save key prices before the market shifts.
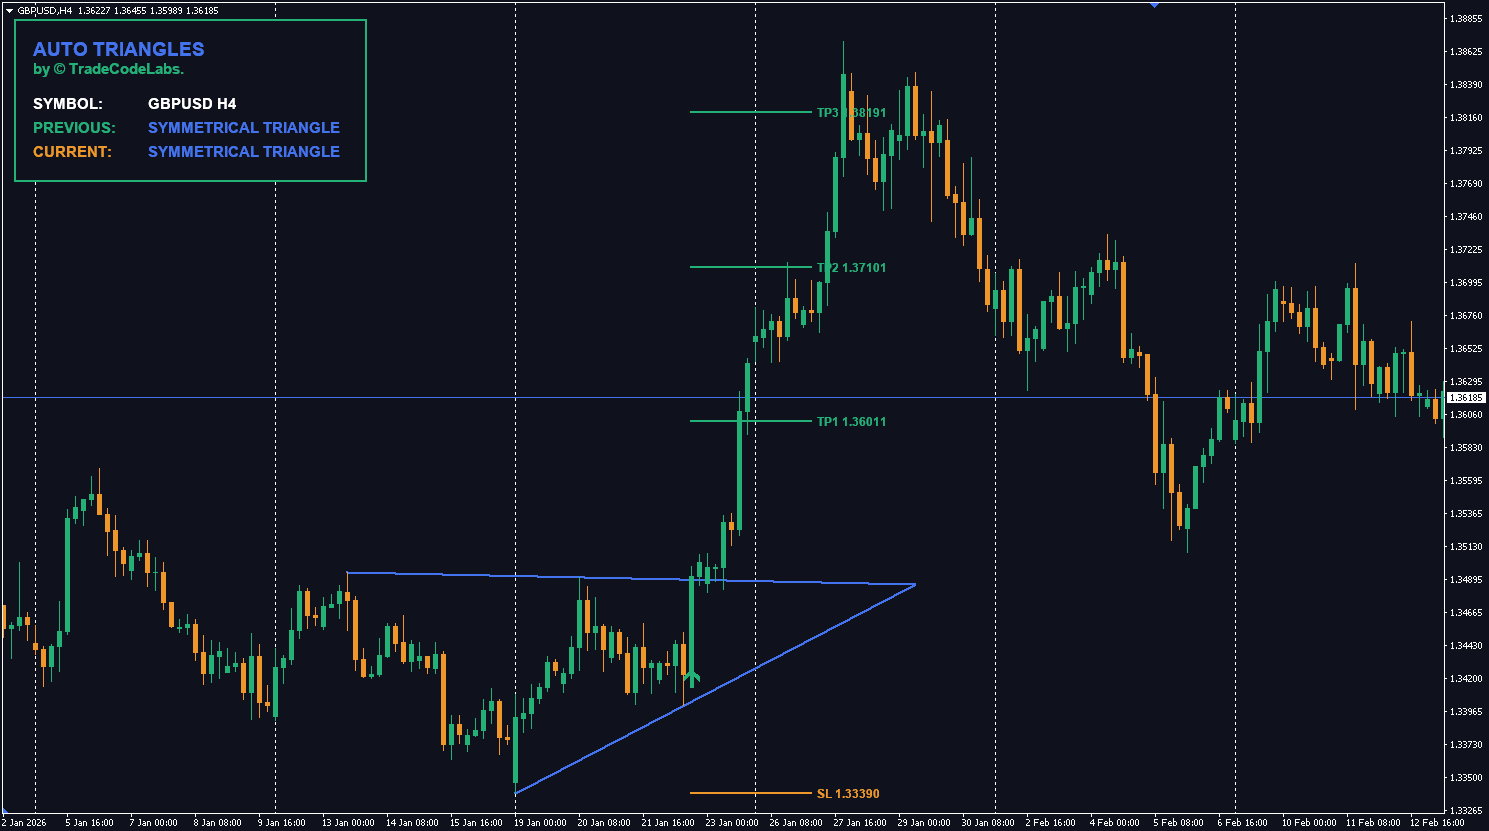
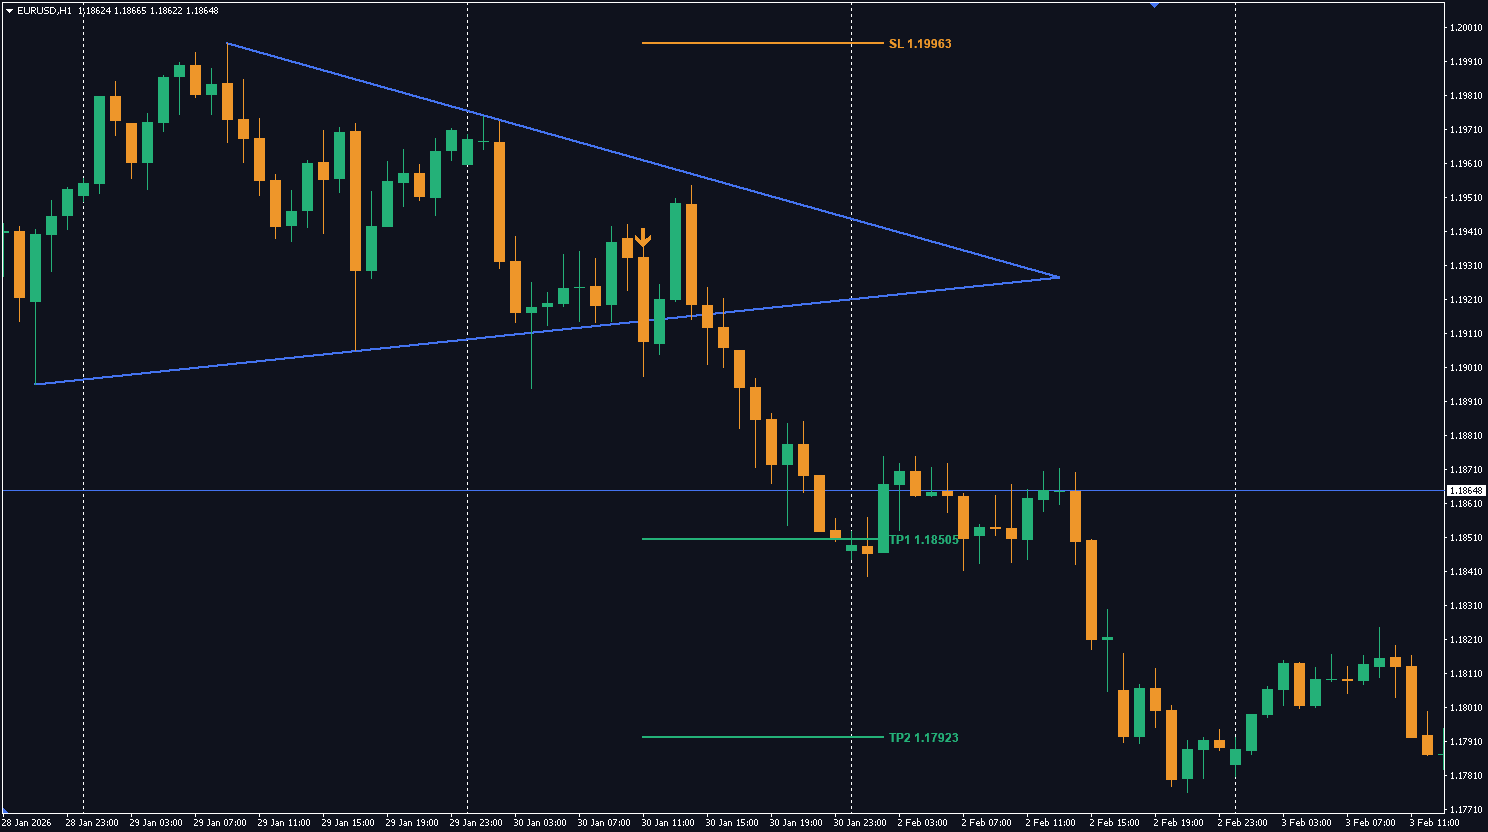
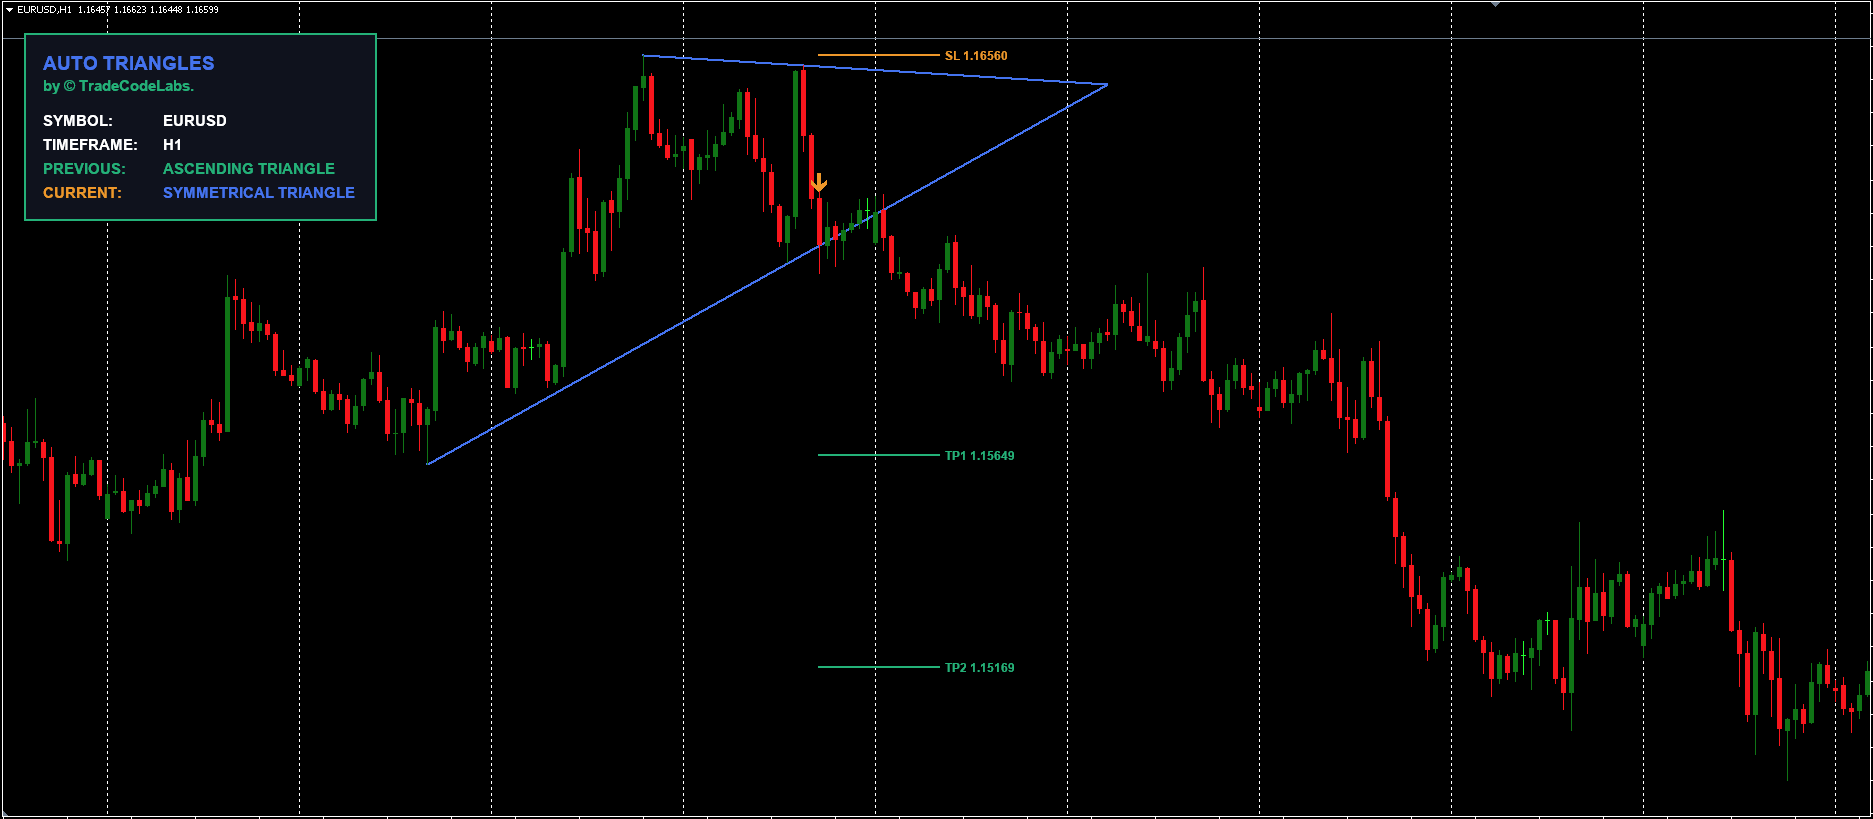
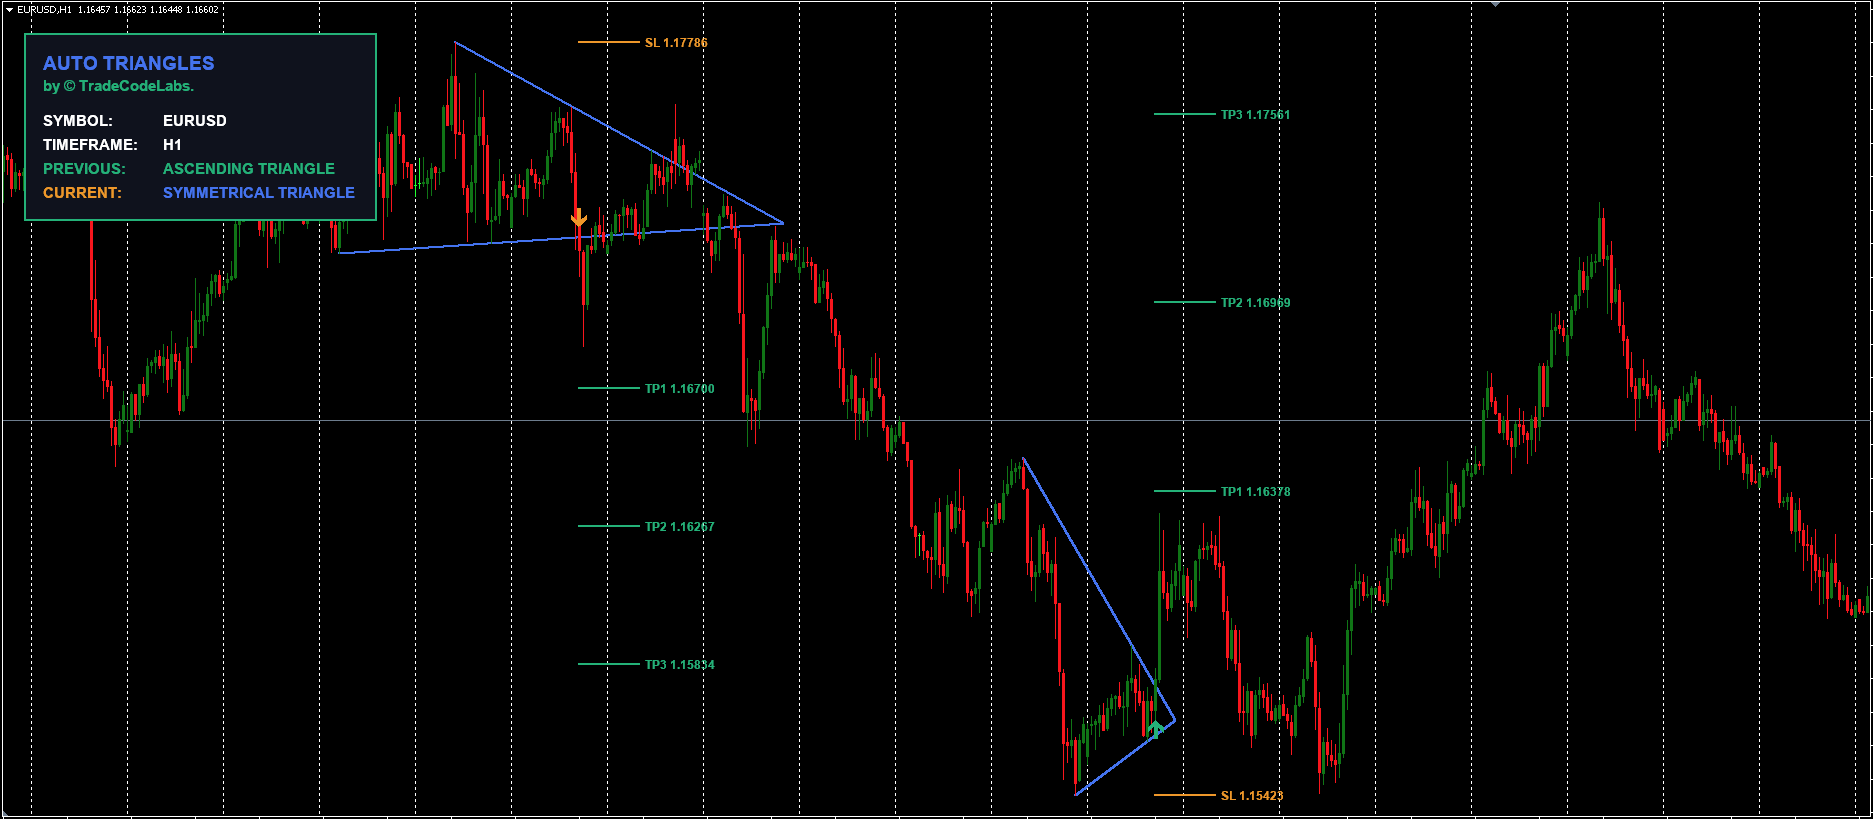
Trading chart patterns is powerful but subjective. The TCL Auto Triangles indicator removes the guesswork by using a rigorous ZigZag algorithm to identify valid triangle formations. It waits for a confirmed breakout and instantly projects three Take Profit levels and a Stop Loss.
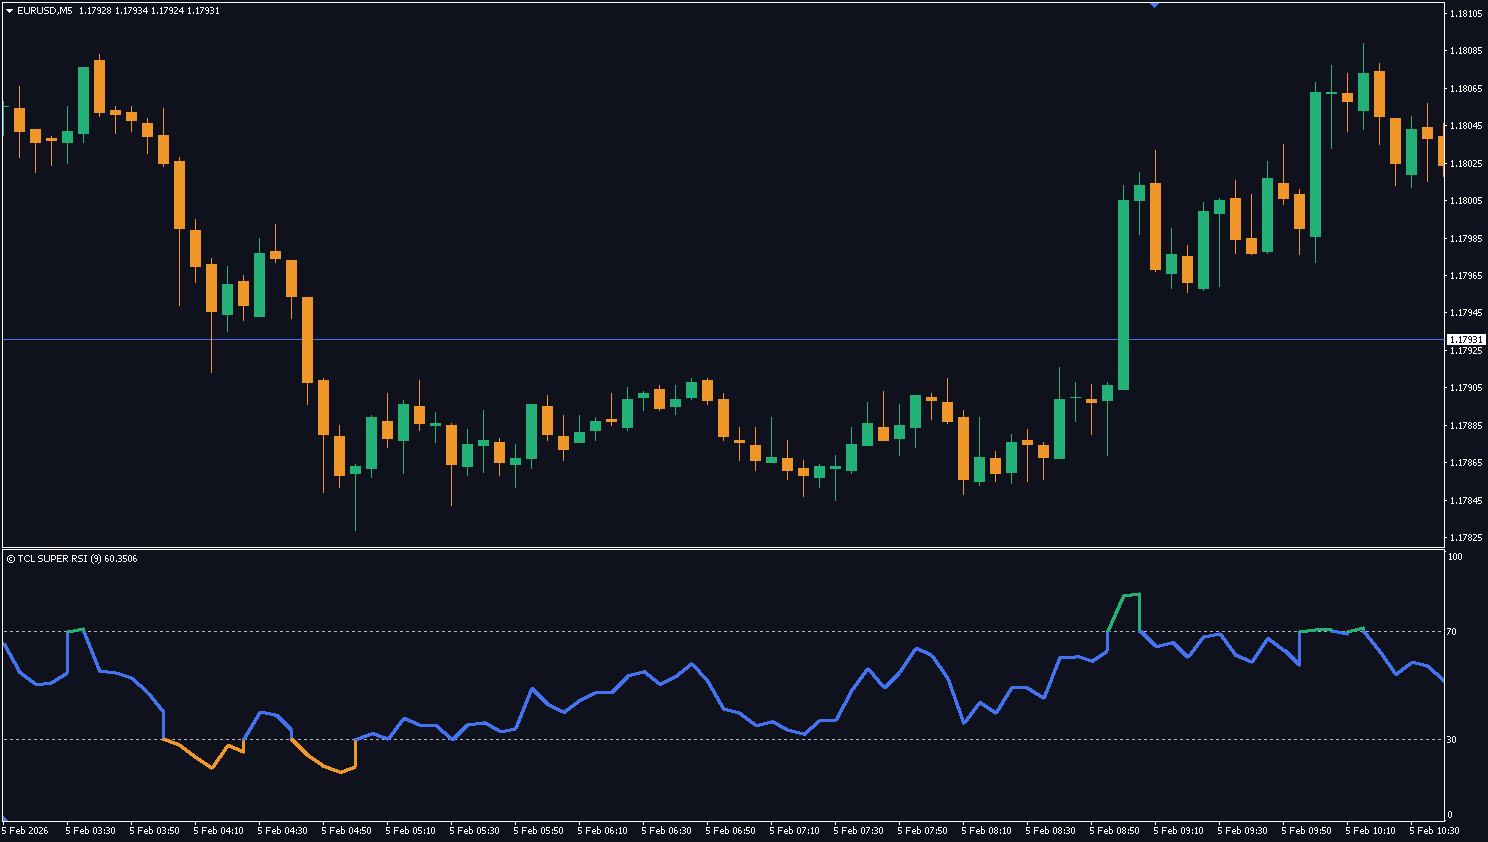
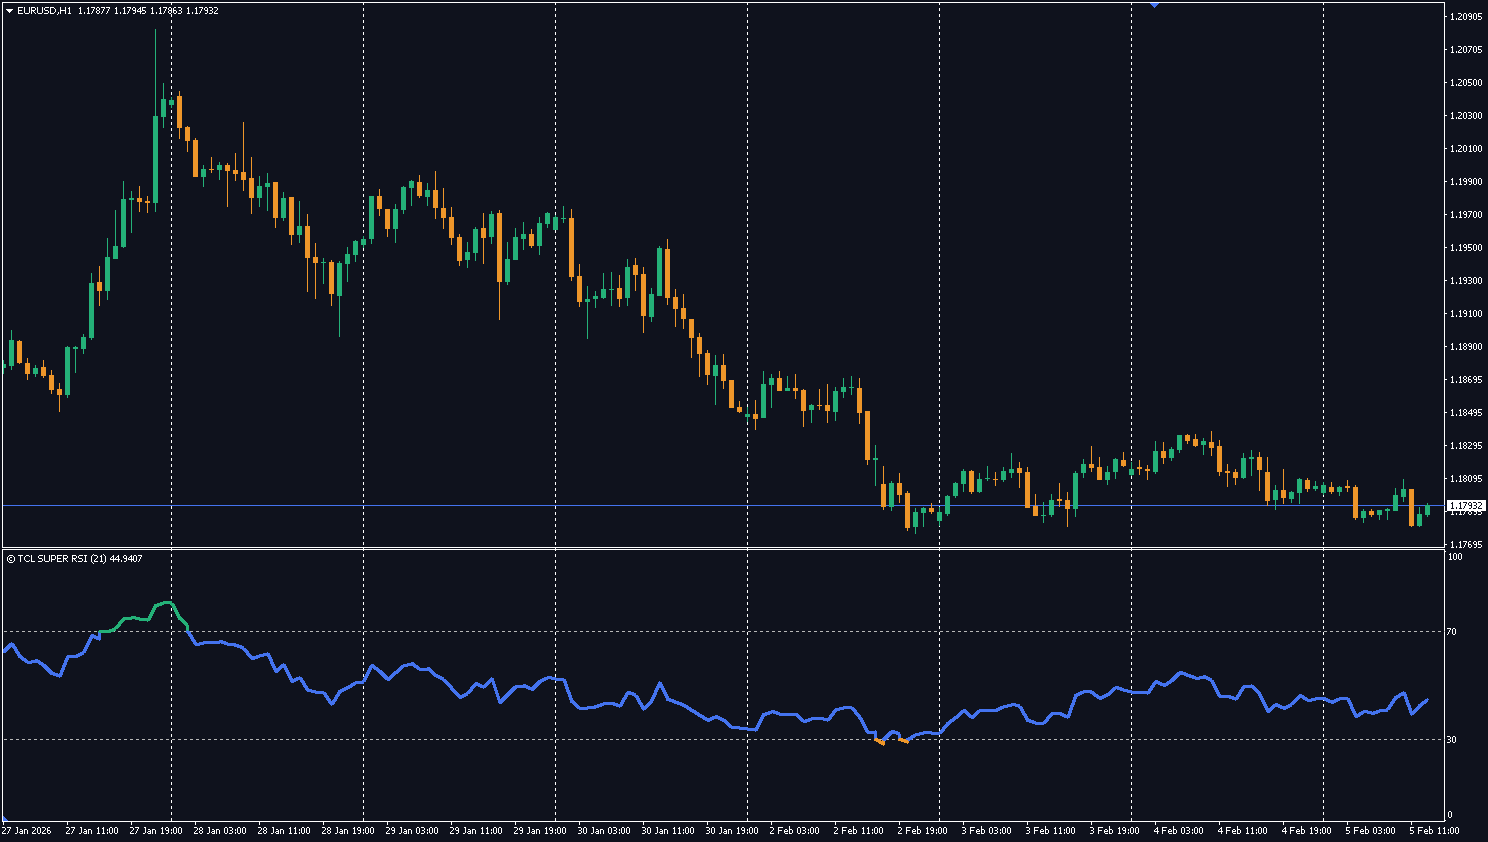
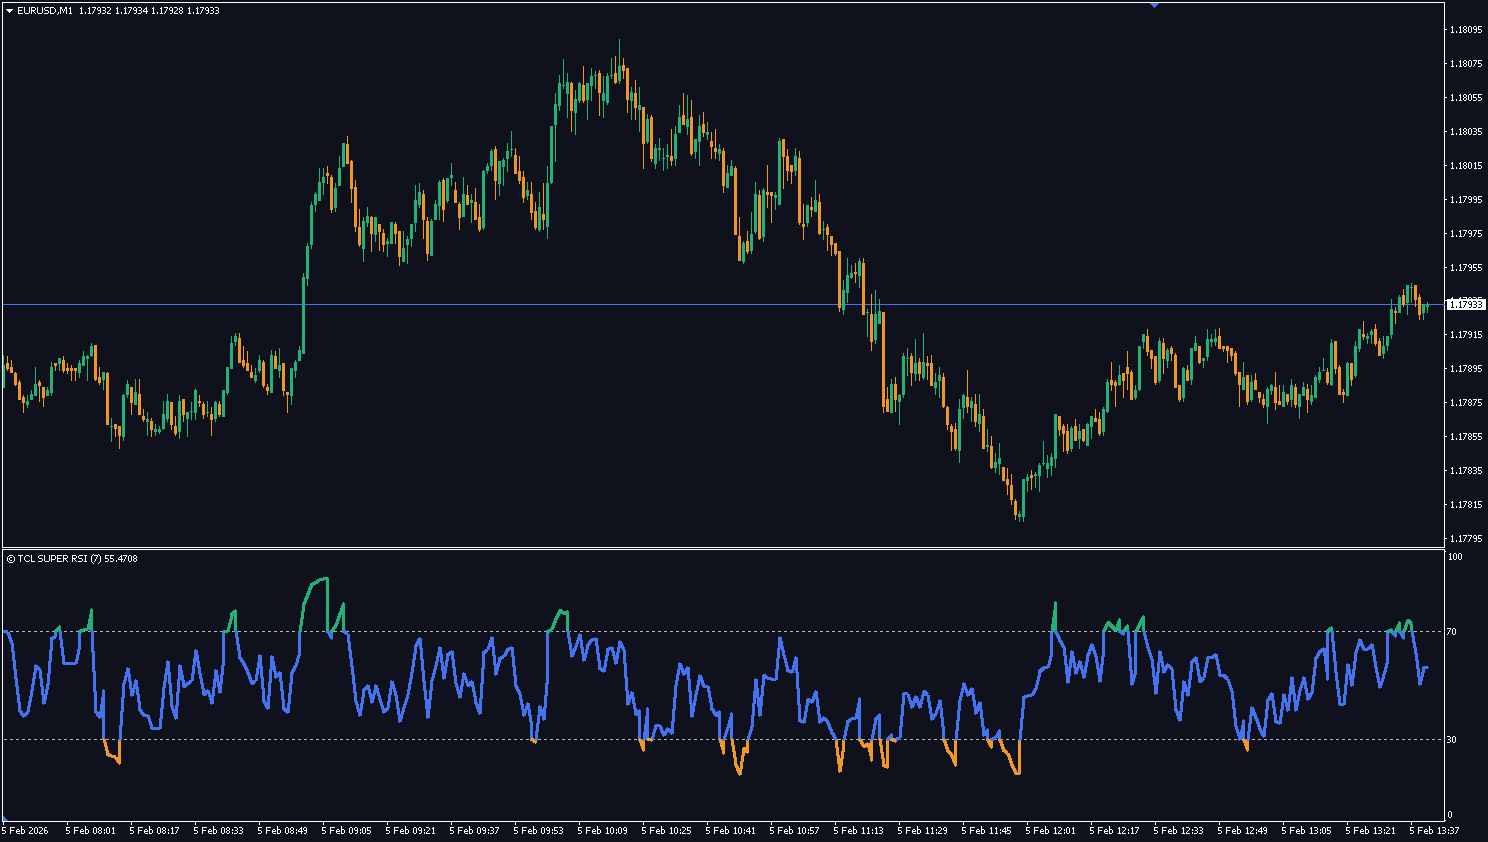
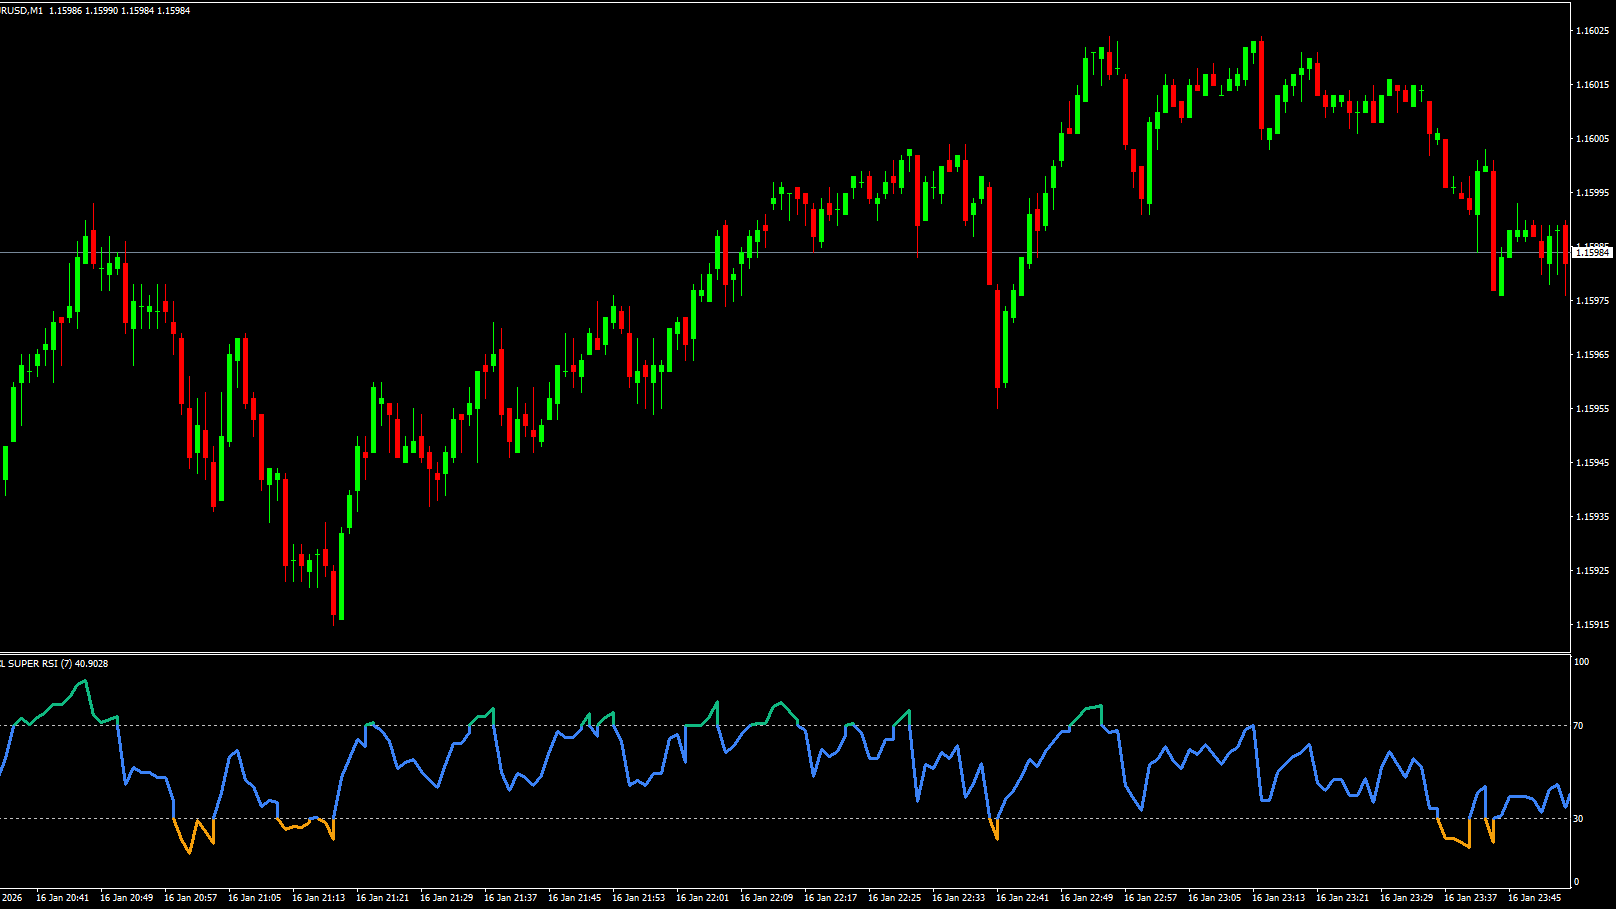
Standard RSI indicators use a static "14-period" setting that often lags on lower timeframes or generates false noise on higher ones. TCL Super RSI solves this by detecting your chart's timeframe and instantly applying mathematically optimized settings—from 7-period sensitivity for M1 scalping to smoothed 50-period logic for Monthly analysis.