Fibonacci retracements are the backbone of market geometry, helping traders identify where a pullback might end (Support/Resistance) and where a trend might extend (Take Profits). The TCL Auto Fibonacci indicator takes the guesswork out of drawing these lines by algorithmically finding the most relevant high and low points based on your trading style.
Three Modes for Every Trader
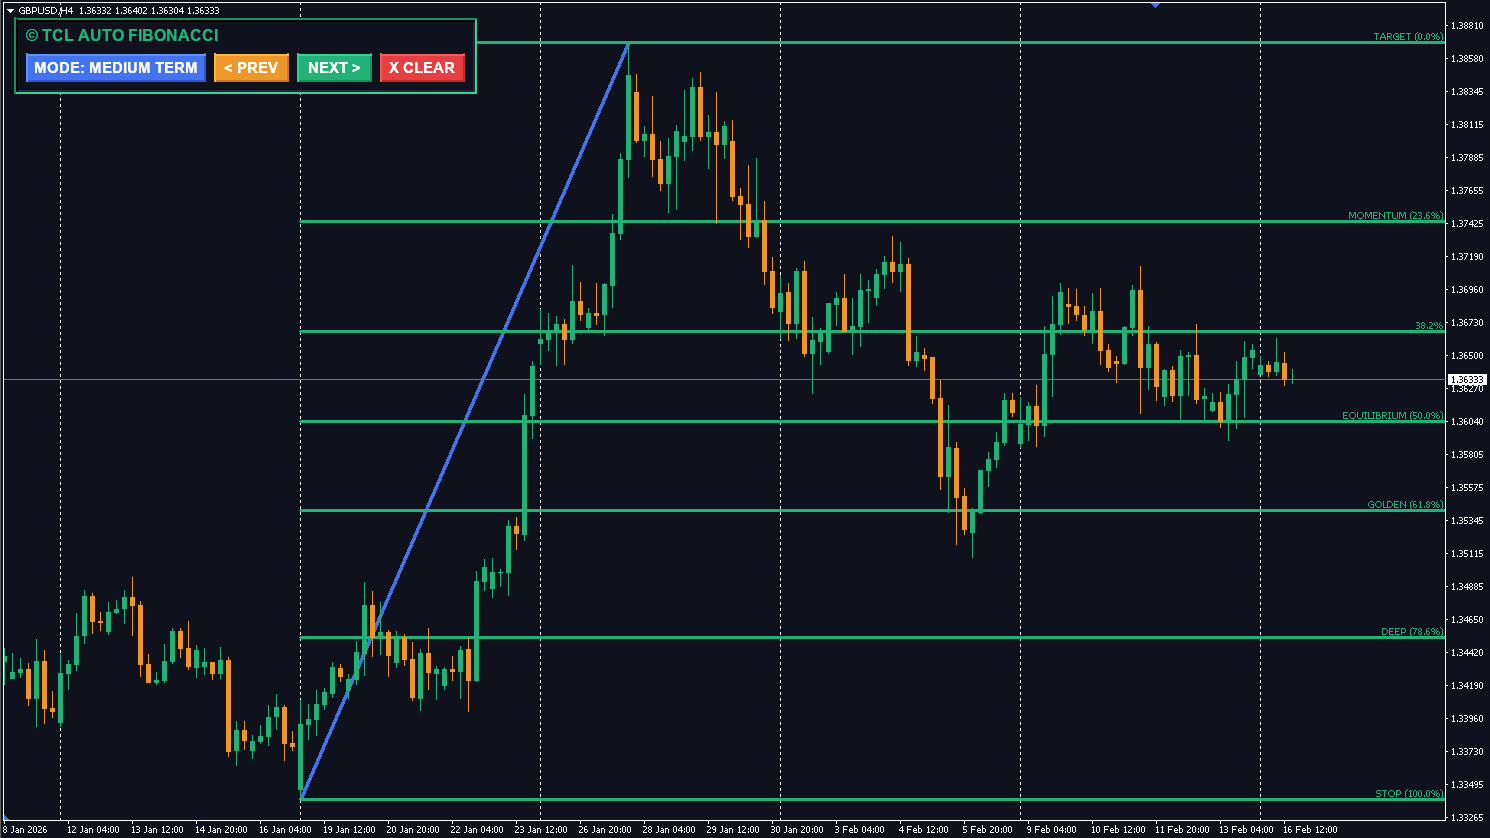
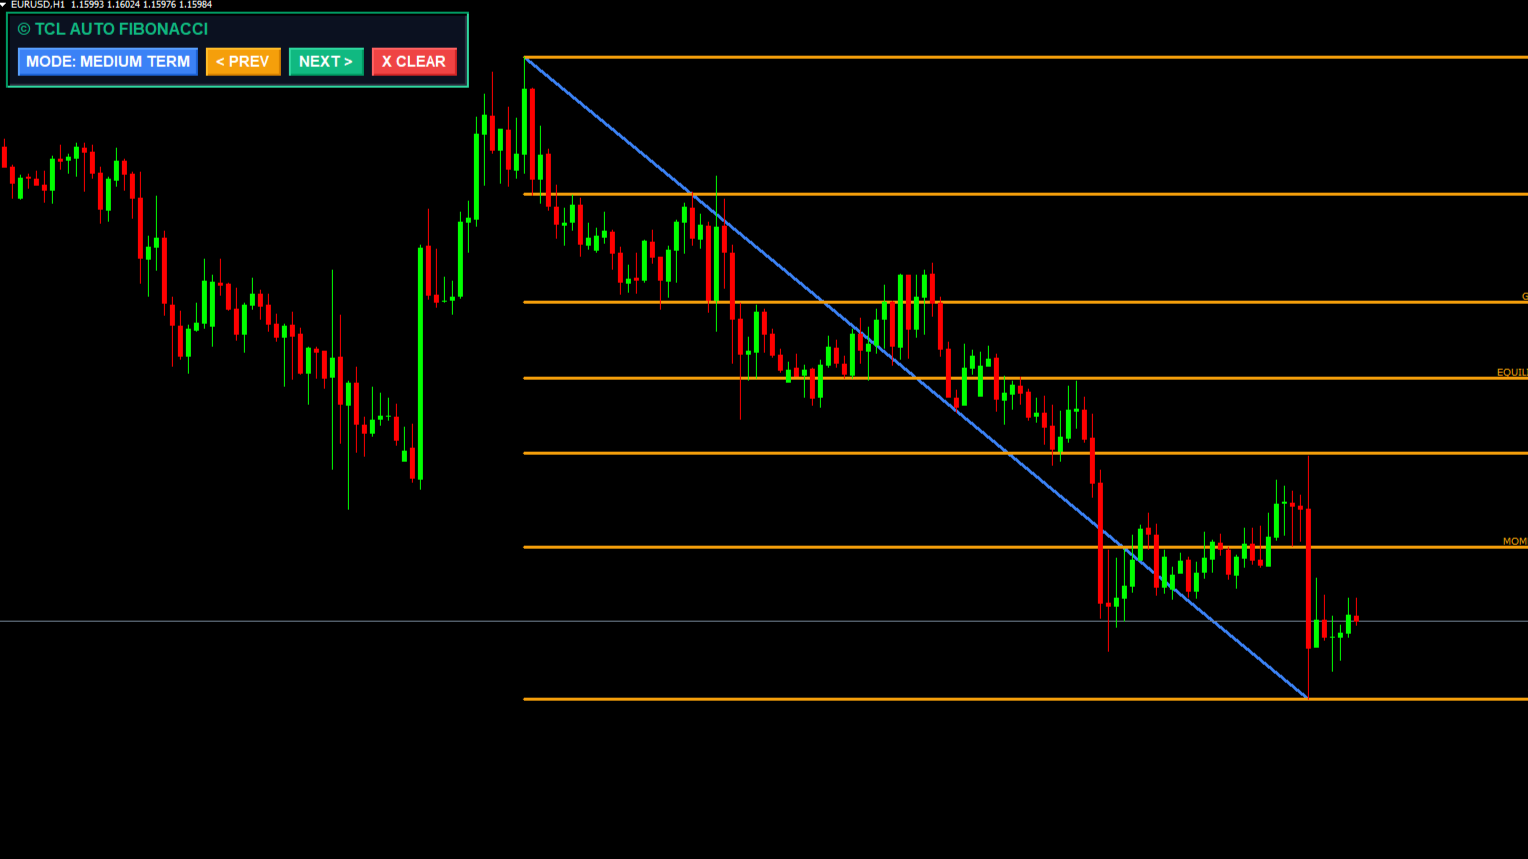
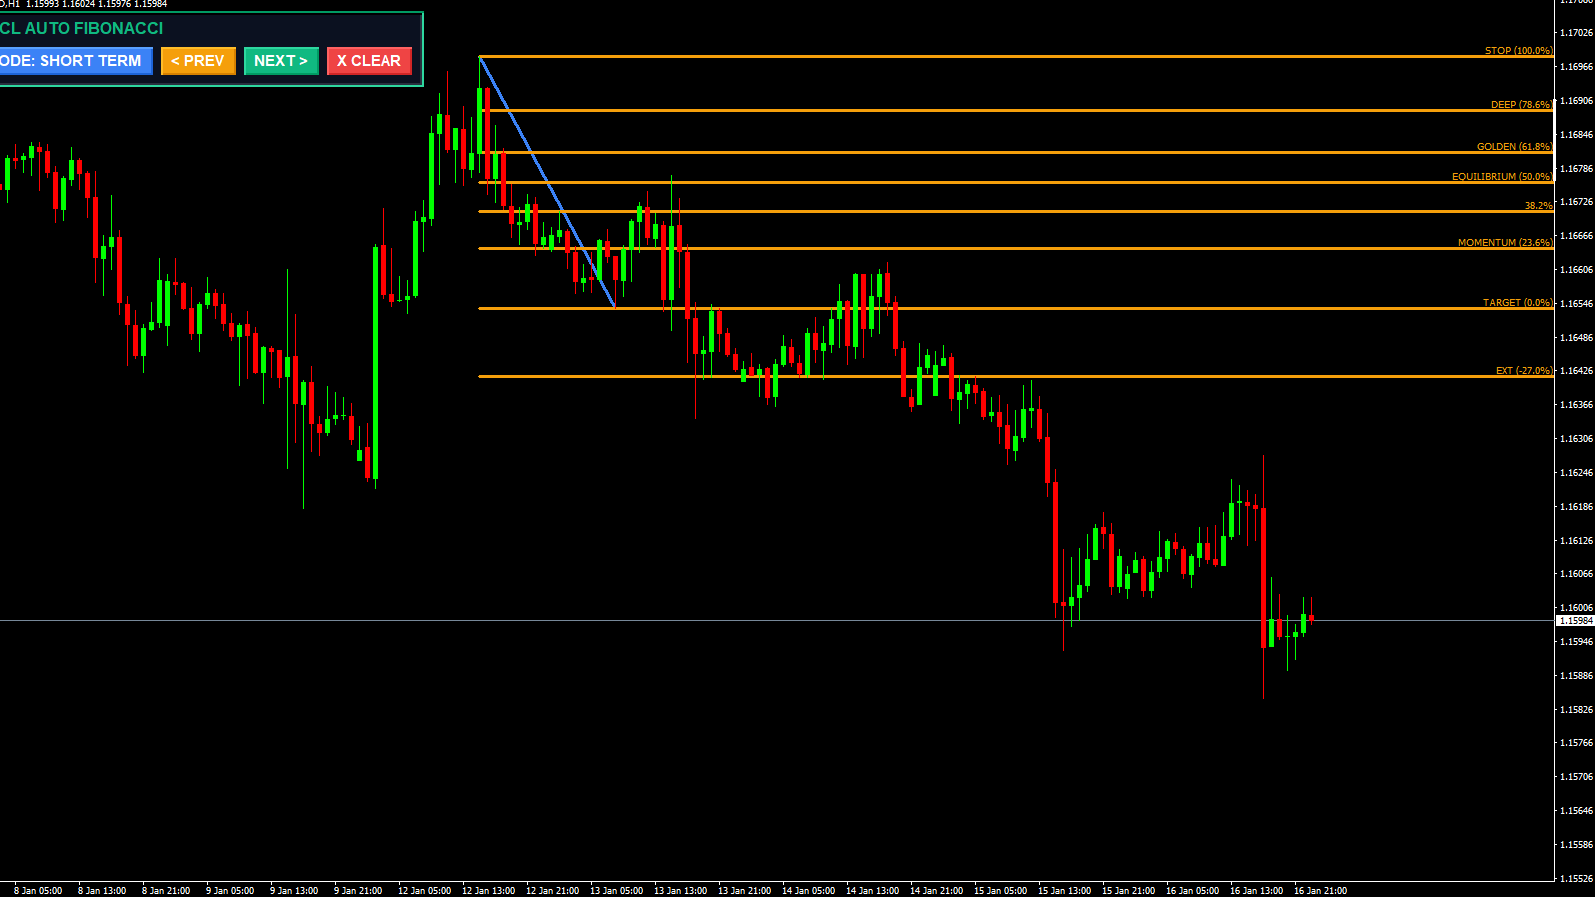
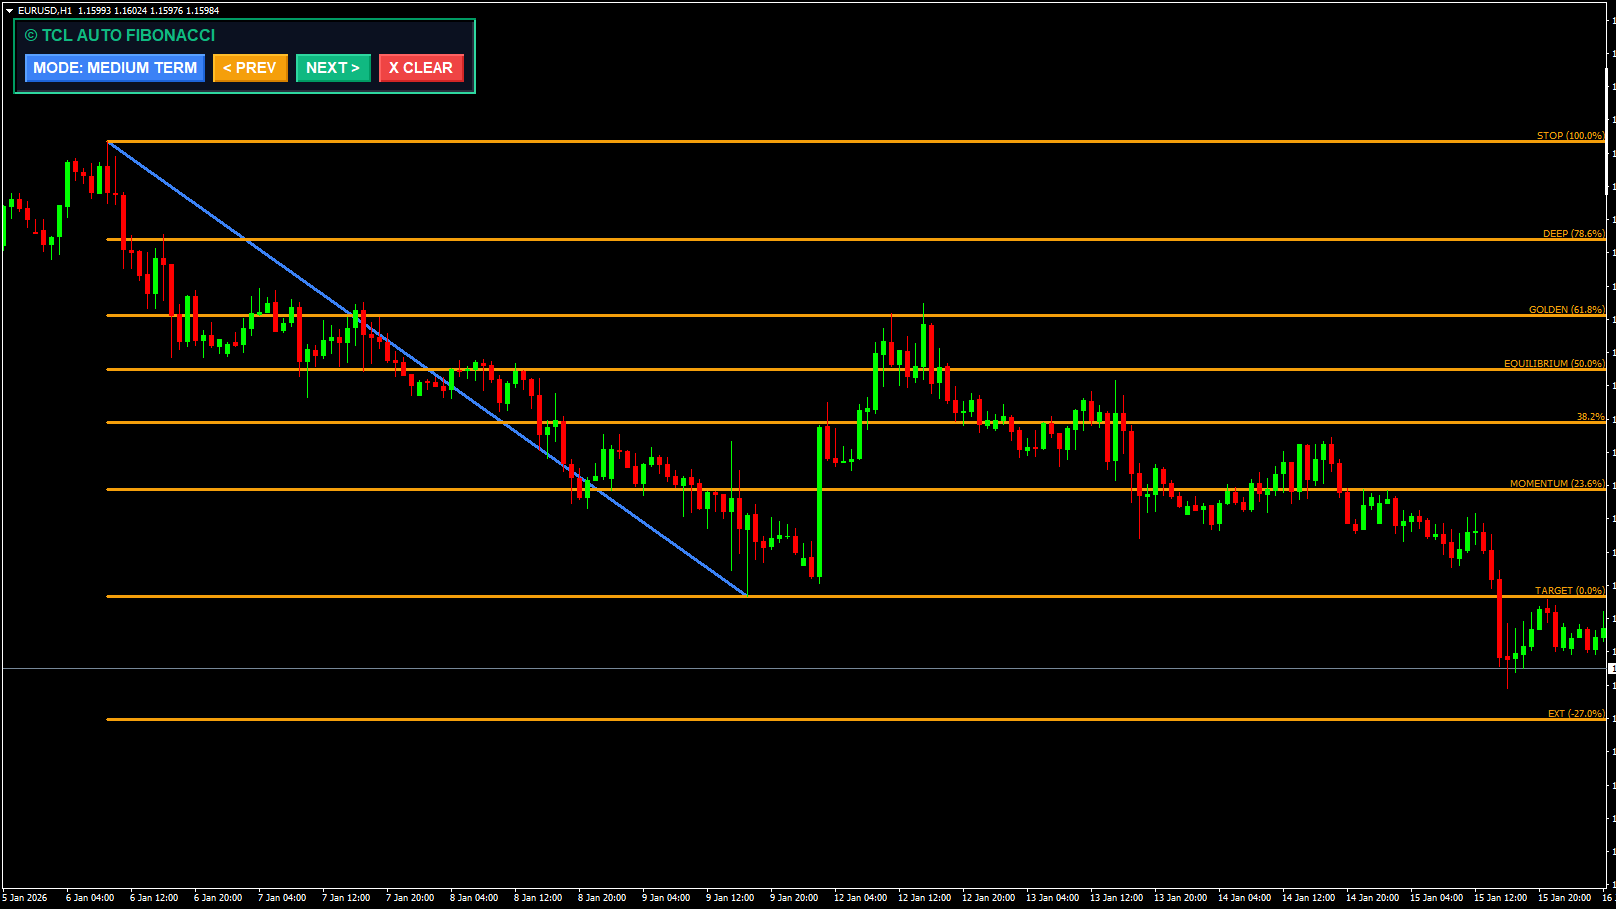
Markets move in fractals. A swing on the 1-minute chart is different from a swing on the Daily. This indicator includes a unique Mode Switcher directly on the chart dashboard:
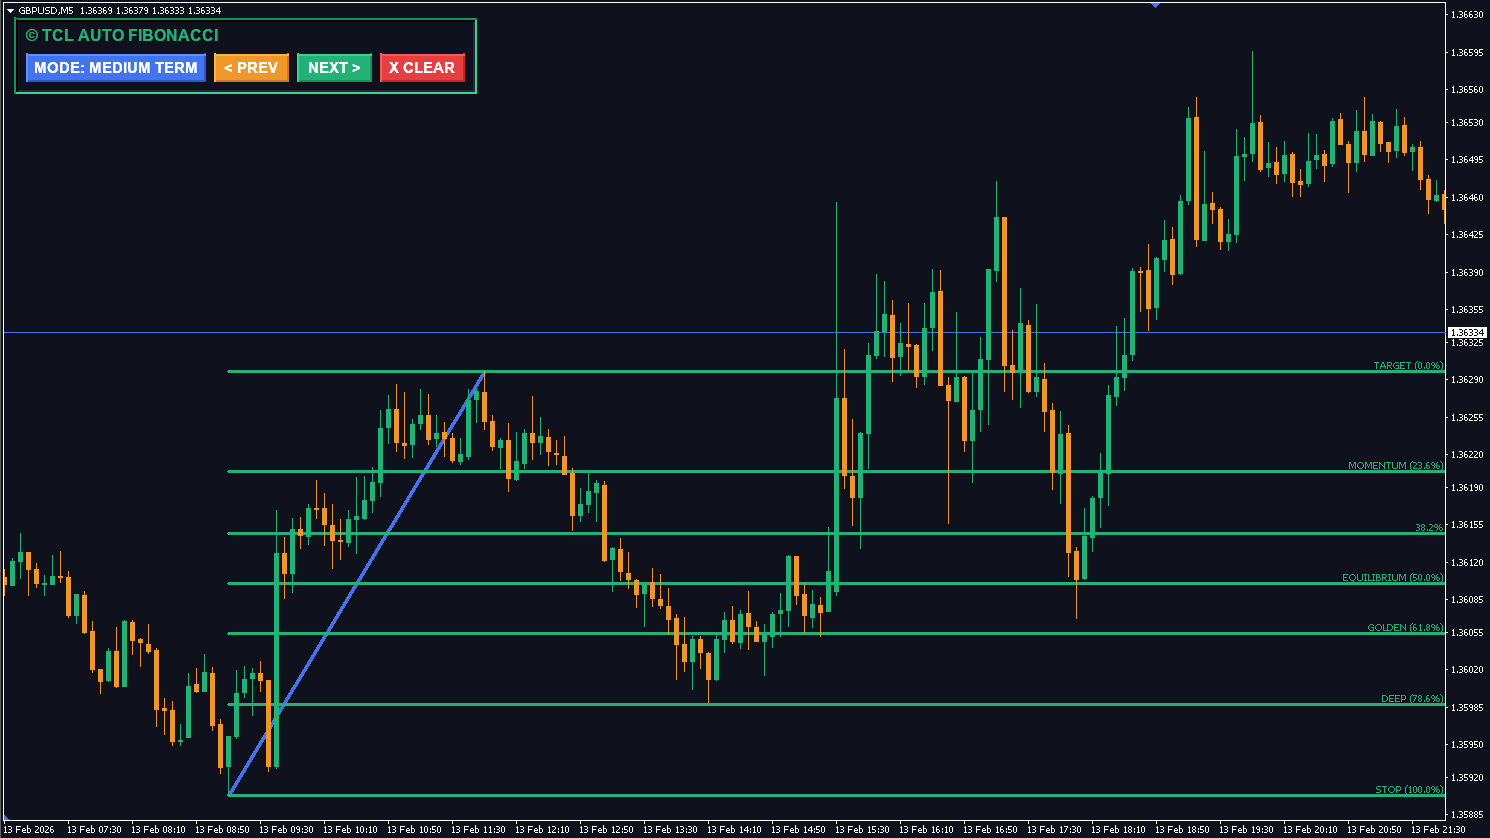
Short Term (Depth 12): Perfect for scalpers looking for immediate micro-pullbacks.
Medium Term (Depth 36): Ideal for day traders capturing the main move of the session.
Long Term (Depth 144): Designed for swing traders focusing on major structural levels.
Interactive History Navigation
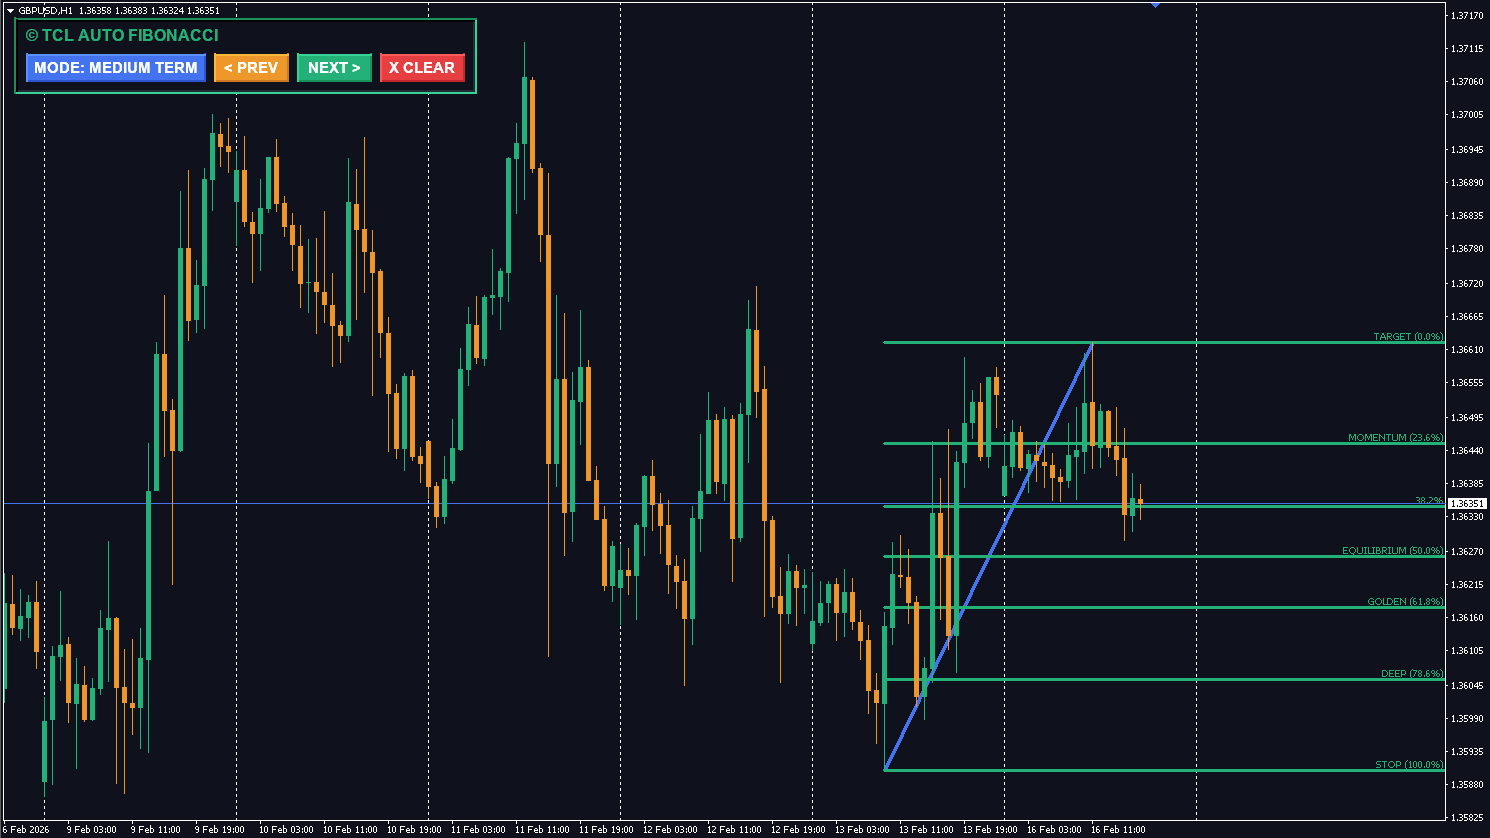
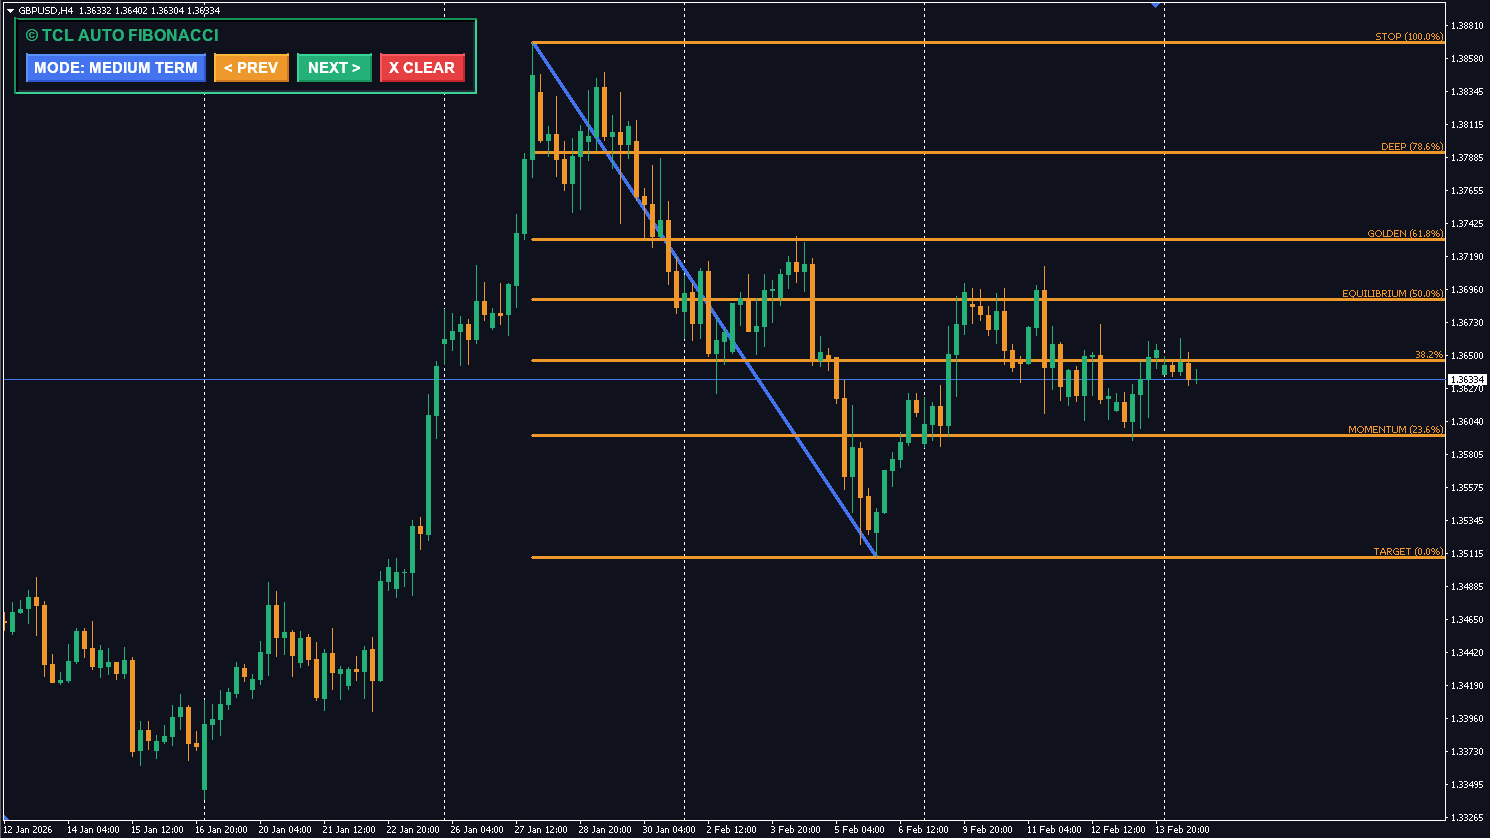
Unlike standard indicators that only show the current Fibonacci leg, TCL Auto Fibonacci allows you to travel in time. Using the “PREV” and “NEXT” buttons on the dashboard, you can scroll through past valid swings. This is an invaluable feature for backtesting, allowing you to visually verify how price respected the “Golden Zone” (61.8%) in previous market cycles.
Smart Filtering
To prevent drawing Fibonacci lines during choppy, flat markets, the indicator includes an optional ADX Filter. When enabled, it will only draw levels if the trend strength (ADX) is above a specific threshold (e.g., 20), ensuring you only trade when there is actual momentum.
Which Mode Should You Use?
Mode
Depth
Best For
Timeframes
Short Term
12
Scalpers — micro-pullbacks and quick entries
M1, M5, M15
Medium Term
36
Day traders — main session move
M15, M30, H1
Long Term
144
Swing traders — major structural levels
H4, D1, W1
Pro Tip: Use Medium Term (Depth 36) on H1 as your default. Then switch to Short Term on M5 for precise entries within the larger Fibonacci zone. This “top-down” approach aligns your entries with the bigger picture.
Key Fibonacci Levels Explained
Level
What It Means
How Traders Use It
23.6%
Shallow retracement
Strongest trends barely pull back — good for momentum entries
38.2%
Moderate retracement
Common bounce zone — first line of defense
50.0%
Half-way pullback
Psychological level, not a true Fibonacci number
61.8%
Golden Zone
Most powerful reversal level — where pros look to enter
78.6%
Deep retracement
Last chance before trend failure
100%
Full retracement
Trend reversal — original move completely erased
161.8%
Extension target
Primary take-profit level for trend continuation
261.8%
Extended target
Aggressive take-profit for strong momentum
Related Indicators
TCL Auto Wedges — Auto-detect wedge patterns alongside Fibonacci levels
The buttons require "DLL Imports" to be enabled in your MT4 settings because they use advanced event handling logic. Go to Tools > Options > Expert Advisors and check "Allow DLL imports".
The indicator uses a ZigZag algorithm. The current (open) leg can adjust as price makes new highs/lows. However, once a swing high/low is confirmed and the ZigZag moves to a new leg, the previous Fibonacci object is fixed and won't change.
Simply click the "X CLEAR" button on the dashboard to remove the Fibonacci drawing from your chart instantly.
The indicator comes with 12 pre-coded popular levels (from -27% to 261.8%) that you can toggle on/off in the settings. You cannot add arbitrary custom levels (e.g., 71%) without modifying the source code.
The Golden Zone refers to the 61.8% Fibonacci retracement level — derived from the golden ratio. It's the most statistically significant reversal level in market geometry. Professional traders focus on this zone because price respects it more often than any other retracement level.
When enabled, the indicator only draws Fibonacci levels if the trend strength (ADX) is above a specific threshold (e.g., 20). This prevents drawing levels during choppy, flat markets where Fibonacci is unreliable.
One-time purchase with lifetime access. No recurring fees, no subscription. All future updates included.
No reviews yet. Be the first to rate this tool!
Write a Review