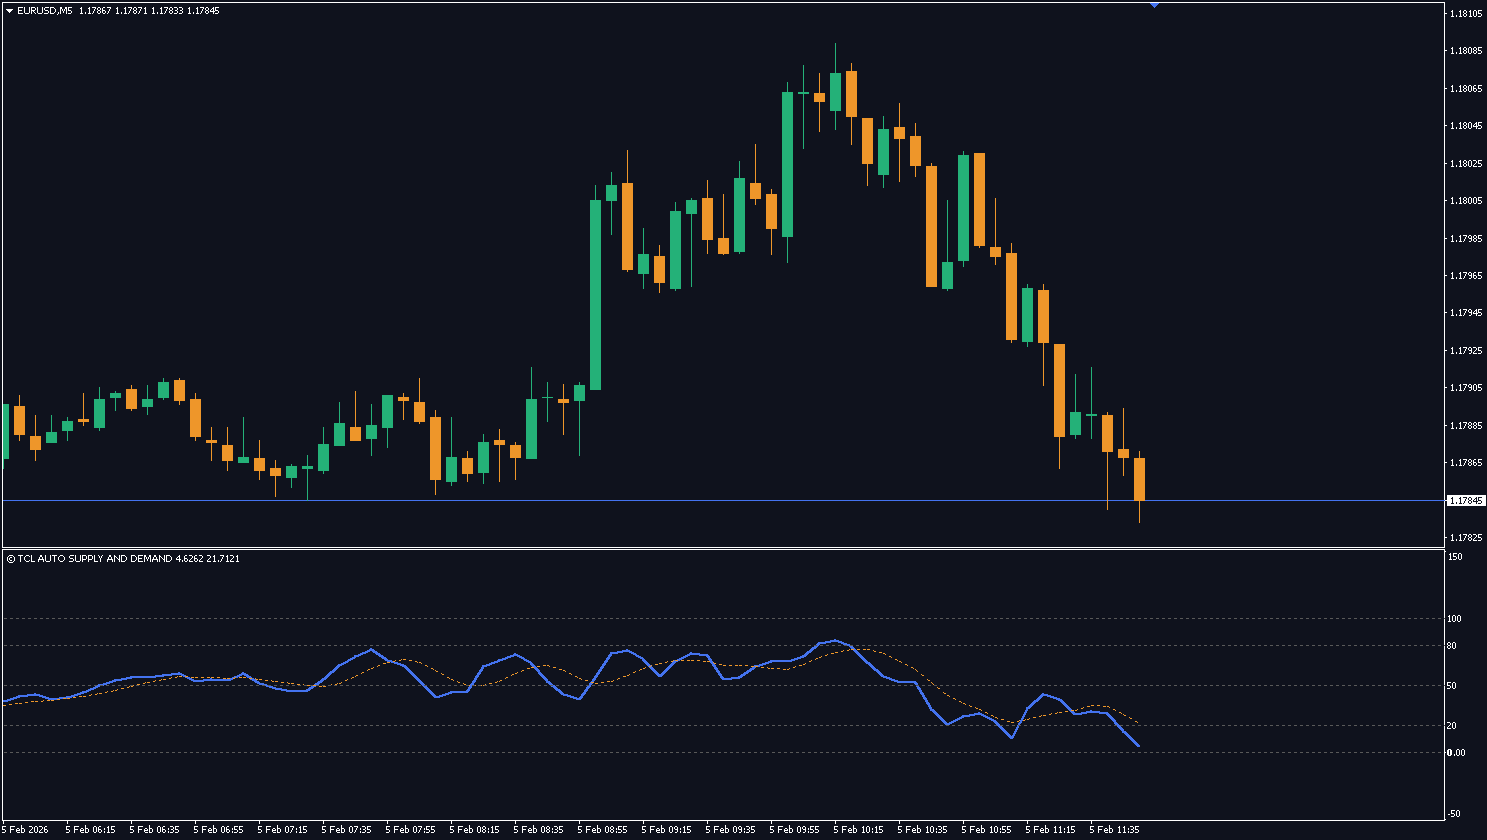
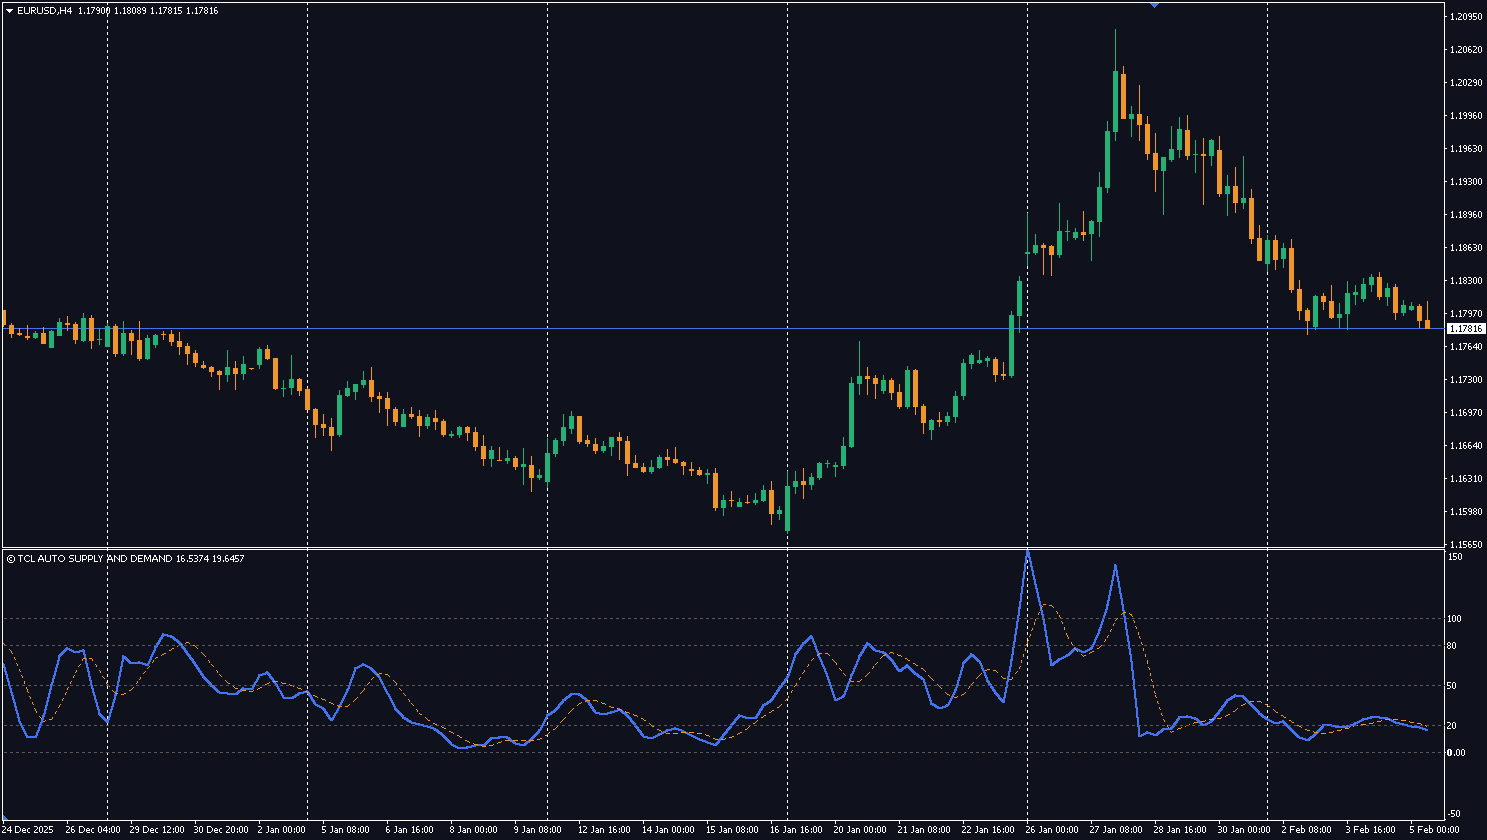
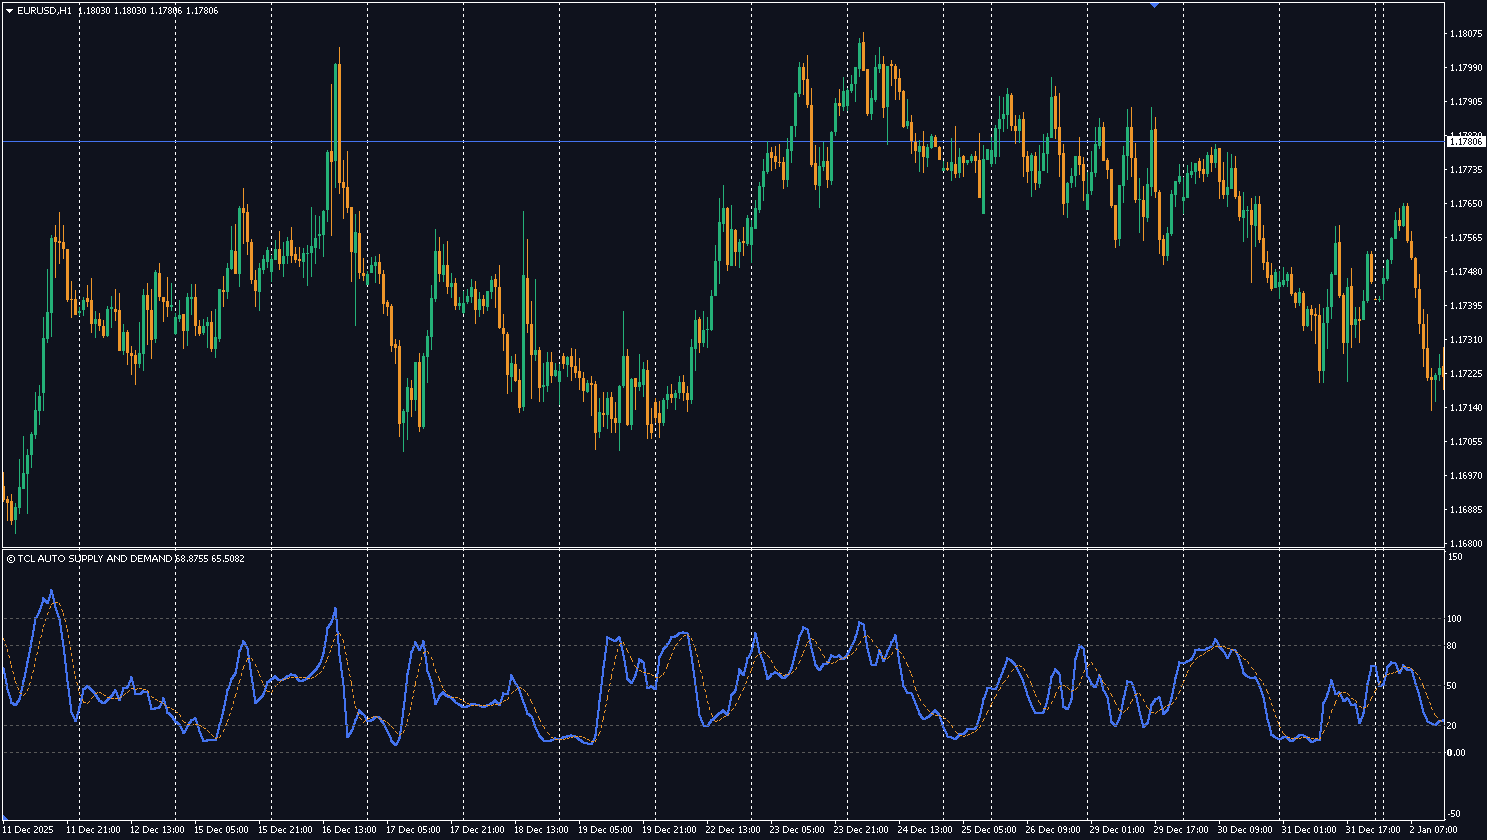
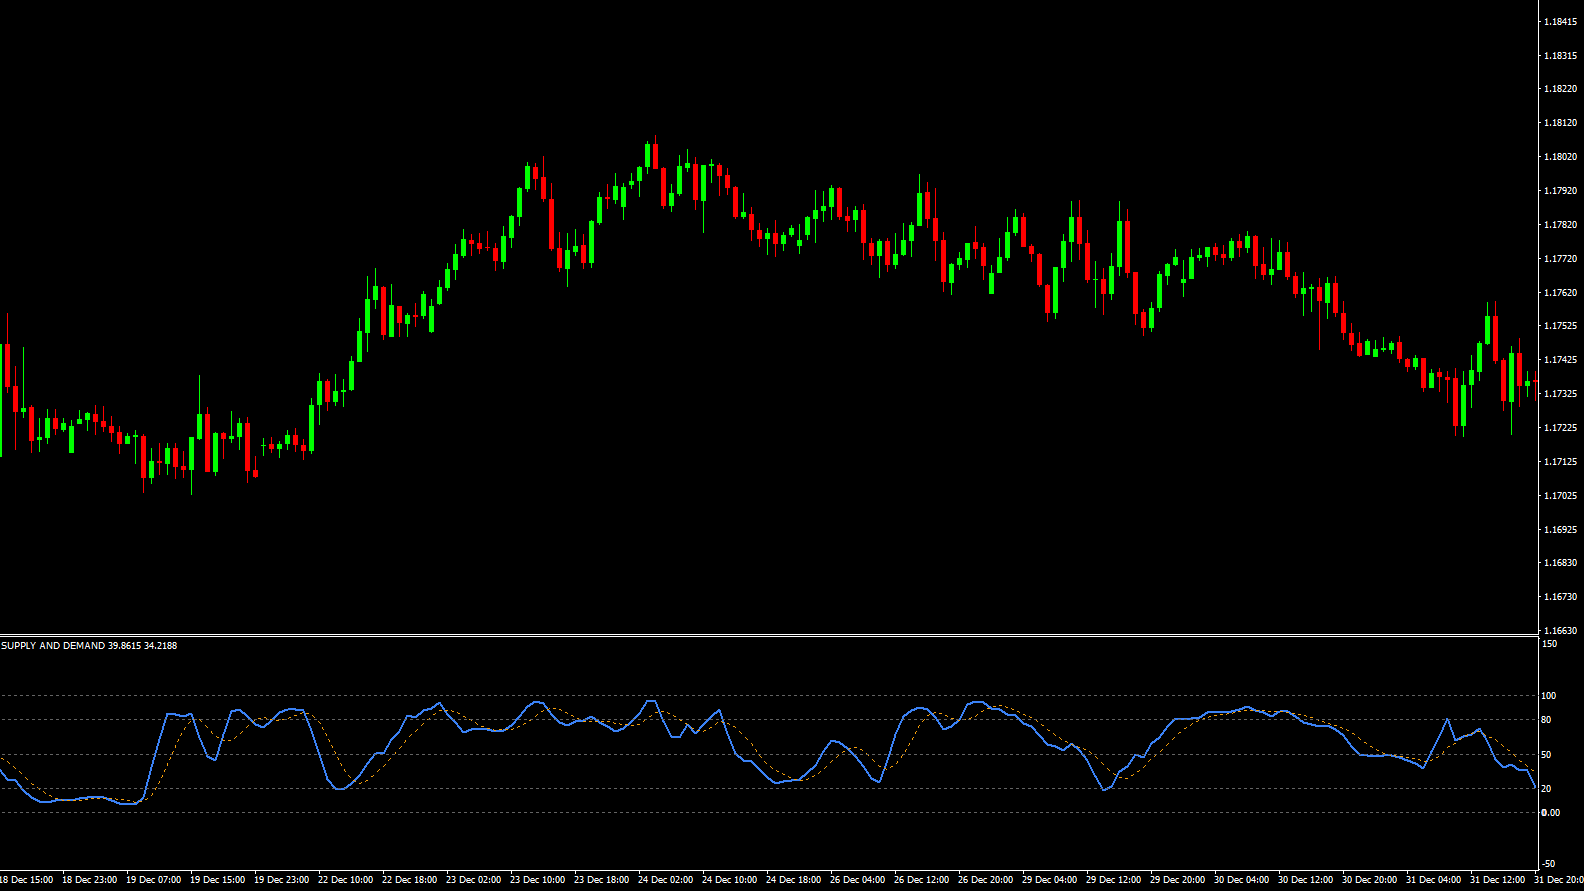
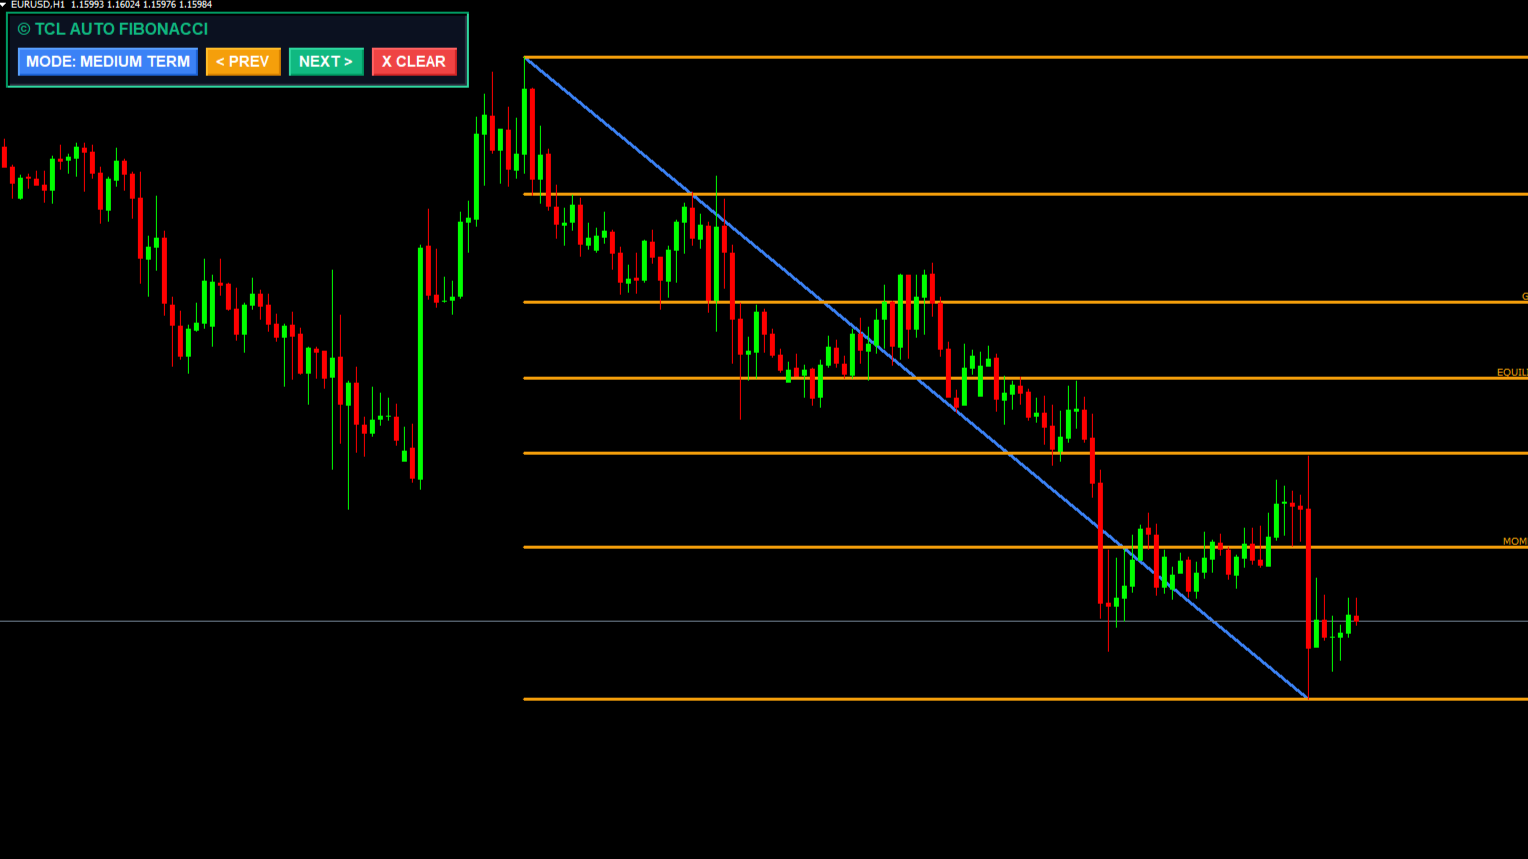
Traditional Supply and Demand (S&D) trading involves manually drawing rectangles on your chart or using indicators that clutter your workspace with boxes. The TCL Auto Supply & Demand indicator takes a smarter approach. It runs an advanced algorithm to find the nearest valid Supply (Resistance) and Demand (Support) levels in the background, but displays the information as a clean, separate-window oscillator.
How It Works
The indicator scans historical price action (up to 300 bars back by default) to find impulsive moves—large candles that signify institutional buying or selling. It uses the Average True Range (ATR) to determine if a move is significant enough to create a zone.
Demand Zone (< 20): When the oscillator drops below 20, price is testing a valid historical Demand zone. This is a potential Buy area.
Supply Zone (> 80): When the oscillator rises above 80, price is testing a valid historical Supply zone. This is a potential Sell area.
Equilibrium (50): Price is comfortably between zones.
Smart “Unbroken” Logic
Crucially, the indicator filters out “broken” zones. If price has already smashed through a previous level, the indicator ignores it and looks for the next valid level further back. This ensures you are always trading against fresh, relevant market structure.
How to Read the Oscillator
Oscillator Value
Zone
What It Means
Trading Action
< 20
Demand (Support)
Price is testing a valid historical demand zone
Potential Buy — institutions bought here before
20–40
Approaching Demand
Price moving toward a support zone
Prepare for buy entry, wait for confirmation
40–60
Equilibrium
Price between zones — no edge
No trade — wait for price to reach a zone
60–80
Approaching Supply
Price moving toward a resistance zone
Prepare for sell entry, wait for confirmation
> 80
Supply (Resistance)
Price is testing a valid historical supply zone
Potential Sell — institutions sold here before
Pro Tip: Don’t trade the oscillator alone. When the value drops below 20 (Demand zone), look for confirmation from a reversal candle pattern (pin bar, engulfing) or combine with the TCL Boll Bands Trader for dual confirmation — S&D zone + Bollinger Band touch = high-probability reversal.
RSI measures momentum speed. This indicator measures price location relative to market structure. A low value doesn't just mean "oversold" — it means price is physically touching a historical support level where institutions previously bought.
The zones are based on historical candles. Once a zone is established, it remains fixed until price breaks through it. The oscillator simply measures the distance to these fixed points — it does not repaint.
This happens when the algorithm cannot find a valid Supply AND Demand zone within the lookback range. Try increasing the "Lookback History" input to 500 or 1000 bars.
Yes. Increase the "Zone Sensitivity (Multiplier)" to 1.5 or 2.0 to only detect major, high-volatility zones and ignore minor ones.
Supply and demand trading identifies price levels where institutional buyers (demand) or sellers (supply) previously entered the market with large orders. When price returns to these zones, it often reverses because the same institutional interest may still exist.
If price has already smashed through a previous supply or demand level, the indicator ignores that broken zone and automatically looks for the next valid level further back in history. This ensures you only trade against fresh, relevant market structure.
Yes — completely free. Create a free account, download the .ex4 file, and install on MT4. No limitations or premium unlock required.
No reviews yet. Be the first to rate this tool!
Write a Review