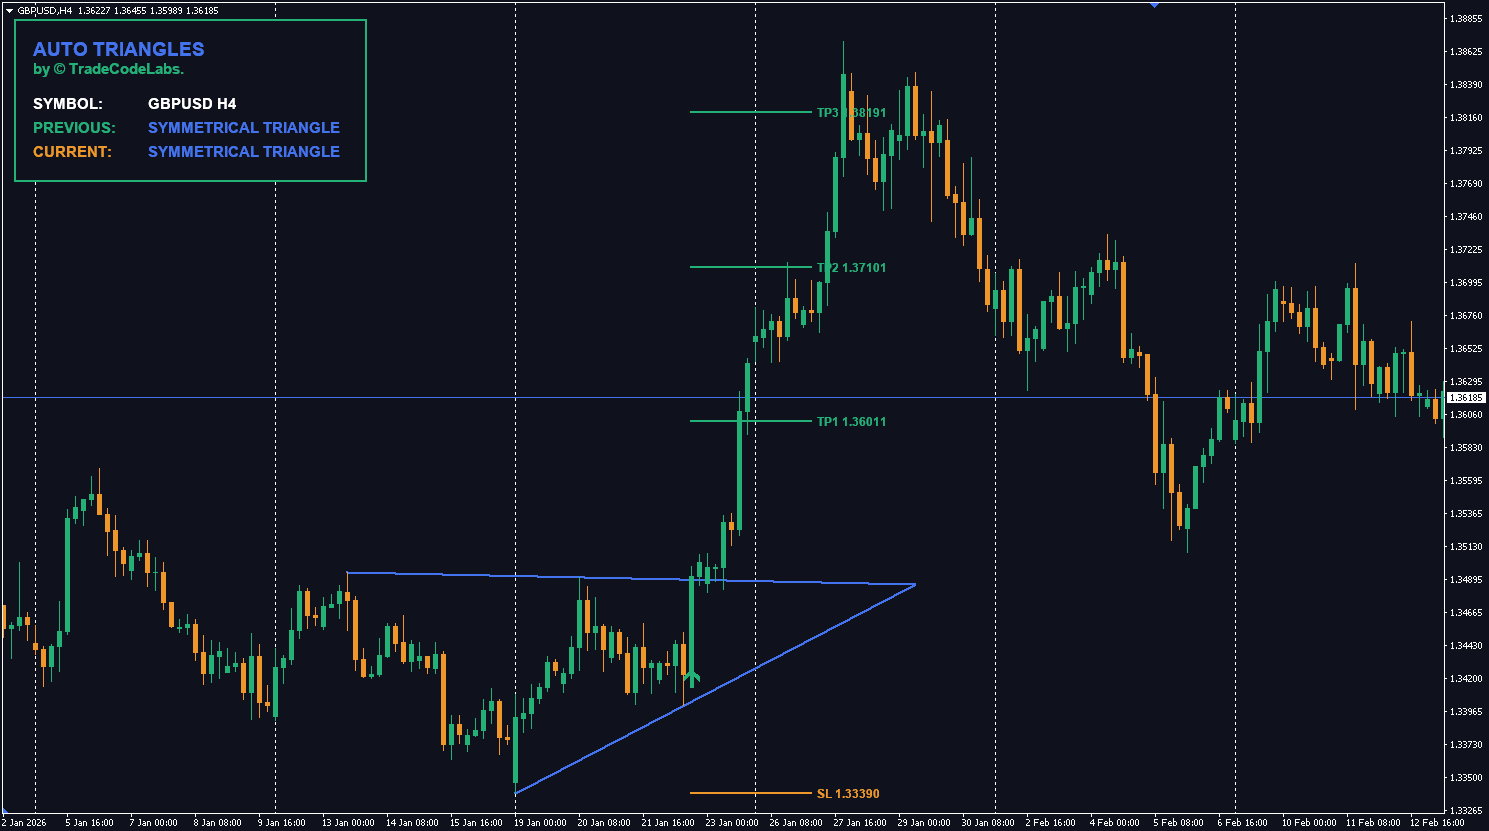
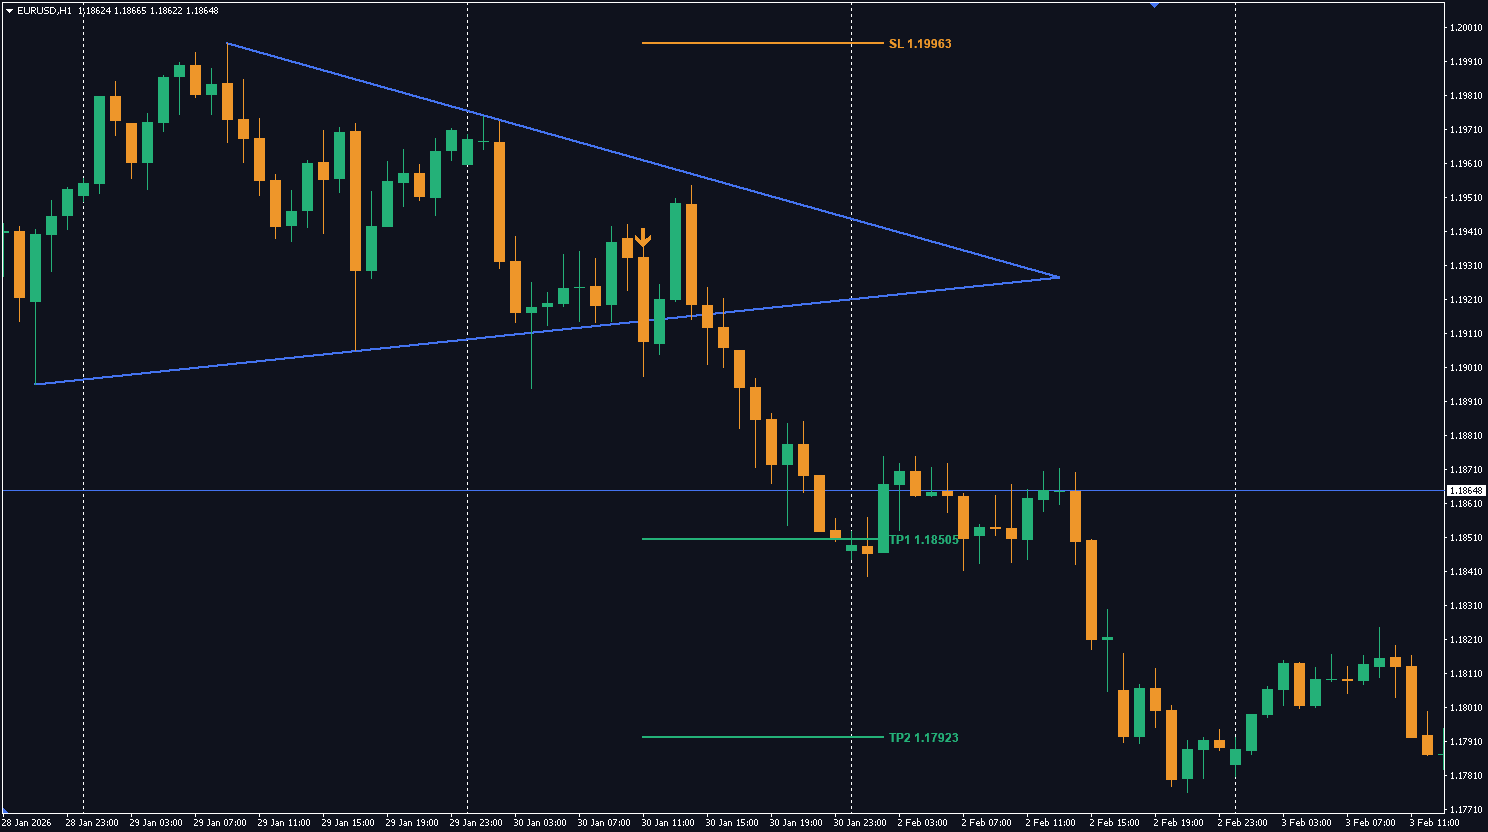
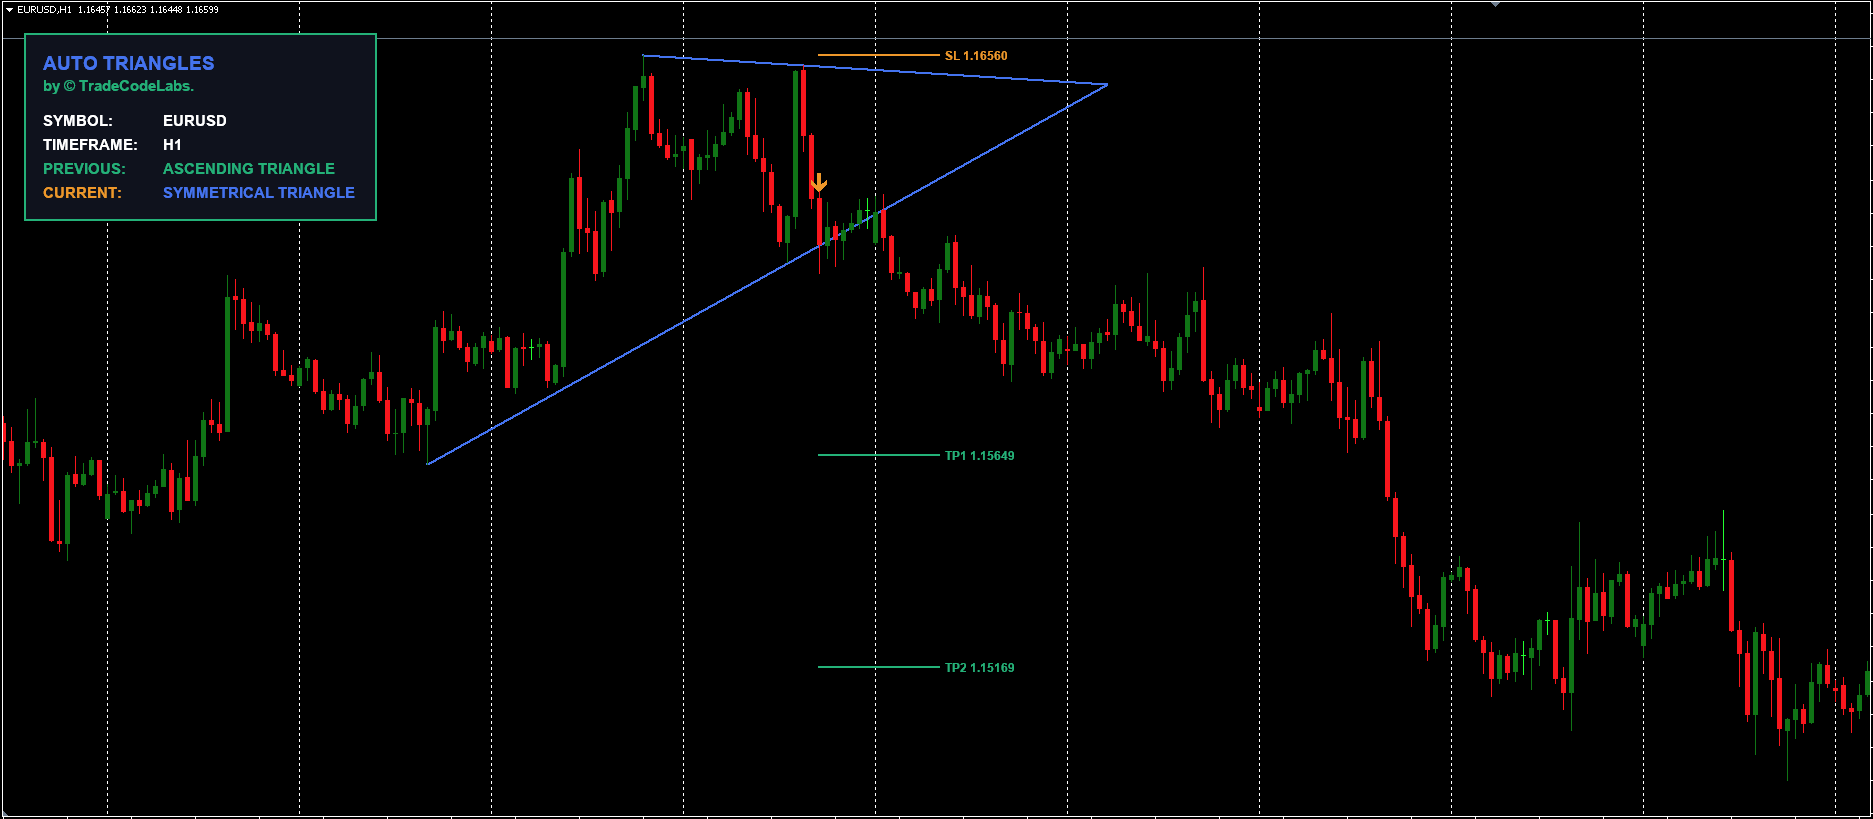
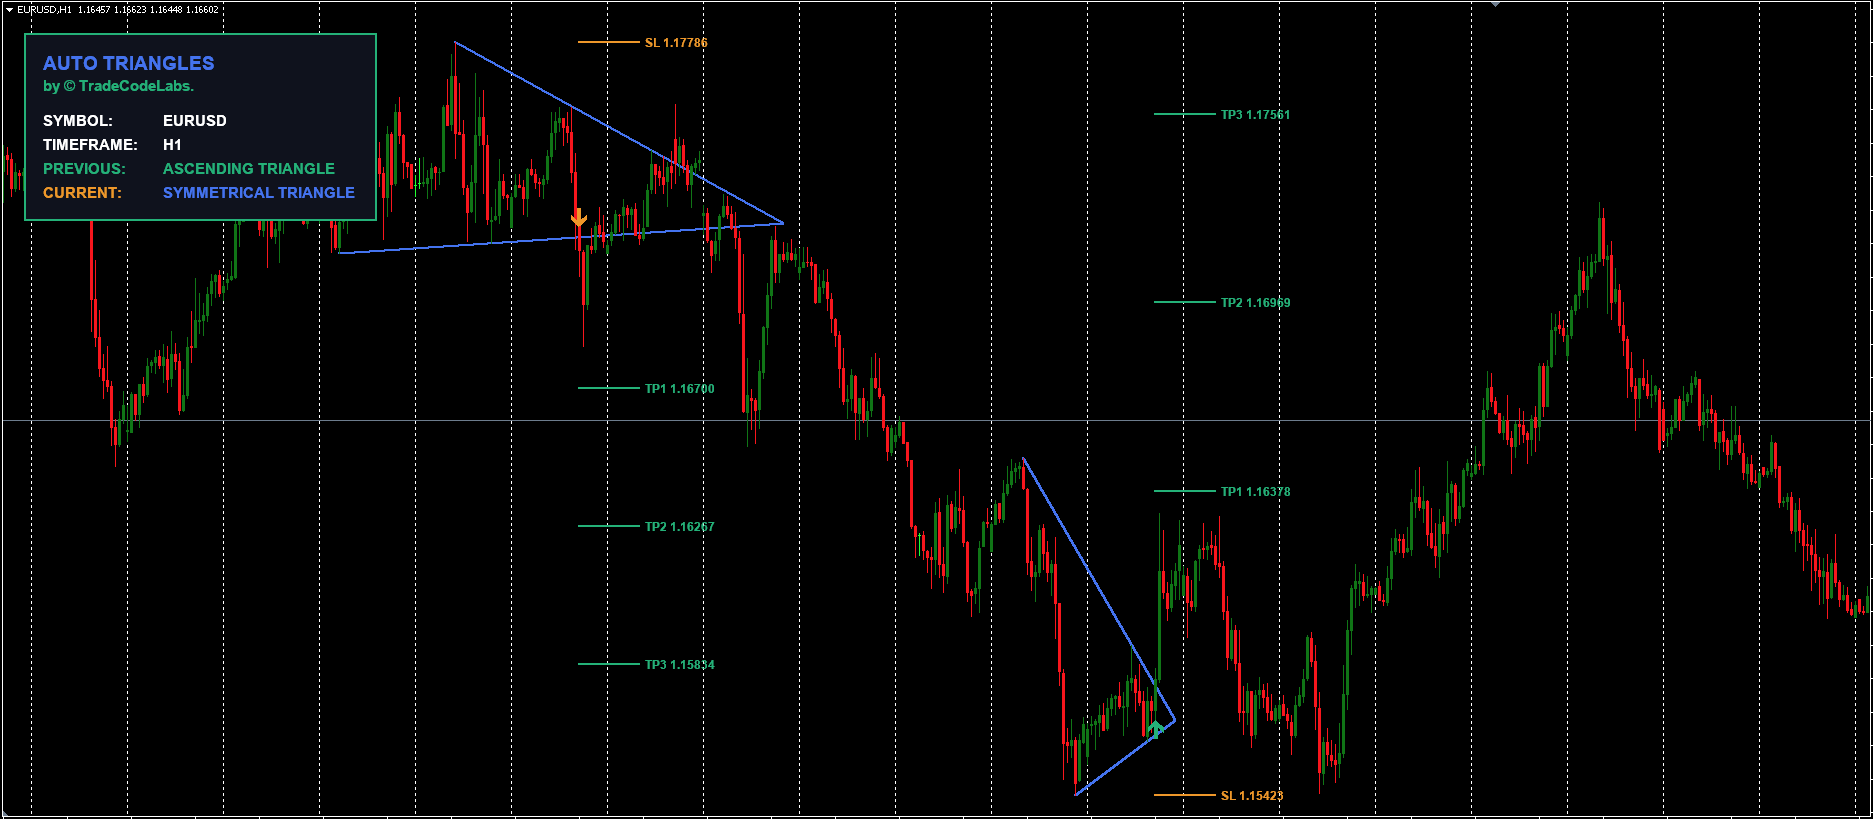
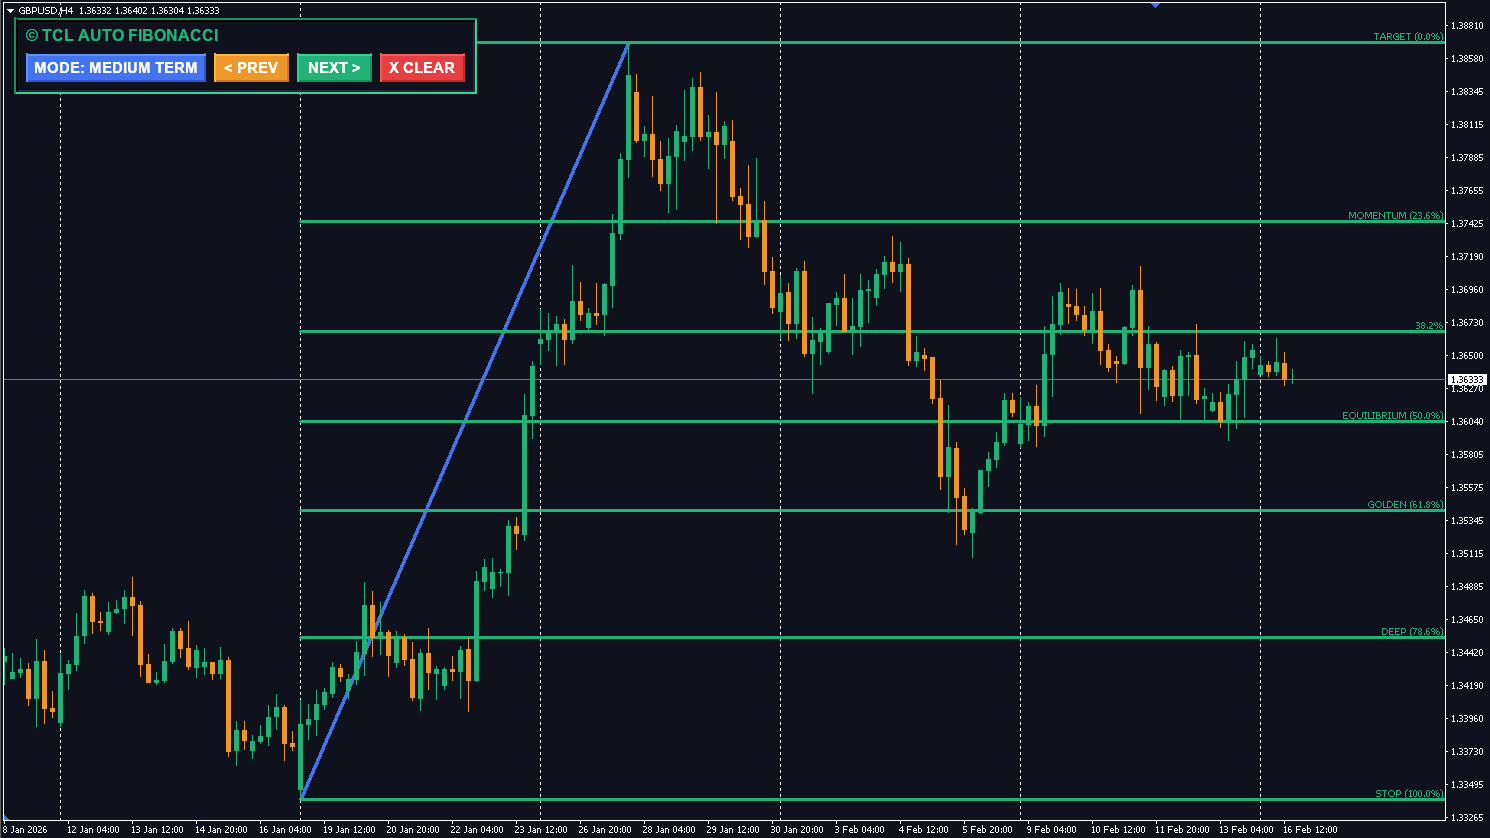
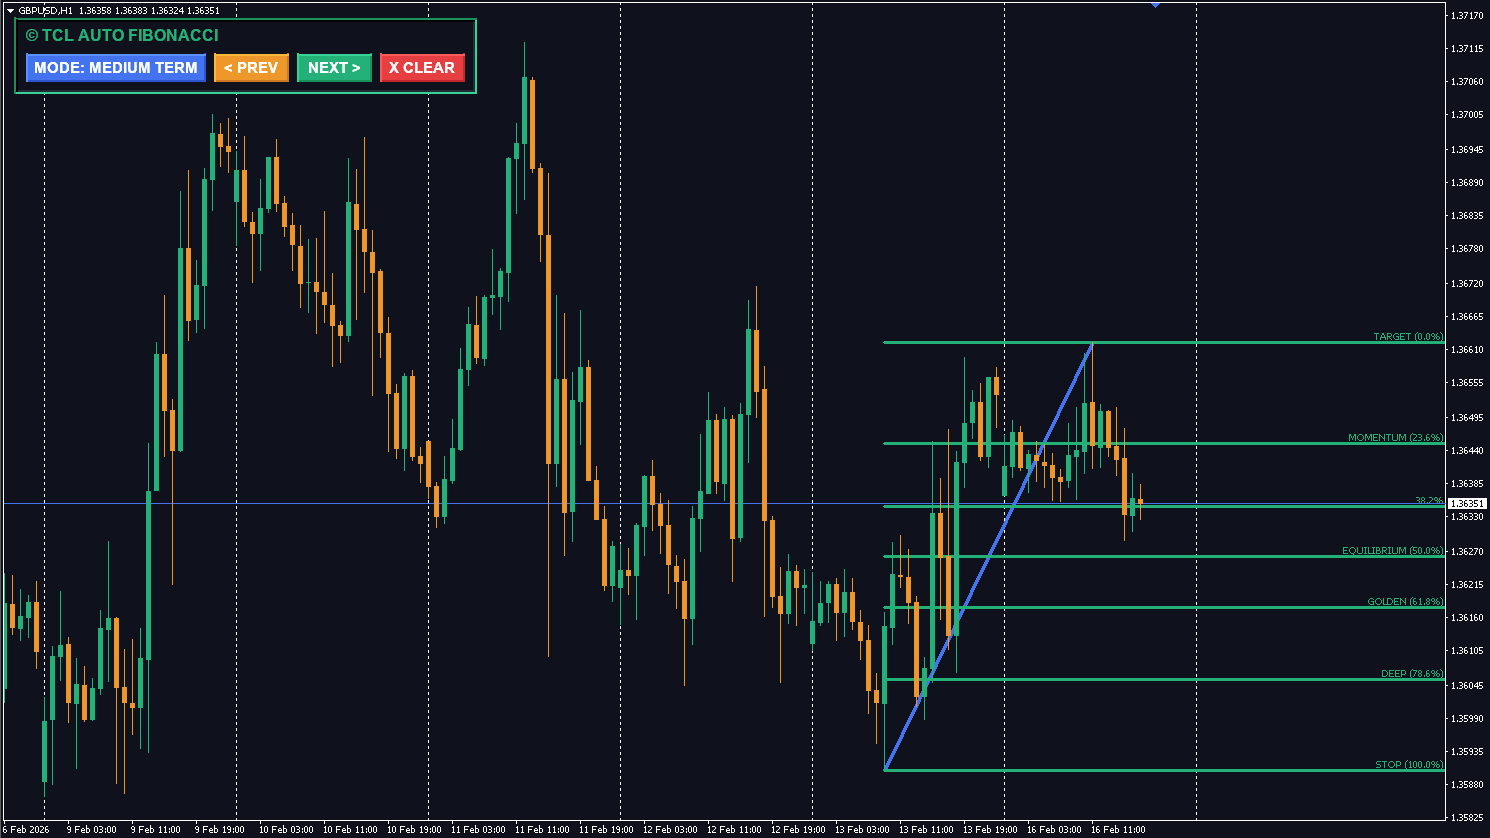
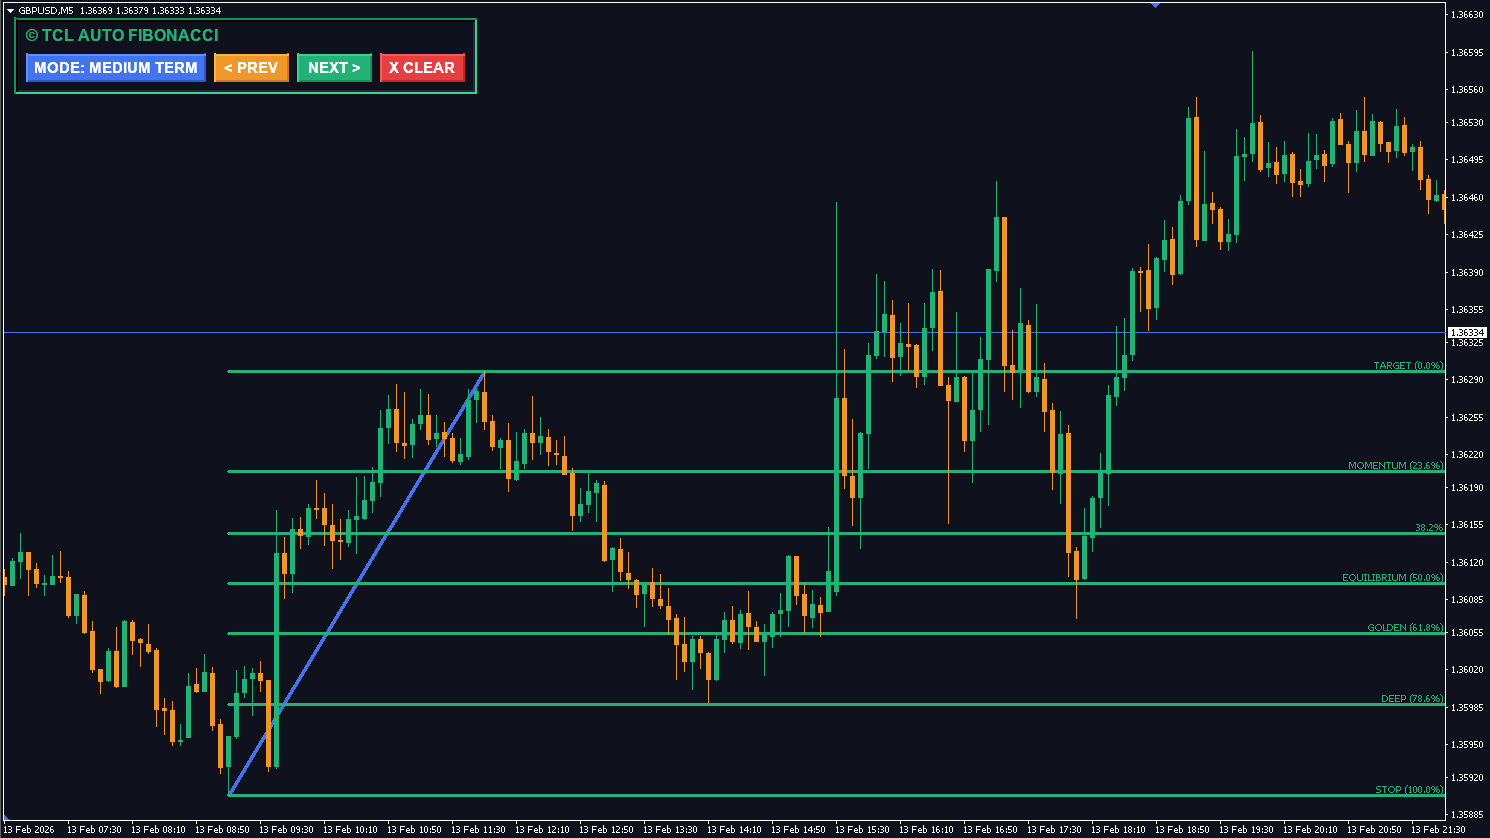
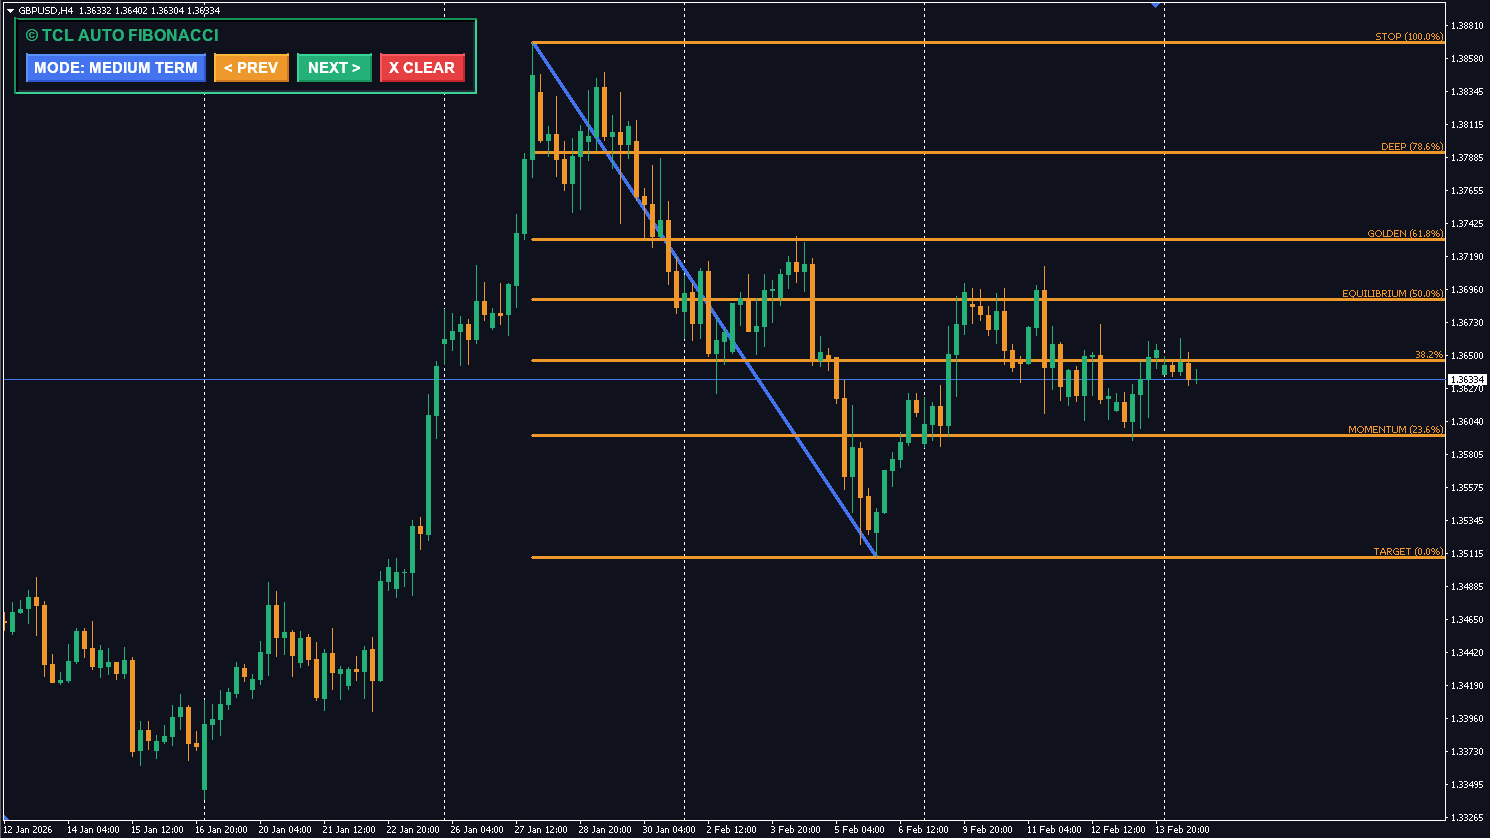
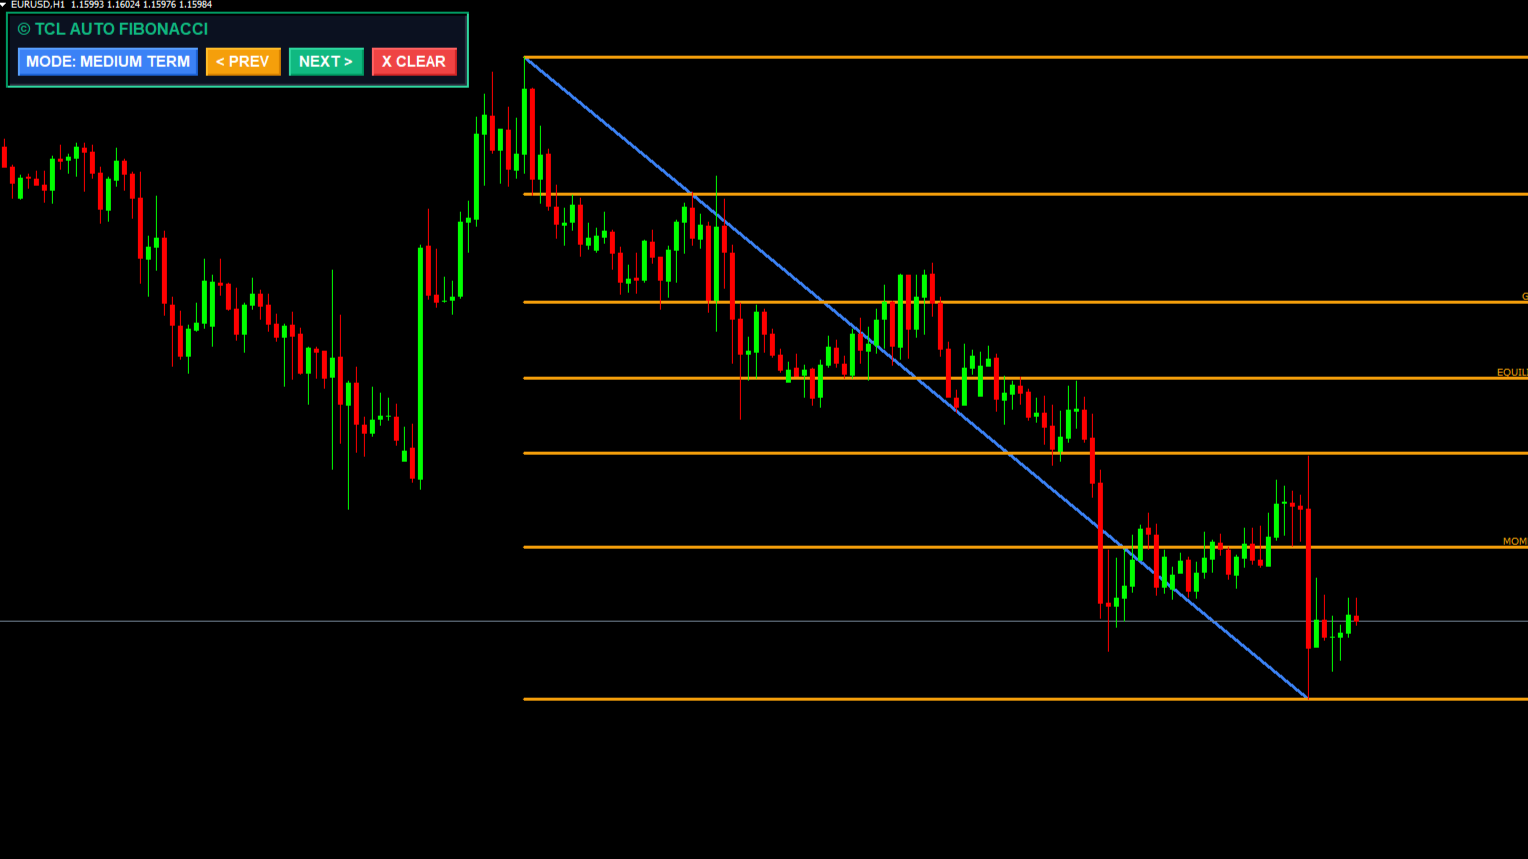
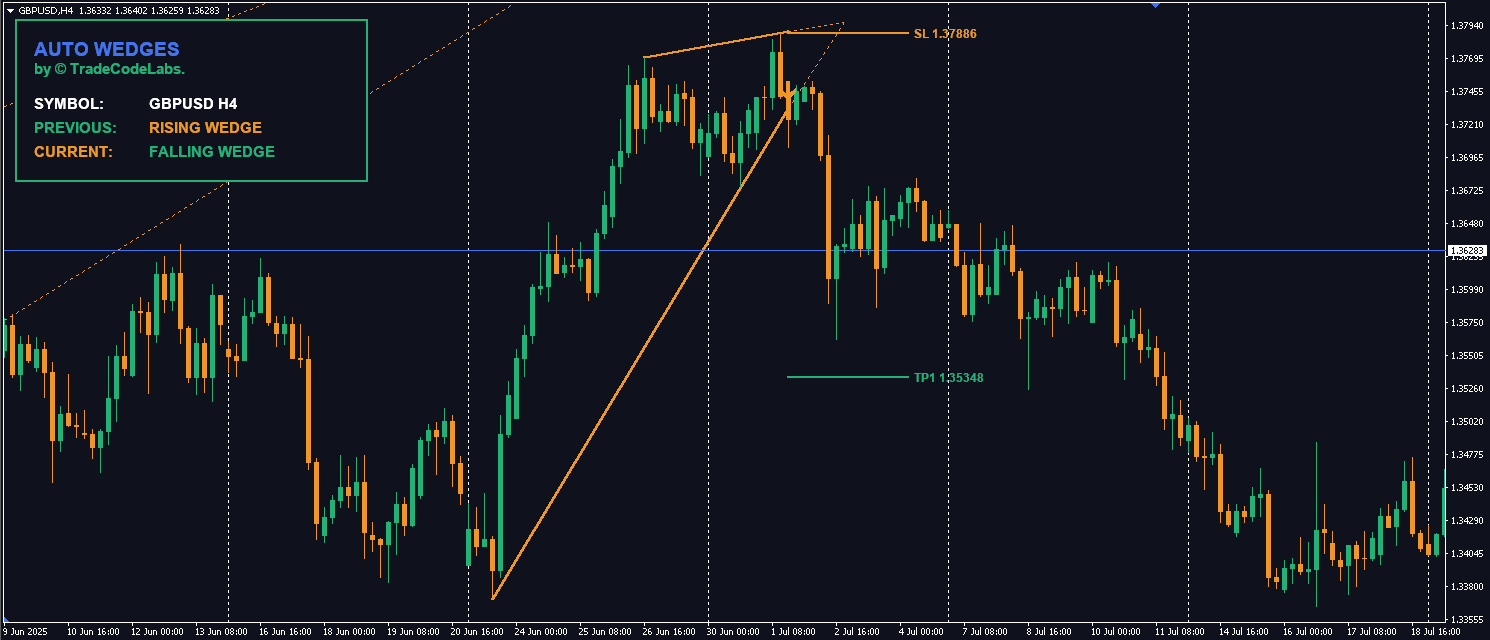
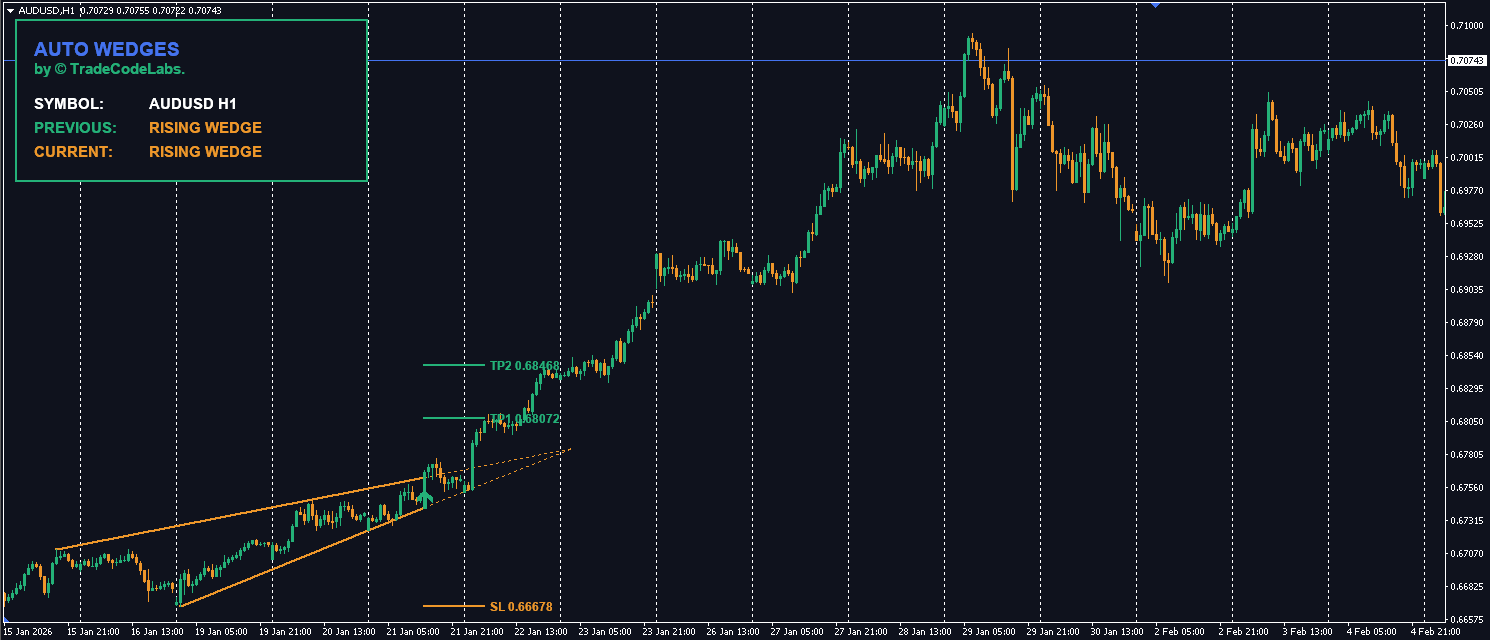
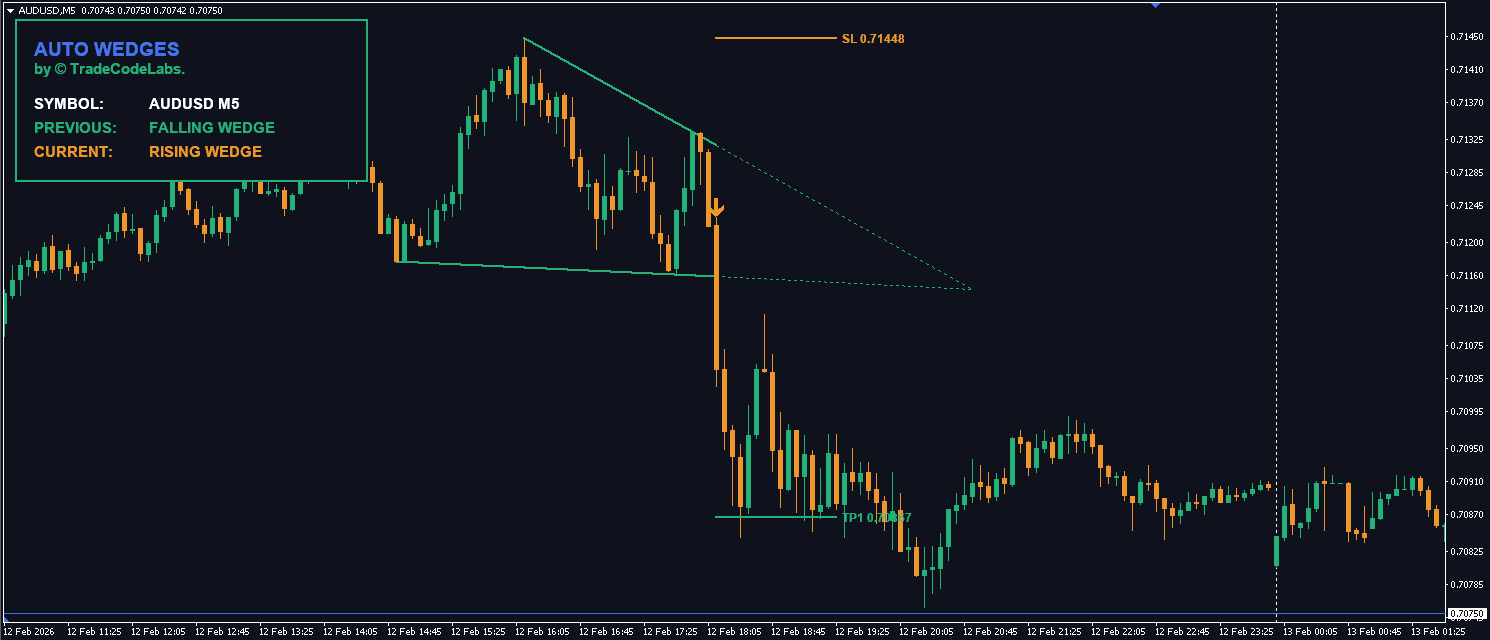
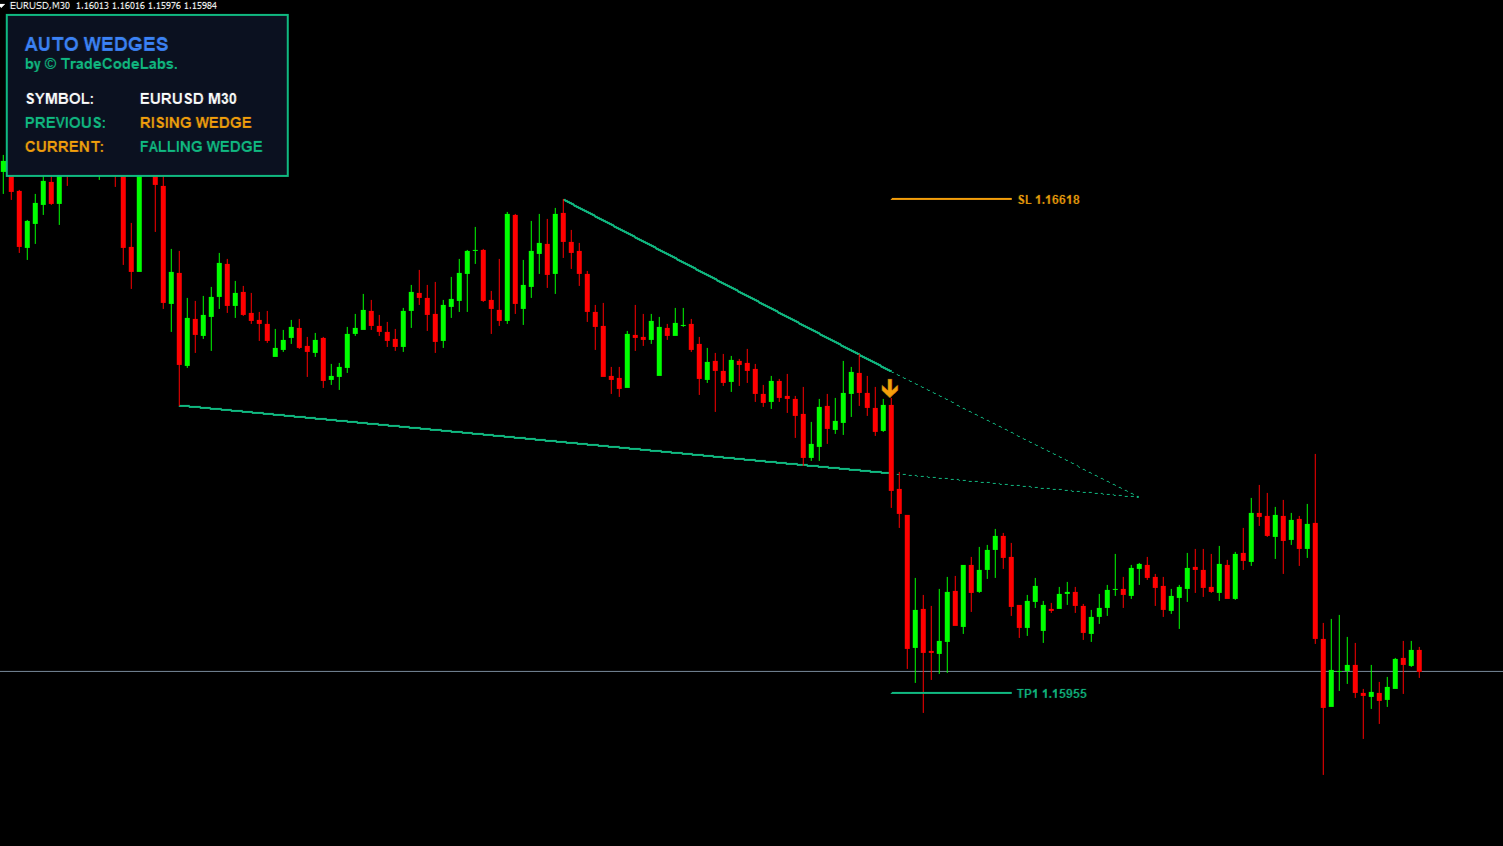
Forget drawing lines manually. This indicator automatically detects Ascending, Descending, and Symmetrical Triangles and plots breakout targets (TP/SL) in real-time.
Secure payment • One-time purchase, no subscriptions
Triangle patterns are among the most reliable setups in technical analysis because they represent a coiling of market energy that must eventually release. However, spotting them in real-time is difficult. The TCL Auto Triangles indicator solves this by scanning price action 24/7 to find valid structures.
The indicator automatically classifies market structure into three distinct types:
Most pattern indicators just draw lines and leave you hanging. TCL Auto Triangles goes a step further. Once a breakout candle closes outside the pattern:
1. It paints a Signal Arrow (Buy or Sell).
2. It calculates and draws 3 Take Profit Levels based on the pattern’s height.
3. It draws a Stop Loss level at the recent swing point to protect your capital.
| Pattern | Structure | Bias | What It Signals |
|---|---|---|---|
| Ascending Triangle | Flat resistance + higher lows | Bullish | Buyers are aggressive — each pullback is shallower. Breakout expected upward |
| Descending Triangle | Flat support + lower highs | Bearish | Sellers are aggressive — each bounce is weaker. Breakdown expected downward |
| Symmetrical Triangle | Converging trendlines (both slopes) | Neutral | Energy is coiling — a massive breakout is imminent in either direction |
| Level | Calculation | Description |
|---|---|---|
| Entry | Breakout candle close | Signal arrow painted when price closes outside the triangle boundary |
| Stop Loss | Recent swing point | Placed at the last swing high/low inside the triangle for capital protection |
| TP1 | 50% of triangle height | Conservative target — first partial profit level |
| TP2 | 100% of triangle height | Standard target — classic measured move |
| TP3 | 150% of triangle height | Extended target — for runners in strong breakouts |
Pro Tip: The Height Projection Method
The indicator uses the classic “measured move” technique:
| Timeframe | Reliability | Volume of Signals | Recommendation |
|---|---|---|---|
| M1–M5 | Low — high noise | Many (mostly false) | Not recommended — too many fakeouts |
| M15–M30 | Moderate | Moderate | Acceptable for intraday scalping with confirmation |
| H1 | High | Good balance | Recommended for day trading |
| H4 | Very High | Fewer but reliable | Best for swing trading triangle setups |
| D1 | Highest | Rare but very powerful | Best reliability — institutional-grade patterns |
| Feature | Manual Drawing | Basic Pattern Indicator | TCL Auto Triangles |
|---|---|---|---|
| Detection | Subjective — experience required | Often inaccurate or delayed | ZigZag-based automated detection |
| Pattern types | Depends on trader skill | Usually 1–2 types | All 3: Ascending, Descending, Symmetrical |
| Take Profit levels | Manual calculation | None | Auto-calculated 3 TP levels (50%/100%/150%) |
| Stop Loss | Manual placement | None | Auto-placed at recent swing point |
| Signal arrows | None — visual only | Sometimes | Yes — on breakout candle close |
| Repainting | N/A | Often | No — breakout signals are permanent |
Vote for the next update.
Everything you need to know about the product.
The trendlines are drawn based on confirmed ZigZag points. While a developing triangle can change as price evolves, once a breakout arrow is plotted (Signal), it remains fixed and does not repaint.
The indicator measures the "height" of the triangle (the widest part at the start). TP1 is 50% of this height projected from the breakout. TP2 is 100%, and TP3 is 150%.
Triangles are specific formations. If the market is trending strongly or chopping without convergence, no valid triangle exists. Try adjusting the ZigZag Depth to find smaller or larger patterns.
Yes, but lower timeframes have more noise. Triangle patterns are statistically more reliable on H1, H4, and Daily charts.
A triangle is a consolidation pattern where price compresses between converging trendlines. It represents a build-up of energy (buyers vs sellers) that must eventually break out. There are three types: Ascending (bullish bias), Descending (bearish bias), and Symmetrical (neutral — explosive breakout either way).
It's the standard technique for calculating breakout targets. You measure the widest part of the triangle (the height), then project that distance from the breakout point. This indicator automates that with TP1 (50%), TP2 (100%), and TP3 (150%) levels.
Yes. Triangle patterns are universal price formations that work on any instrument — Forex, Gold, Indices, Commodities, and Crypto.
Reference for Expert Advisor development.
No reviews yet. Be the first to rate this tool!
Write a Review