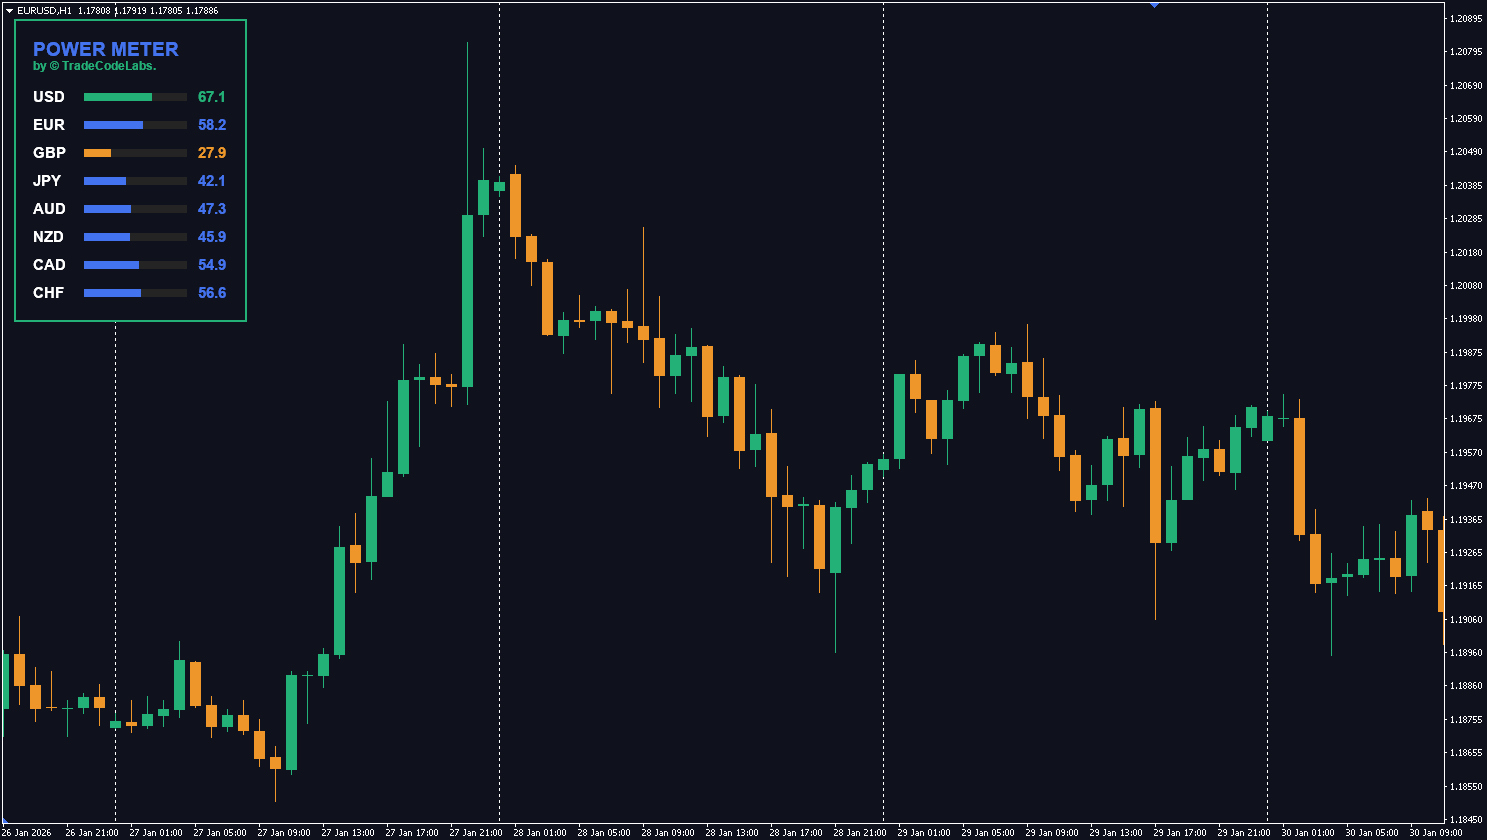
In Forex, trading a single pair like EURUSD in isolation can be misleading. Is the Euro strong, or is the Dollar just weak? The TCL Power Meter solves this dilemma by measuring the intrinsic strength of all 8 major currencies (USD, EUR, GBP, JPY, AUD, NZD, CAD, CHF) simultaneously.
How It Works: Aggregated RSI Logic
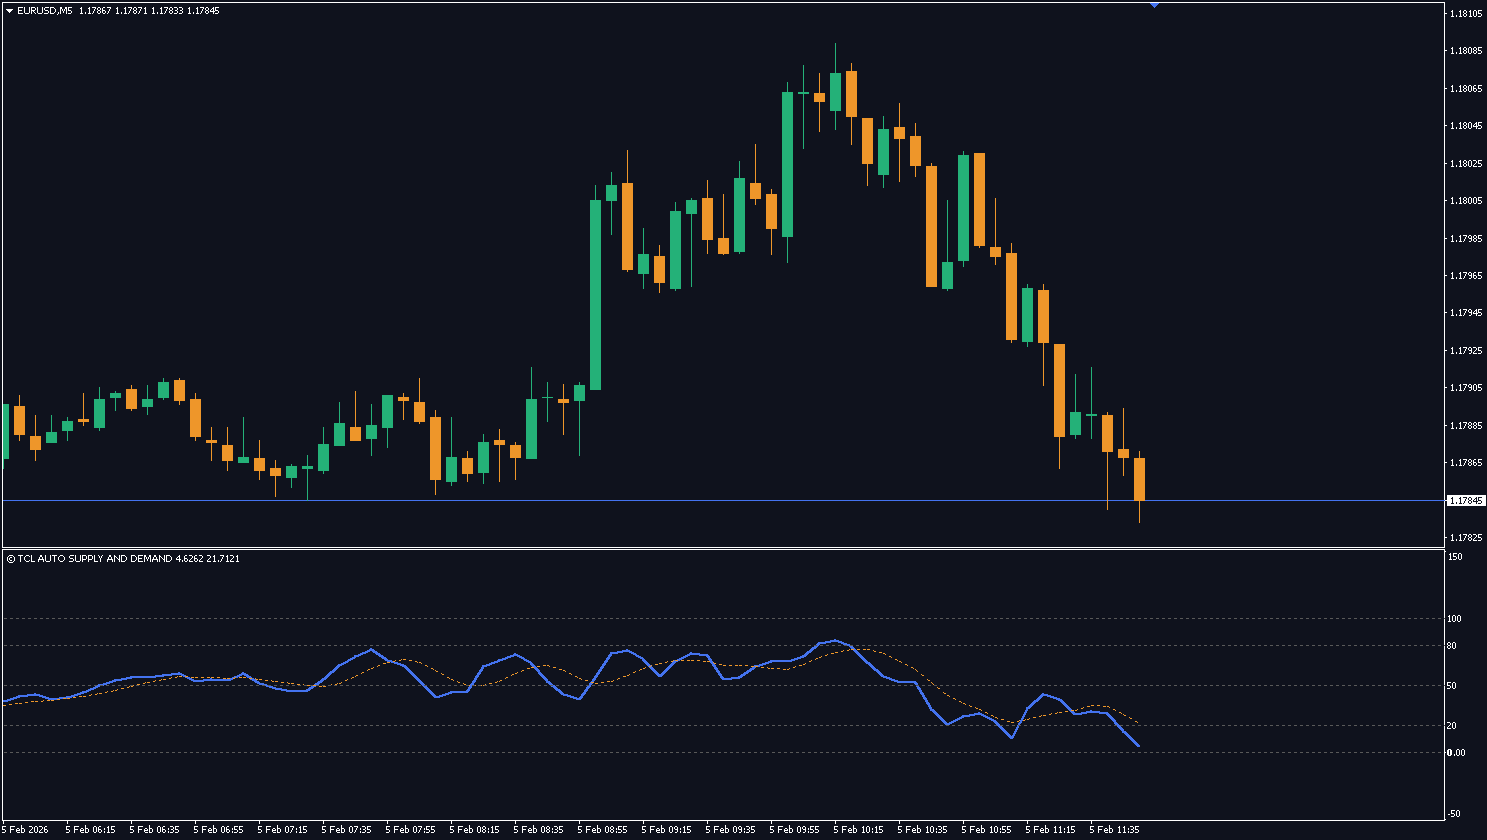
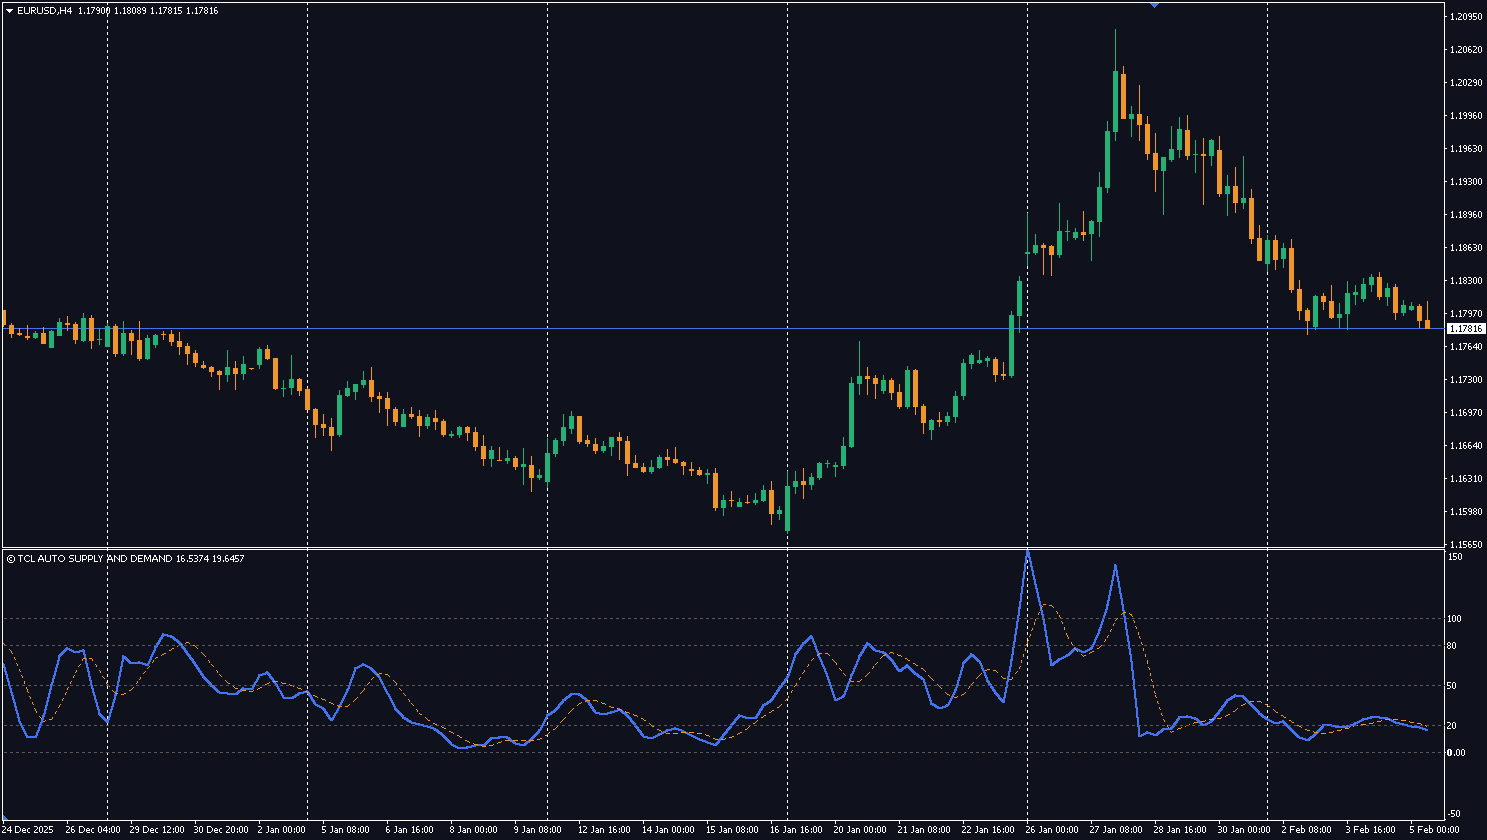
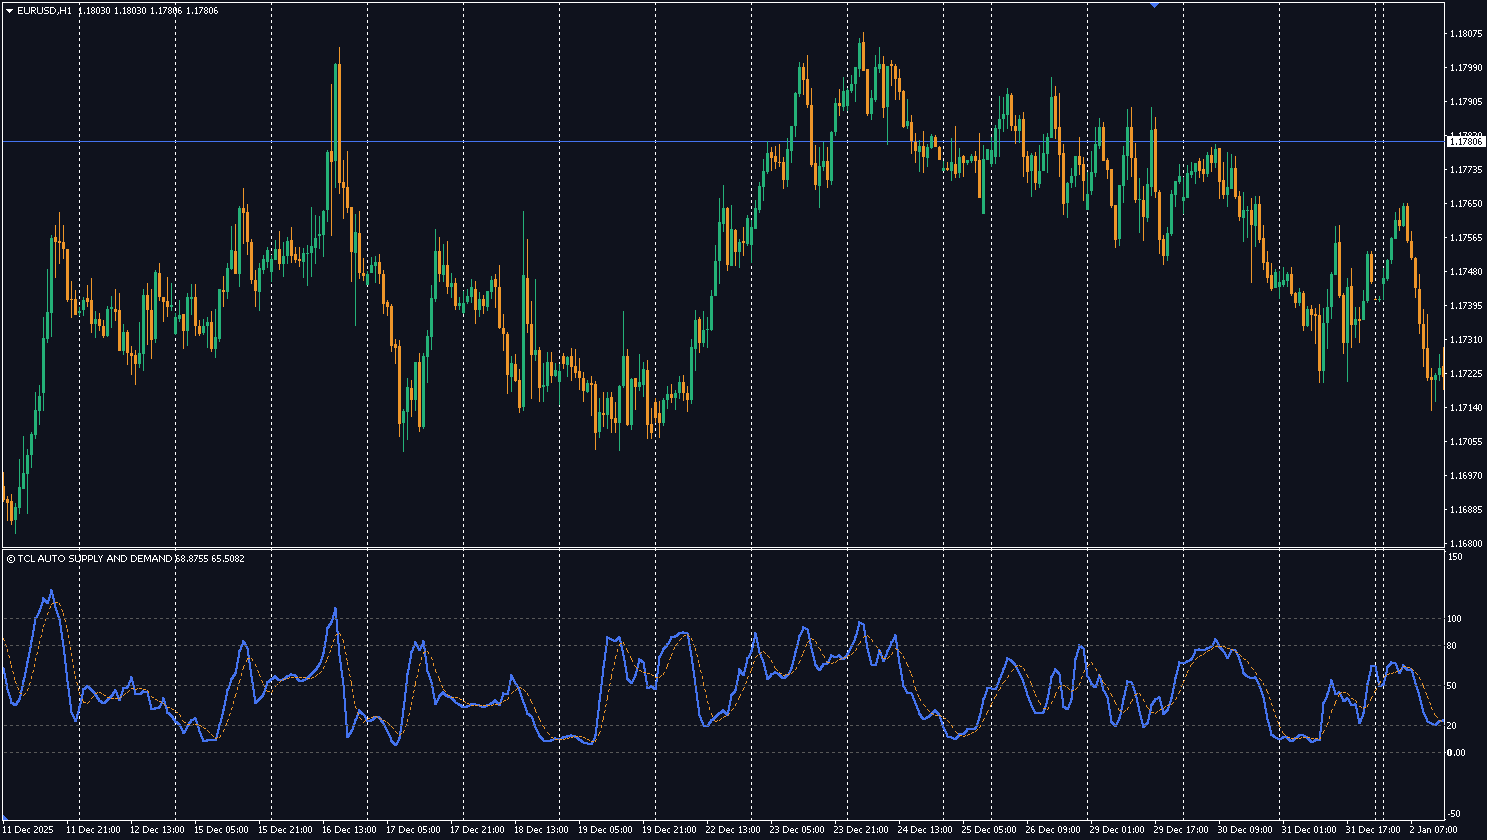
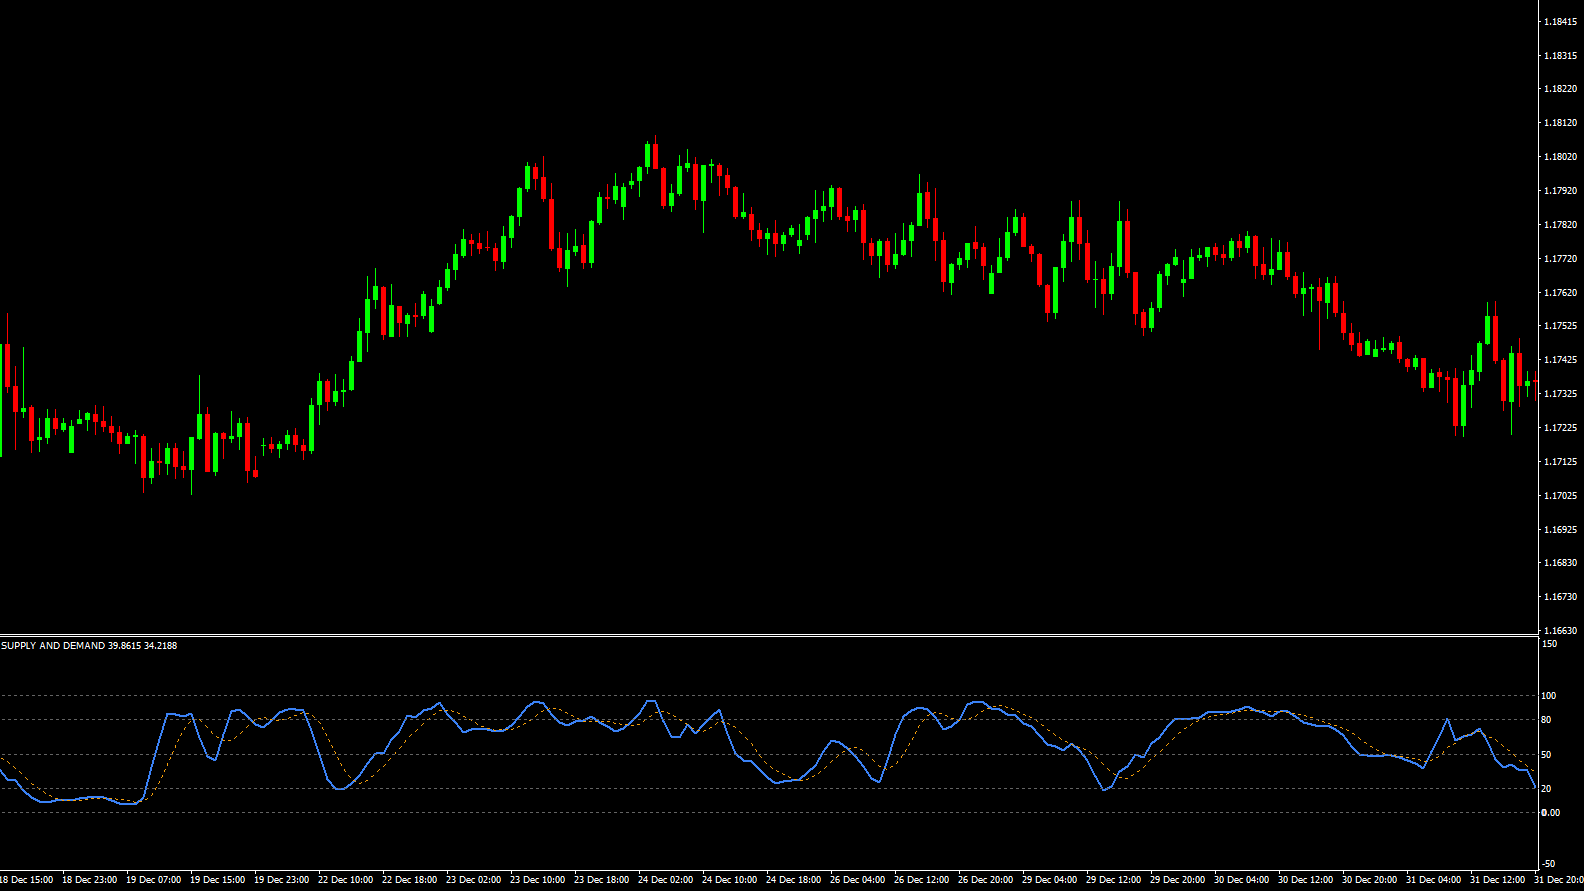
Unlike simple correlation tools, the Power Meter uses a robust relative strength algorithm. For every currency (e.g., USD), it scans all 7 corresponding cross-pairs (EURUSD, GBPUSD, USDJPY, etc.). It calculates the Relative Strength Index (RSI) for each cross and averages the results.
Score > 60 (Green): The currency is displaying significant strength across the board.
Score < 40 (Orange): The currency is weak and under selling pressure.
Score 40-60 (Blue): The currency is neutral or ranging.
How to Find High-Probability Trades
The most powerful Forex moves happen when you pair a Very Strong currency against a Very Weak one.
Example Strategy:
1. You check the Dashboard and see GBP is Strong (85).
2. You see JPY is Weak (20).
3. This indicates a high-probability Buy setup on GBPJPY, as the Pound is pushing up while the Yen is dragging down.
Why It Is Better Than Standard Charts
Standard charts only show you the relationship between two currencies. The TCL Power Meter gives you the context of the entire market. It helps you avoid “Neutral vs. Neutral” trades (which result in choppy, sideways price action) and focus purely on pairs with the highest momentum divergence.
How to Read the Power Meter Scores
Score
Color
Meaning
Trading Action
80–100
🟢 Green
Extremely strong — dominant buying pressure across all crosses
Buy this currency — pair it against the weakest one
60–80
🟢 Green
Strong — bullish momentum building
Favor longs on pairs containing this currency
40–60
🔵 Blue
Neutral — no clear directional pressure
Avoid trading this currency — sideways/choppy conditions
20–40
🟠 Orange
Weak — bearish pressure across crosses
Favor shorts on pairs containing this currency
0–20
🟠 Orange
Extremely weak — dominant selling pressure
Sell this currency — pair it against the strongest one
Pro Tip: The “Strong vs Weak” Strategy
The highest-probability Forex trades happen when you pair the strongest currency against the weakest. Here’s the process:
Check the Power Meter dashboard
Find the currency with the highest score (e.g., GBP = 85)
Find the currency with the lowest score (e.g., JPY = 18)
Trade that pair in the direction of strength → Buy GBPJPY
Avoid “Neutral vs Neutral” pairs (scores 40–60) — they produce choppy, directionless price action
No. This algorithm is specifically designed for the 8 major Forex currencies (USD, EUR, GBP, JPY, AUD, NZD, CAD, CHF). It scans all 28 cross-pairs between them.
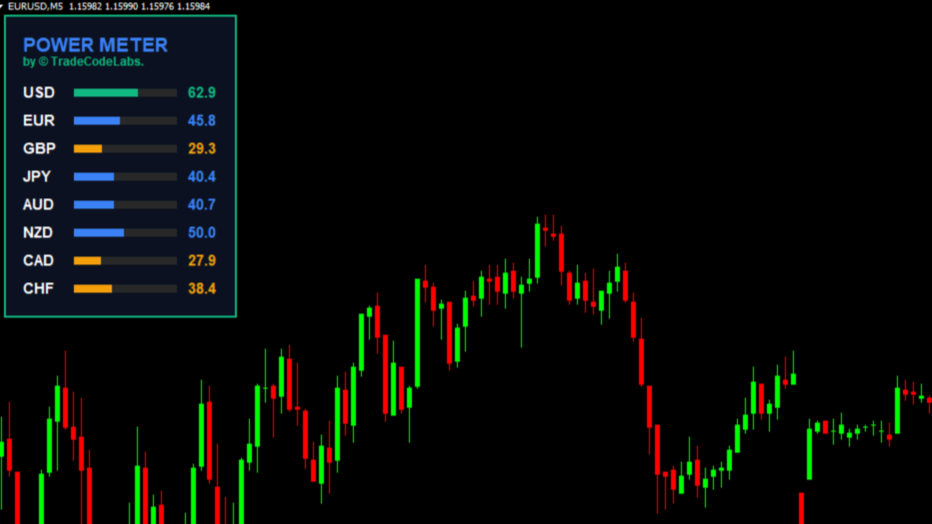
The meter calculates strength based on the timeframe of the chart you attach it to. For scalping, use M5 or M15. For swing trading, use H4 or D1.
No. This is a real-time monitoring dashboard designed to be kept open for quick reference. Use it to identify which currency pairs to trade, then apply an entry indicator like TCL MA Crossovers or TCL S&Q Super Bands.
The value is an average of RSI across 7 different pairs for each currency, not just one. This smooths out pair-specific noise and gives a truer picture of overall currency strength.
A currency strength meter measures how strong or weak each individual currency is across multiple pairs simultaneously. Instead of analyzing one pair (e.g., EURUSD), it tells you whether the Euro itself is strong or weak across ALL its crosses — giving you the full market context.
Pair the strongest currency (highest score) against the weakest currency (lowest score). For example, if GBP = 85 and JPY = 18, buy GBPJPY. Avoid neutral-vs-neutral setups (both scores 40–60) as they produce choppy price action.
Yes — completely free. Create a free account, download the .ex4 file, and install on MT4. No limitations or premium unlock required.
No reviews yet. Be the first to rate this tool!
Write a Review