An advanced oscillator that automatically calibrates its calculation period to your specific timeframe, ensuring optimal sensitivity for scalping, day trading, and swing trading.
The Relative Strength Index (RSI) is arguably the most popular trading indicator in history. However, 90% of traders use it incorrectly because they rely on the default “14-period” setting for every single chart.
Here is the technical reality: A 14-period RSI is designed for the Daily chart. When you apply that same math to a 1-Minute scalping chart, the lag is mathematically too high to catch rapid liquidity sweeps. Conversely, on a Weekly chart, a 14-period RSI is often too “noisy,” generating false reversal signals during strong trends. Traders often try to fix this by manually tweaking settings, which introduces human error and analysis paralysis.
The Solution: “Context-Aware” Engineering
TCL Super RSI eliminates this variable. It treats every timeframe as a unique market environment. When you switch charts, the indicator’s internal logic engine detects the new context and seamlessly shifts its calculation formula to match the volatility profile of that specific timeframe.
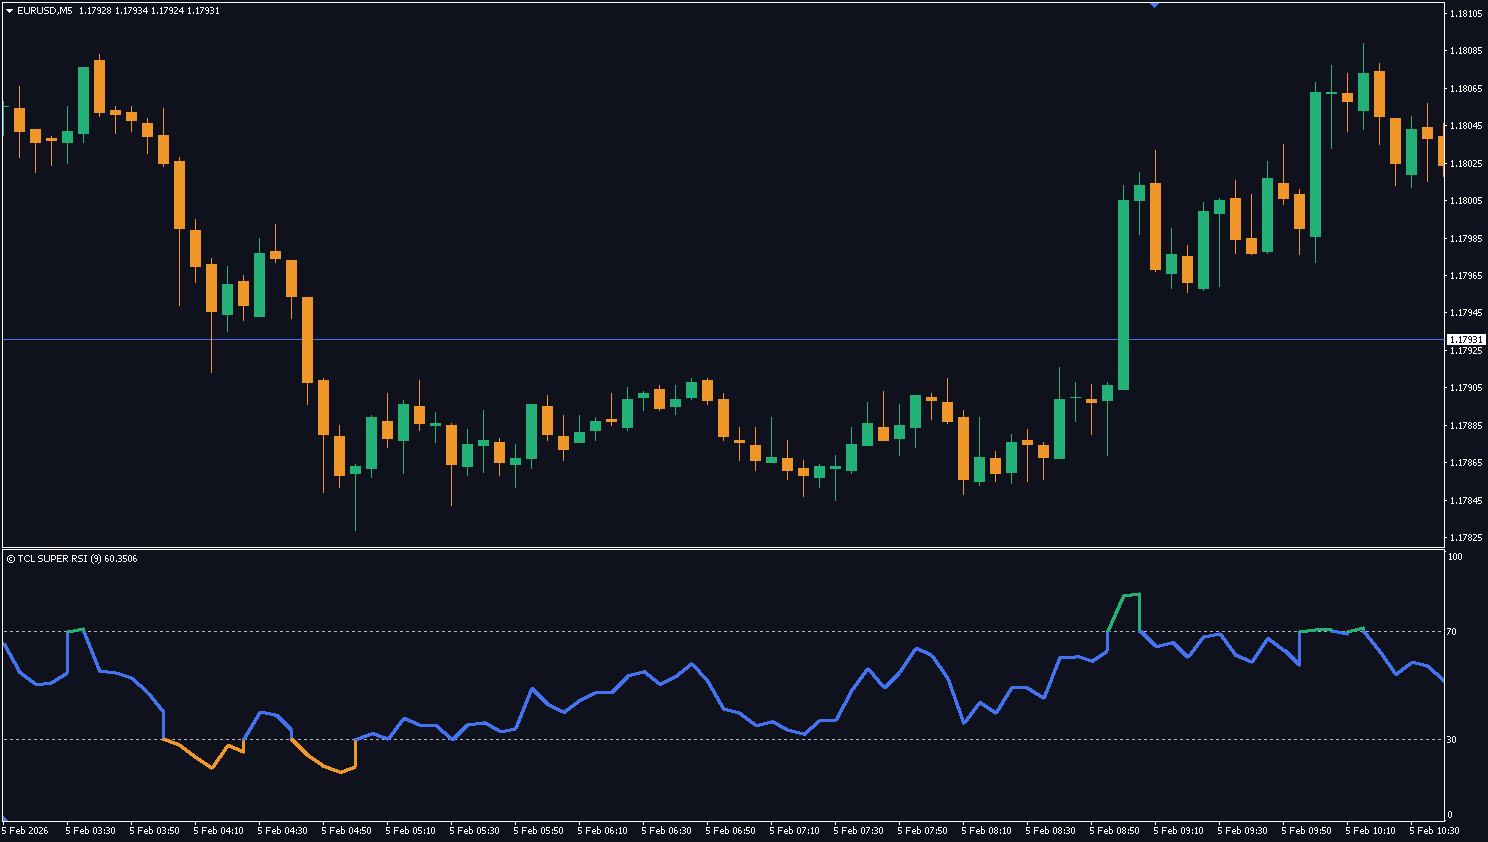
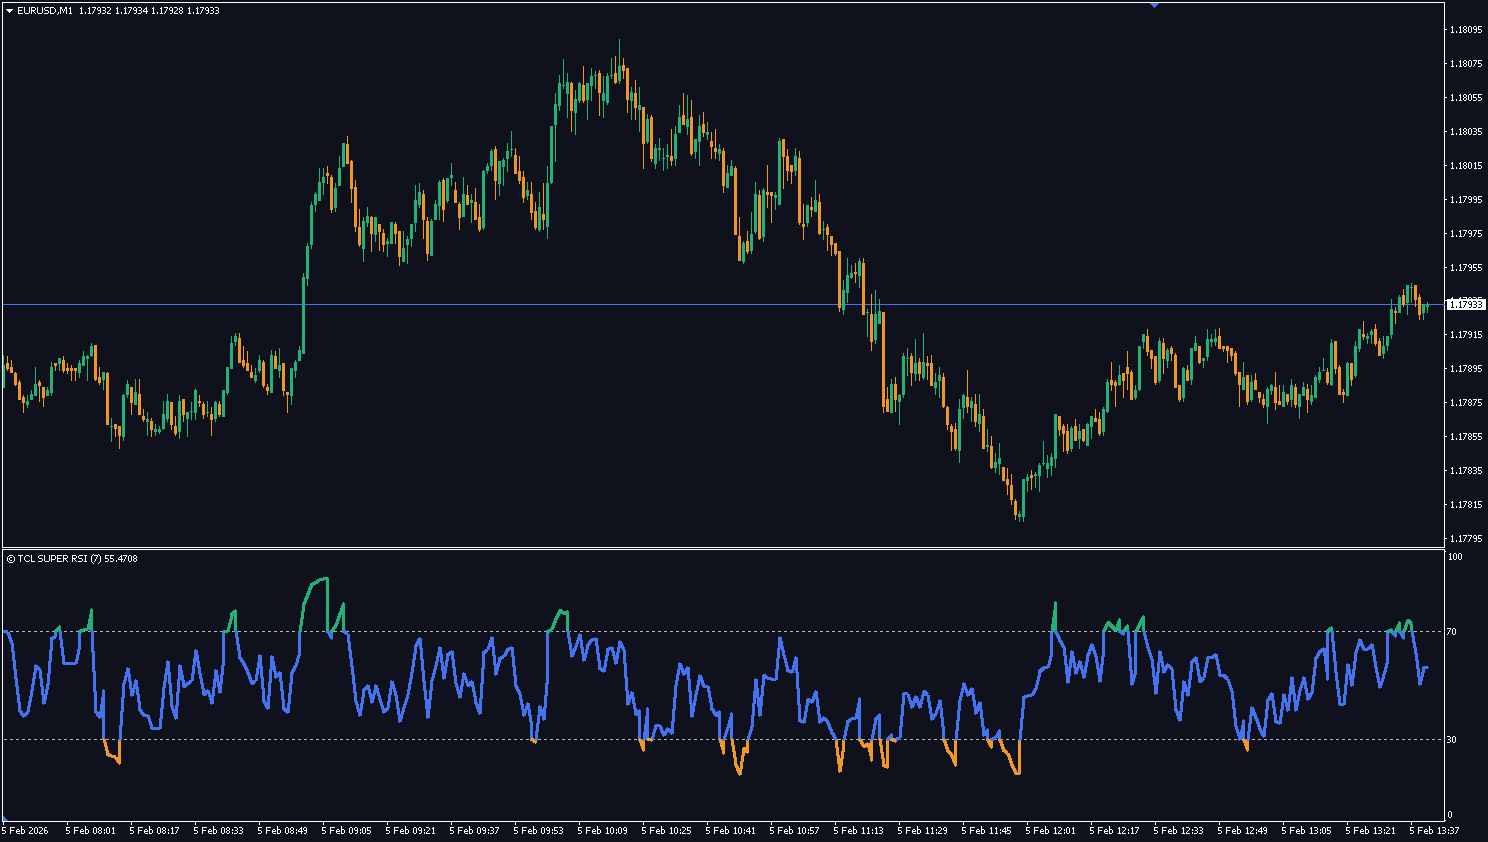
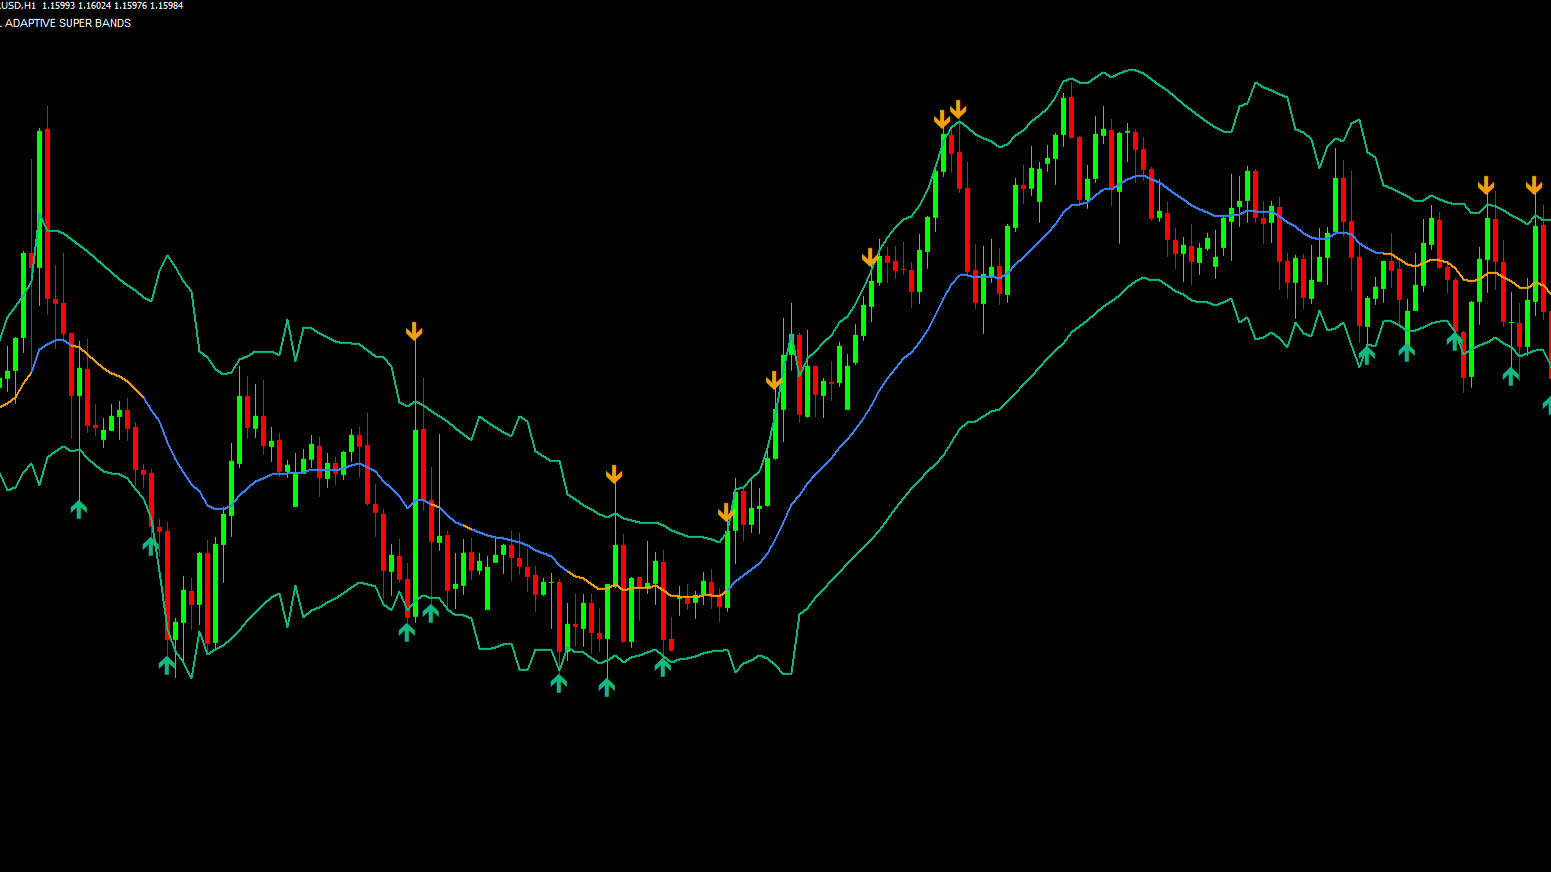
1. The Scalping Engine (M1–M5)
Objective: Speed & Reaction.
On lower timeframes, price action is dominated by algorithmic high-frequency trading. A standard RSI smooths this data too much, causing you to miss the entry.
Optimization: The indicator shifts to a 7–9 period sensitivity.
The Benefit: This allows you to identify “micro-exhaustion” points instantly. You see the overbought signal as the spike happens, not 3 candles later when the move is already over.
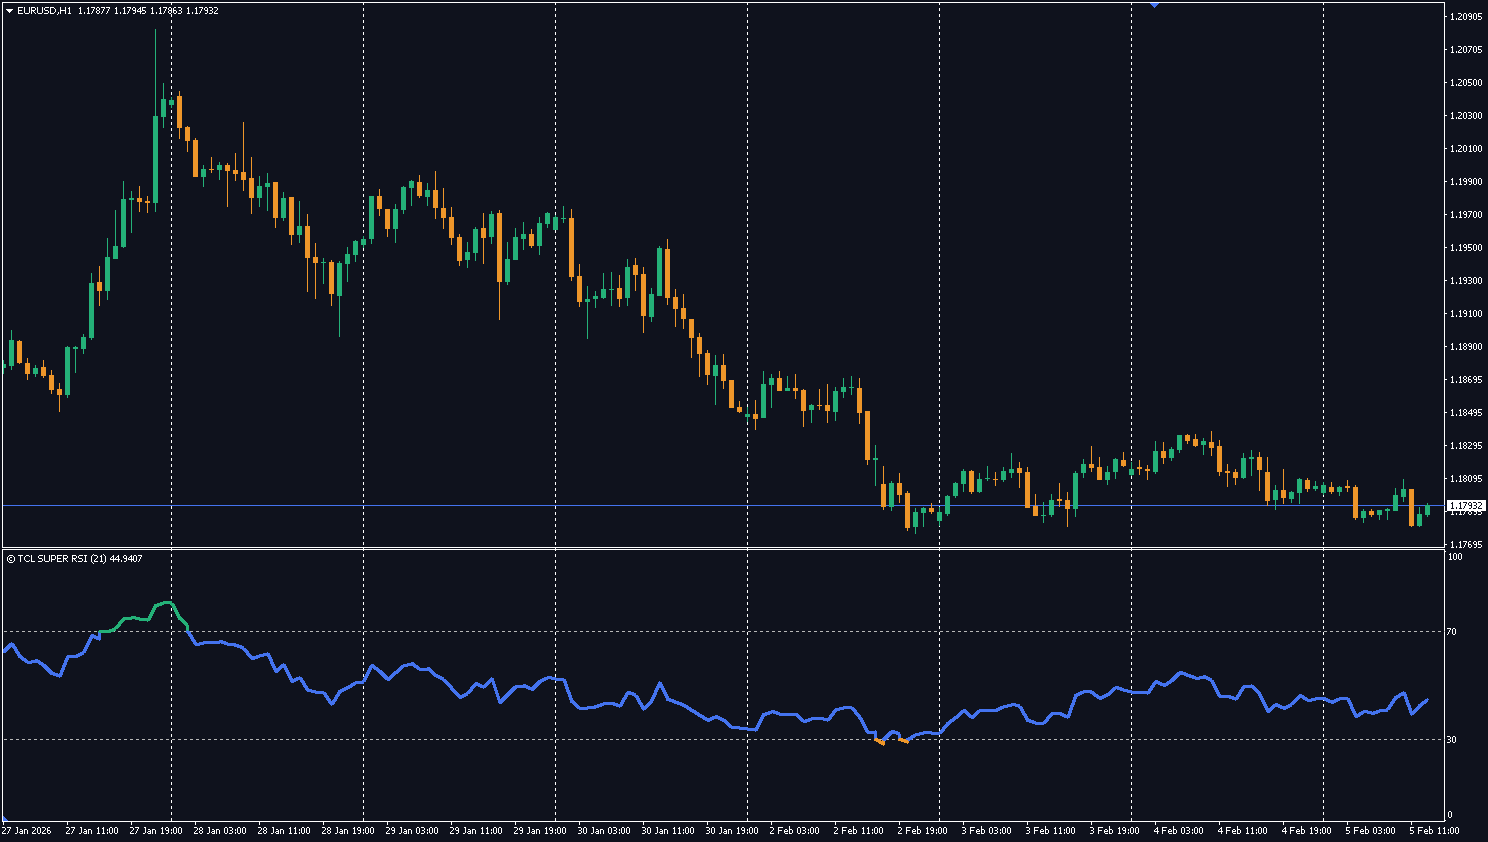
2. The Intraday Engine (M15–H1)
Objective: Balance & Noise Filtering.
Intraday charts are often messy due to session overlaps (e.g., London/New York overlap).
Optimization: The indicator normalizes to a 14–21 period setting.
The Benefit: This filters out minor news whipsaws while keeping you aligned with the primary session trend. It effectively ignores the “noise” of the lunch hour while reacting to genuine volume breakouts.
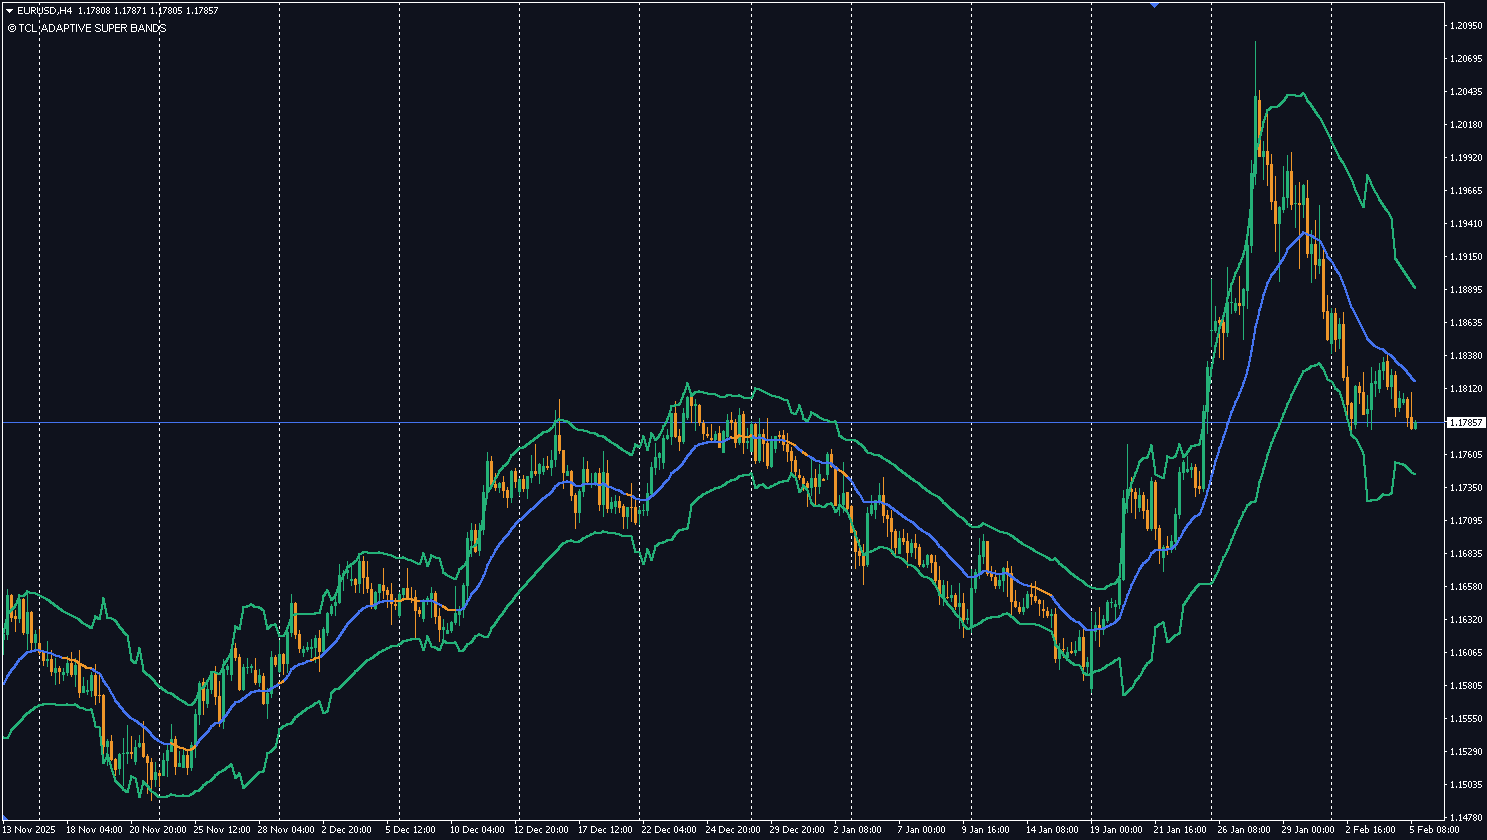
3. The Structural Engine (H4–Monthly)
Objective: Trend Stability.
Swing traders and investors need to ignore minor pullbacks to hold trades for maximum profit.
Optimization: The indicator expands to a 28–50 period lookback.
The Benefit: By doubling the data sample size, the indicator creates a heavily smoothed “Trend Power” line. It prevents you from exiting a winning trade prematurely just because of a single red candle.
Visual Ergonomics: Designed for Focus
Trading is mentally exhausting. Staring at a single-color purple line requires constant cognitive effort to interpret. We applied UX (User Experience) principles to the visual design to reduce this mental load.
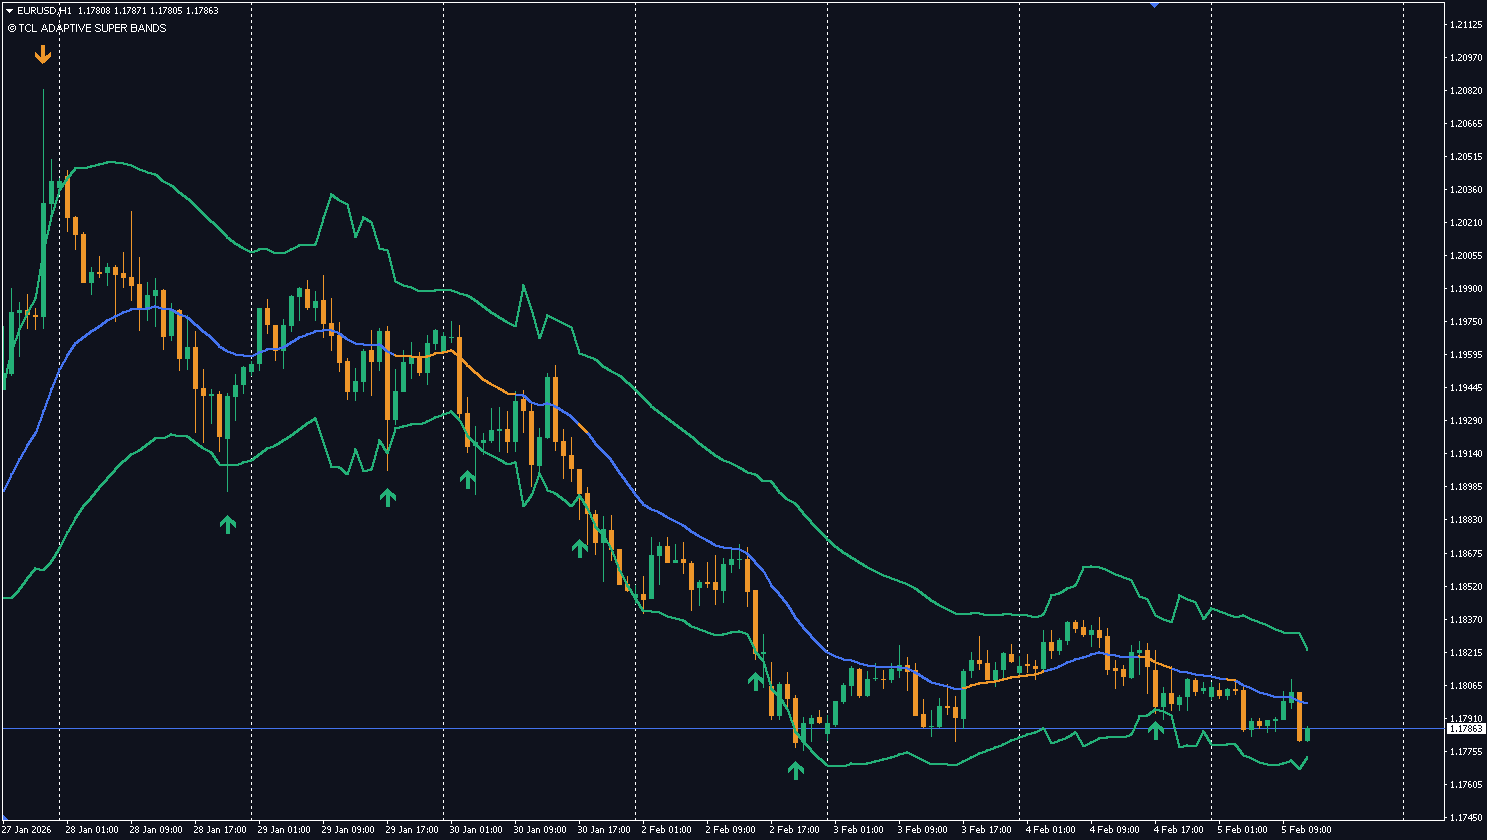
The 3-Zone Dynamic Coloring System
Green (Overbought): Momentum is statistically stretched to the upside (>70). Action: Look for Shorts or Take Profit.
Orange (Oversold): Momentum is statistically stretched to the downside (<30). Action: Look for Longs or Accumulate.
Blue (Neutral): Price is in equilibrium or steady trend. Action: Hold current positions.
By color-coding the line itself, your brain processes the market state instantly without needing to check the scale numbers on the right.
Strategy Integration: How to Trade It
This is not just a “signal” tool; it is a context filter. Professional traders use TCL Super RSI for two primary setups:
The Pullback Entry (Trend Continuation): In a strong uptrend, wait for the line to turn Blue. If it dips briefly towards 40-50 and turns back up without touching Orange, this is a high-probability continuation signal.
The Divergence Reversal: If price makes a higher high, but the TCL Super RSI (in Green mode) makes a lower high, this indicates momentum decay. It is one of the most reliable reversal signals in technical analysis.
How the Context-Aware Engine Adapts
Your Chart
Engine
RSI Period
Sensitivity
Best For
M1–M5
Scalping Engine
7–9
Very high — catches micro-exhaustion points
HFT-style scalping, rapid momentum bursts
M15–H1
Intraday Engine
14–21
Balanced — filters session noise
Day trading, London/NY session trades
H4–D1
Structural Engine
28–50
Low — ignores minor pullbacks
Swing trading, holding winners longer
W1–Monthly
Structural Engine
35–50
Very low — trend-only
Position trading, major trend analysis
3-Zone Dynamic Coloring System
Zone
Color
RSI Range
What It Means
Action
Overbought
🟢 Green
> 70
Momentum statistically stretched upside
Look for shorts or take profit on longs
Neutral
🔵 Blue
30–70
Equilibrium or steady trend
Hold current positions, no action
Oversold
🟠 Orange
< 30
Momentum statistically stretched downside
Look for longs or accumulate
Pro Tip: The Pullback Entry Strategy
In a strong uptrend, don’t wait for Oversold (Orange). Instead:
Watch for the RSI to enter Blue zone (neutral pullback)
If it dips to 40–50 and turns back up without touching Orange (< 30)
This is a high-probability continuation buy — the trend is healthy, just pulling back
Combine with TCL Auto Fibonacci to pinpoint the exact retracement entry level
Super RSI vs Standard RSI
Feature
Standard MT4 RSI
TCL Super RSI
Period setting
Fixed (default 14 for all charts)
Auto-adapts: 7-9 for M1, 14-21 for H1, 28-50 for D1
Optimal accuracy
Only on D1 (default setting)
Optimized for every timeframe M1–Monthly
Visual design
Single purple line
3-zone dynamic coloring (Green/Orange/Blue)
Divergence spotting
Difficult — jagged line on lower TFs
Clear peaks/troughs — optimized period reduces noise
Non-repainting
Depends on use
Yes — PRICE_CLOSE logic, confirmed on candle close
The default RSI uses a fixed 14-period for everything. TCL Super RSI automatically adjusts the period (7 for M1 scalping, 14-21 for intraday, 28-50 for swing) to give you the most accurate signals for your specific chart timeframe.
No. It uses PRICE_CLOSE logic — alerts and color changes are only confirmed once the candle officially closes. They will never vanish or shift after the fact.
In MT4, go to Tools > Options > Notifications. Check "Enable Push Notifications" and enter your MetaQuotes ID (found in your phone's MT4 app settings). Then set AlertsMobile = true in the indicator inputs.
Yes, it's excellent for divergence. Because the indicator uses optimized periods, the peaks and troughs are much clearer than on a standard jagged RSI, making divergence patterns easier to spot and more reliable.
The indicator instantly detects the change (e.g., from H1 to M5) and recalculates using the new optimized period (e.g., switching from 21 to 9). You don't need to change any settings.
The default 14-period RSI was designed for Daily charts. On M1–M5, the lag is too high to catch rapid moves — you see the overbought signal 3 candles after the spike already happened. Super RSI uses a 7–9 period on lower timeframes for real-time accuracy.
Divergence occurs when price makes a new high but RSI makes a lower high (or vice versa). It signals momentum decay and is one of the most reliable reversal signals in technical analysis. Super RSI's cleaner peaks make divergences much easier to identify.
Yes — completely free. Create a free account, download the .ex4 file, and install on MT4. No limitations or premium unlock required.

No reviews yet. Be the first to rate this tool!
Write a Review