Trade like the banks. Anchor your charts to the true average price (VWAP) with adaptive volatility bands that reveal institutional accumulation and distribution zones.
Volume Weighted Average Price (VWAP) is widely considered the most important benchmark for institutional traders. Unlike a simple moving average that treats every candle equally, VWAP gives more weight to candles with heavy volume. The TCL VWAP Super Bands indicator brings this institutional-grade tool to your chart, but with a powerful twist: Anchoring.
Anchored vs. Daily VWAP
Most VWAP tools only show you the current day’s average. This indicator gives you two modes:
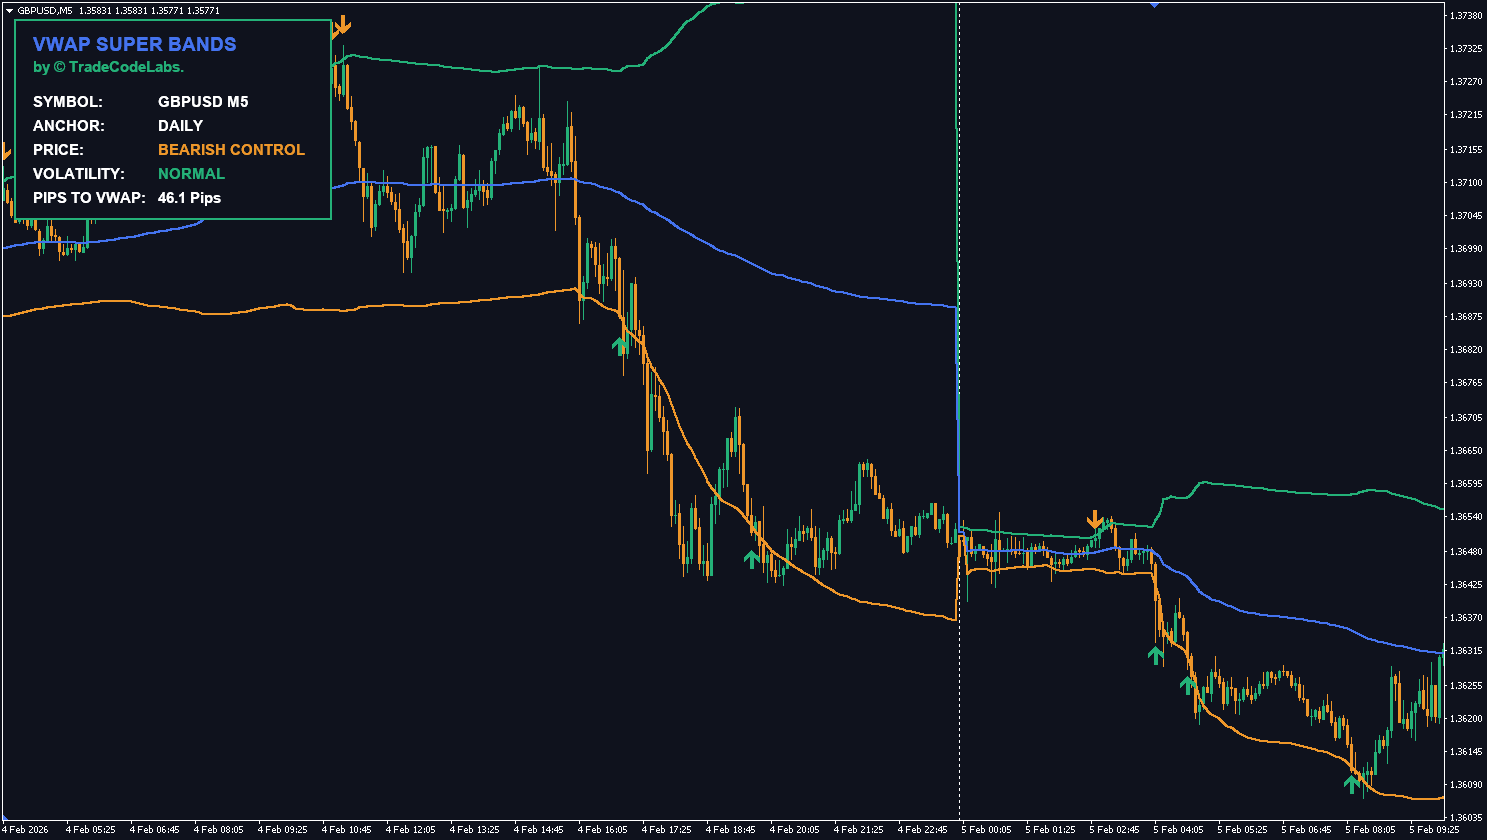
Daily Mode (Default): Resets the calculation at the start of every trading day. Perfect for day traders and scalpers looking for intraday reversion.
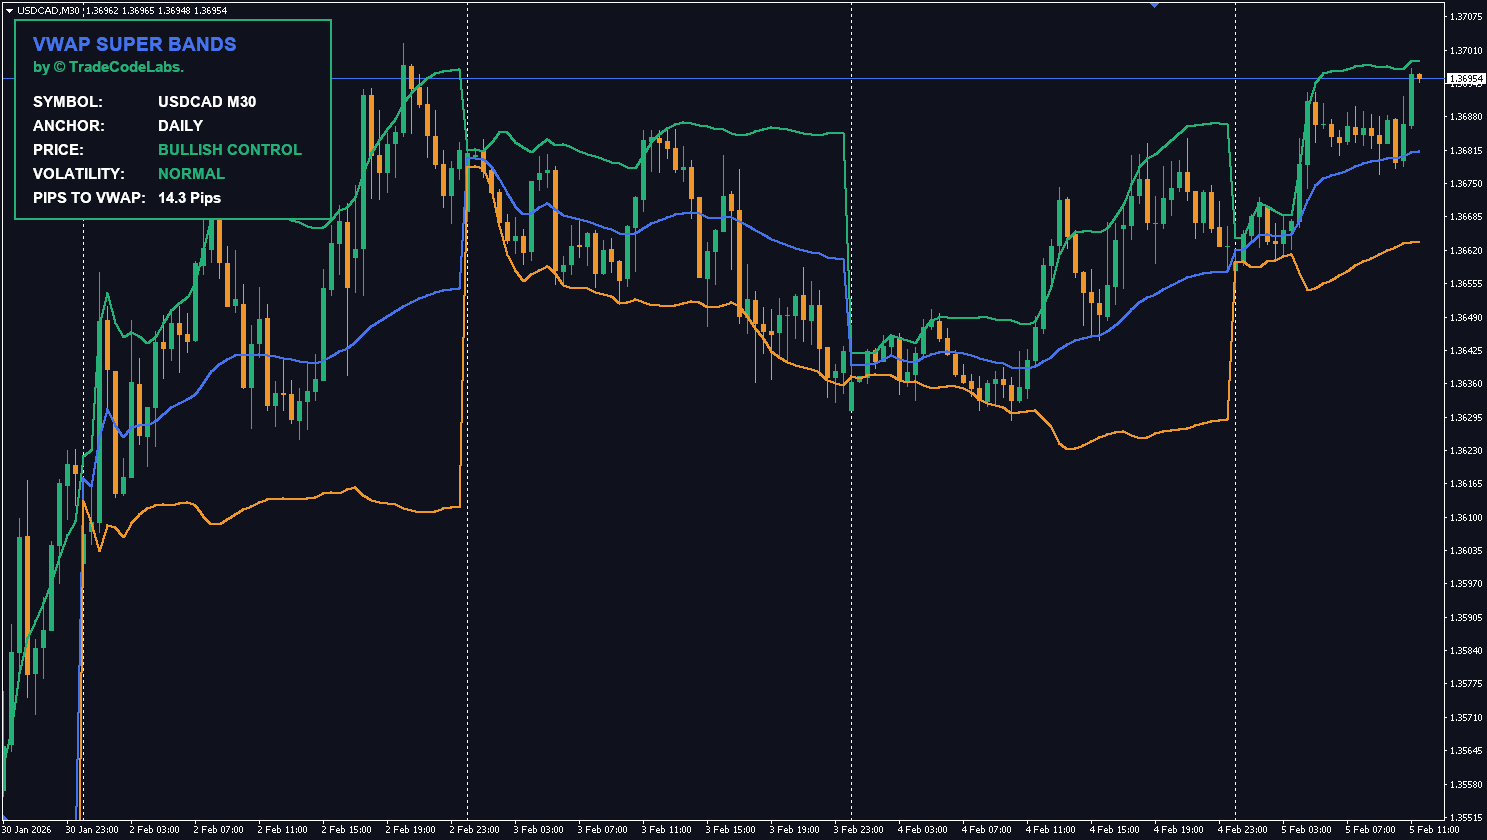
Custom Anchor Mode: Allows you to lock the VWAP to a specific event (e.g., “2023.11.14” for a CPI release or trend start). This reveals the “memory” of the market from that specific point in time, showing you who is in control (buyers or sellers) since that event.
Volatility Super Bands
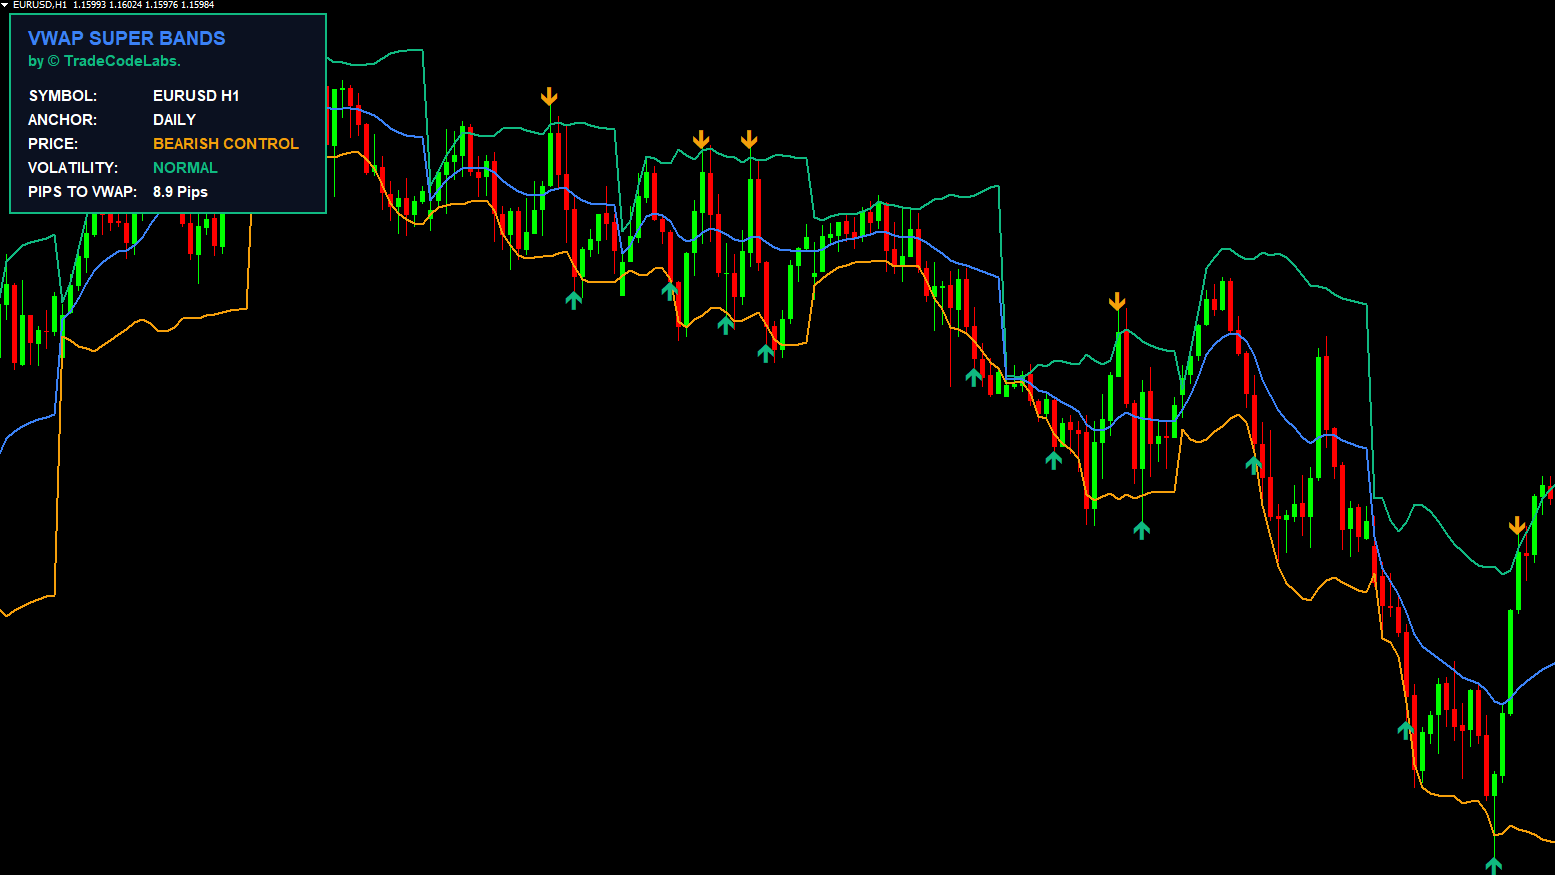
Surrounding the central VWAP line are upper and lower bands calculated using Standard Deviations. These act as dynamic support and resistance:
Reversion: When price hits the outer bands, it is statistically overextended, often leading to a snap-back towards the VWAP (mean reversion).
Squeeze: When the bands contract (squeeze), it indicates a buildup of energy, often preceding a major breakout.
Daily VWAP vs Anchored VWAP — When to Use Each
Mode
Resets
Best For
Timeframes
Use Case
Daily Mode
Start of each trading day
Scalpers & day traders
M1, M5, M15, M30
Intraday mean reversion — buy below VWAP, sell above
Custom Anchor
Never (fixed to your date)
Swing traders & event traders
H1, H4, D1
Anchor to CPI release, earnings, trend start — see who’s in control since that event
Pro Tip: Anchor your VWAP to the last major swing low/high on D1. This shows you whether buyers or sellers are in control since the last significant market turn. If price trades above the anchored VWAP, institutions are net long — look for dips to buy. Below = net short, look for rallies to sell.
How to Read the VWAP Bands
Zone
What It Means
Trading Action
Price above upper band
Statistically overextended to the upside
Mean reversion sell opportunity (or trend continuation if squeeze breaks up)
Price at VWAP line
At fair value — balanced between buyers and sellers
No edge — wait for a move to the bands
Price below lower band
Statistically overextended to the downside
Mean reversion buy opportunity (or trend acceleration if squeeze breaks down)
Bands contracting (Squeeze)
Low volatility — energy building
Prepare for breakout — reversion signals disabled during squeeze
In Daily Mode, the VWAP resets every day. On H4 or D1 charts, a single day is just a few bars, making the calculation invalid. For H4/D1 trading, you must set a specific Anchor Date (e.g., the start of the year or a major swing point).
Look for a major Swing Low or Swing High on your chart. Hover your mouse over that candle to see the date (yyyy.mm.dd format) and enter it into the Anchor Date setting.
No. The VWAP is a cumulative calculation. Once a bar closes, the volume and price data for that bar are fixed, so the VWAP value for that bar never changes.
The indicator calculates the width of the bands relative to history. If the bands are unusually tight (squeeze), it suggests a breakout is coming. By default, reversion signals are disabled during a squeeze to prevent losses from trading against a breakout.
VWAP (Volume Weighted Average Price) gives more weight to candles with heavy volume, unlike a simple moving average. Institutions use it as a benchmark to measure execution quality — buying below VWAP means they got a "good" price. It represents the true average price the market paid.
A Moving Average treats every candle equally regardless of volume. VWAP weights each candle by its volume — a high-volume candle moves the VWAP more than a low-volume candle. This makes VWAP more reflective of where actual money exchanged hands.
Yes — completely free. Create a free account, download the .ex4 file, and install on MT4. No limitations or premium unlock required.
No reviews yet. Be the first to rate this tool!
Write a Review