Precision Multi-Layer Signal Detector for MT4 & MT5
TCL BOOM CRASH LITE is a premium, multi-layered trading indicator engineered by TradeCodeLabs to identify high-probability reversal and continuation setups specifically in Boom and Crash markets. Available natively for both MT4 and MT5, this tool removes the guesswork from your charts by combining momentum exhaustion, hidden divergence, and strict price action into one seamless system.
Whether you are trading the spikes or riding the broader trend, TCL BOOM CRASH LITE provides clear, non-repainting visual signals backed by a robust, multi-tier confirmation engine.
The Multi-Layer Confirmation Engine
To ensure only the highest quality signals are generated, the indicator processes live price data through a strict series of filters. A signal is only printed when all layers align:
- The Master Trend Engine: Before any signal is validated, the system checks the broader market direction using a powerful confluence of Moving Averages (MA), RSI thresholds, and MACD.
- Layer 1 | RSI Momentum & Divergence: The system scans for initial momentum exhaustion via RSI overbought/oversold crossovers. It also features a built-in divergence detector to spot hidden bullish or bearish reversals.
- Layer 2 | Stochastic Confirmation: Signals must be backed by Stochastic oscillator crossovers or deep extreme conditions to prevent false entries in chopping markets.
- Layer 3 | Strict Candlestick Patterns: The final trigger. The indicator waits for definitive price action confirmation—such as engulfing candles, pin bars, shooting stars, or strong momentum bodies—before generating an entry arrow.
Key Features
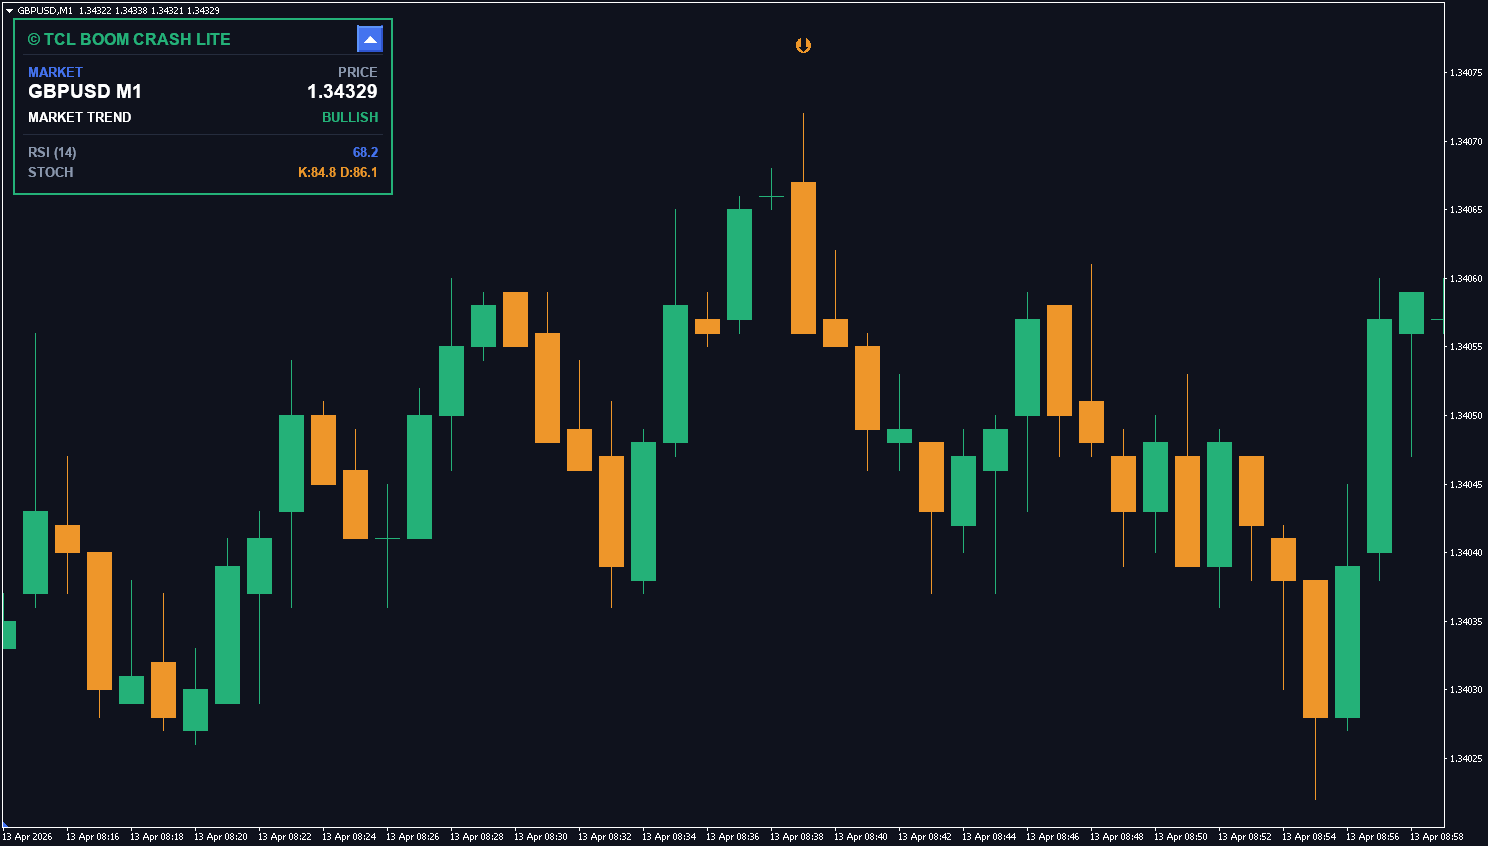
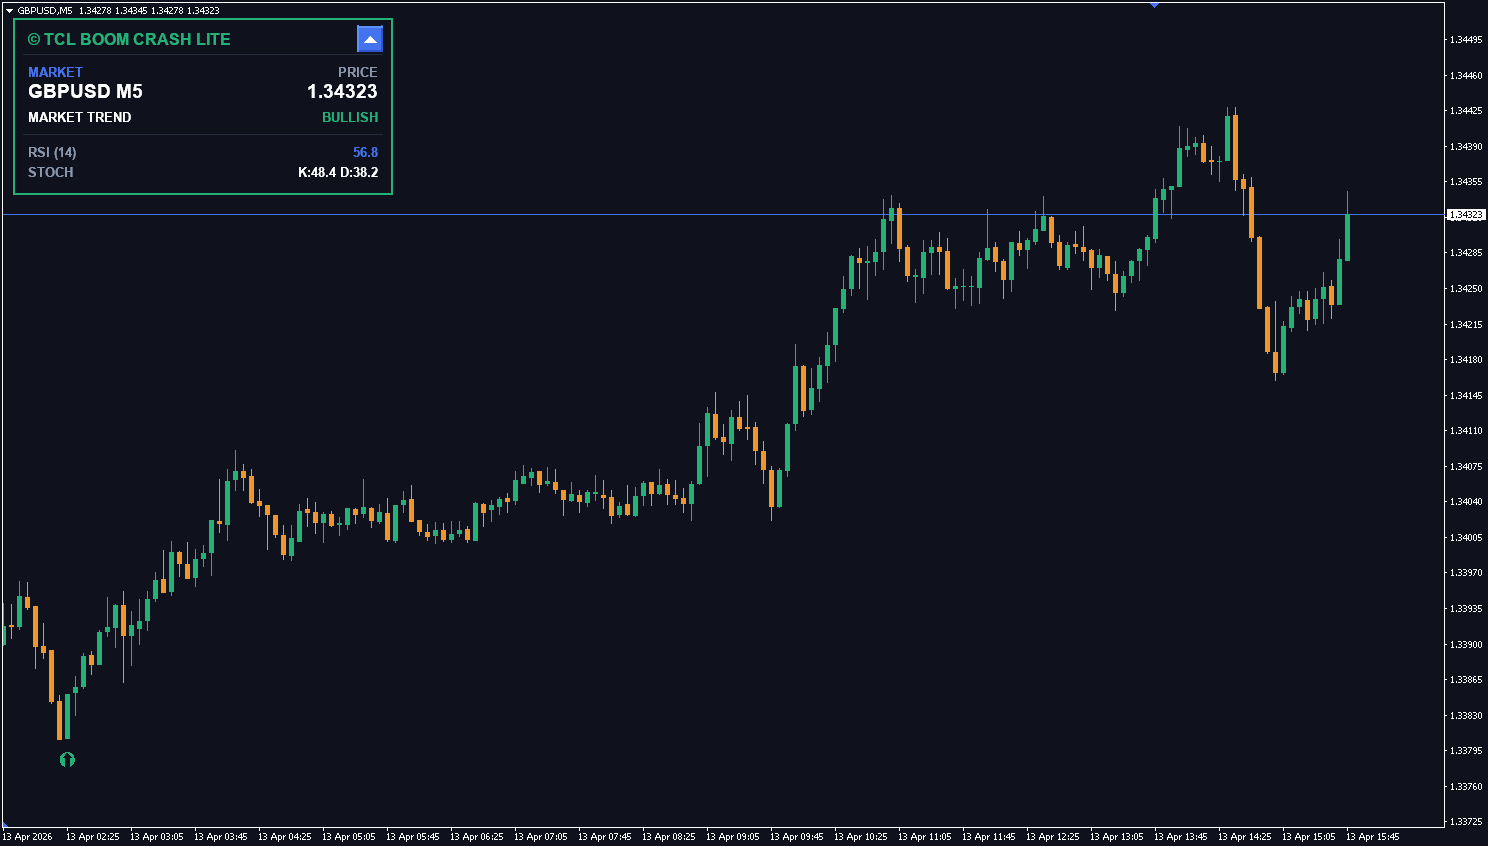
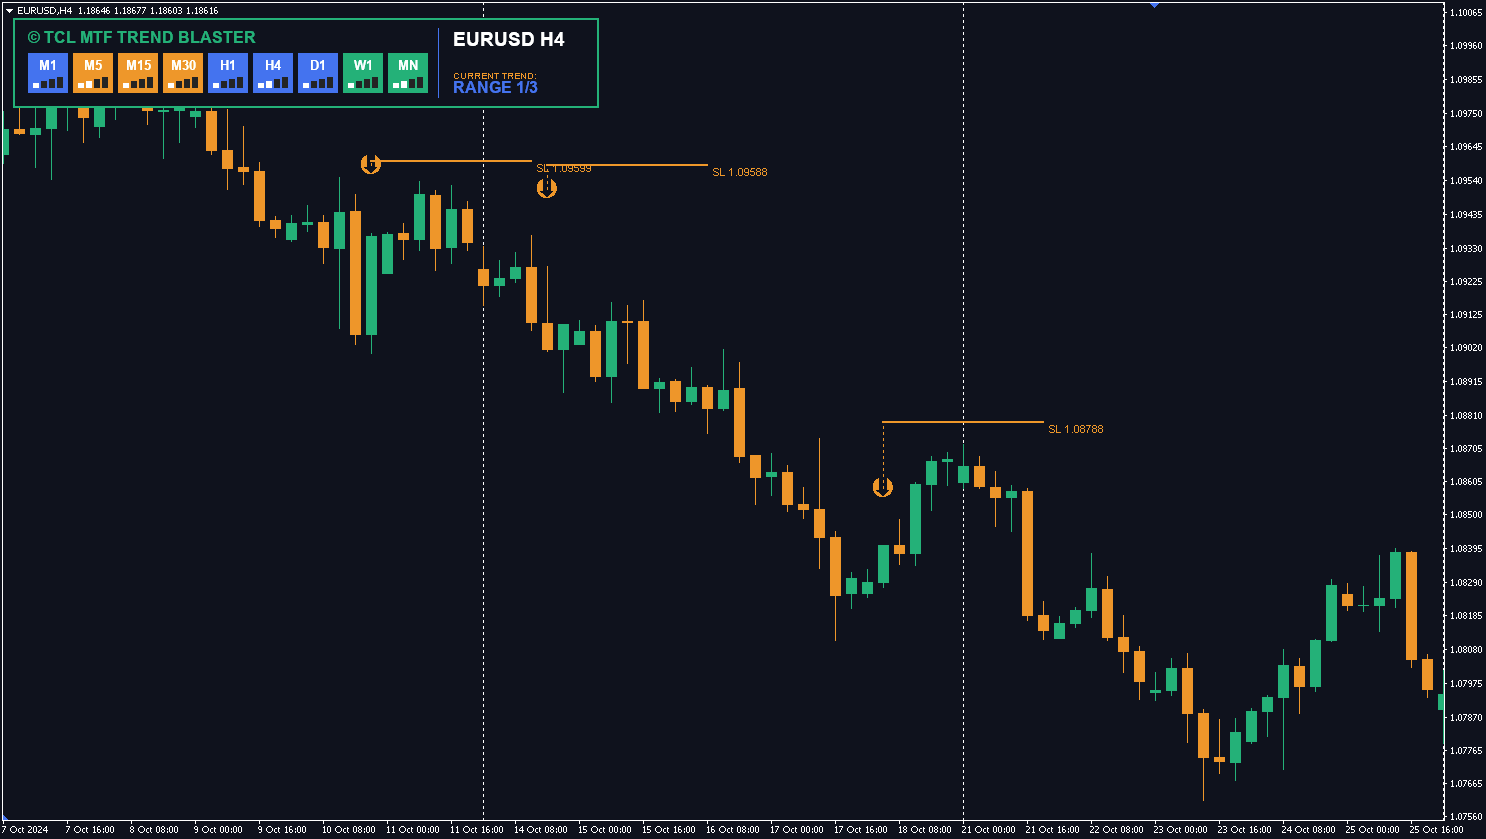
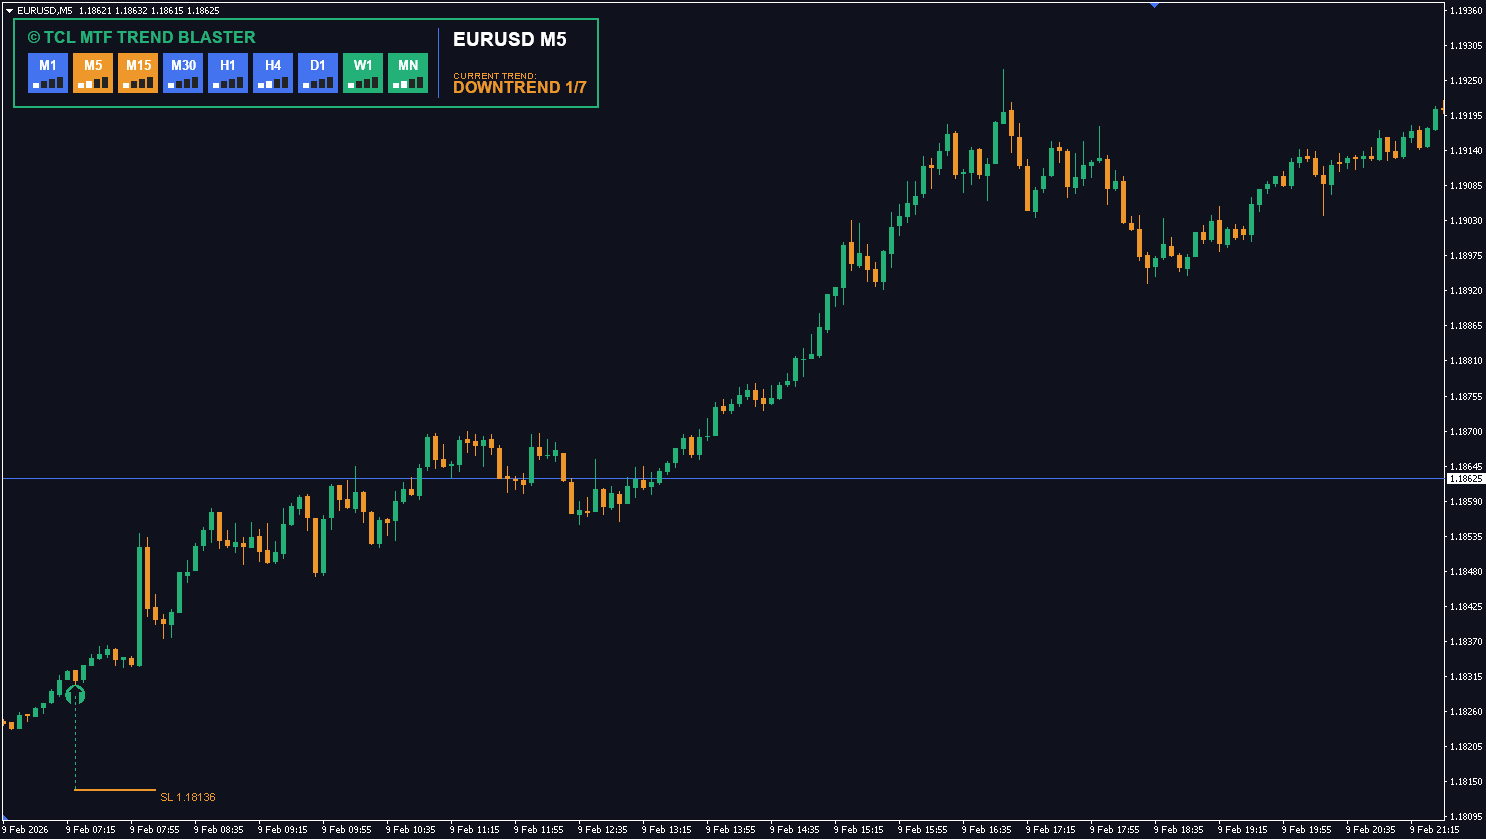
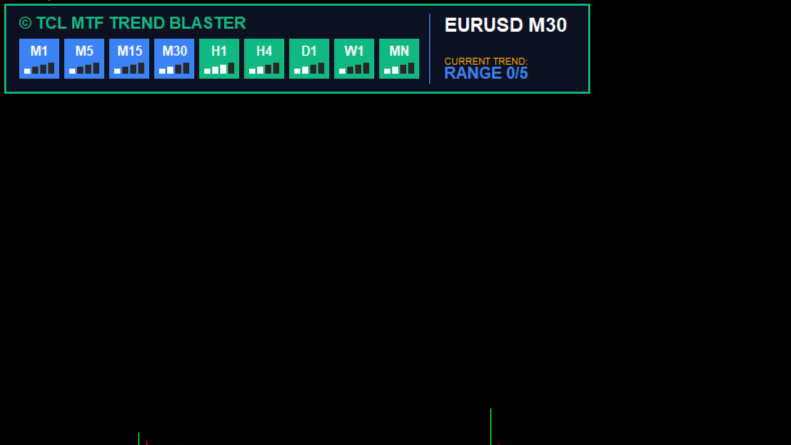
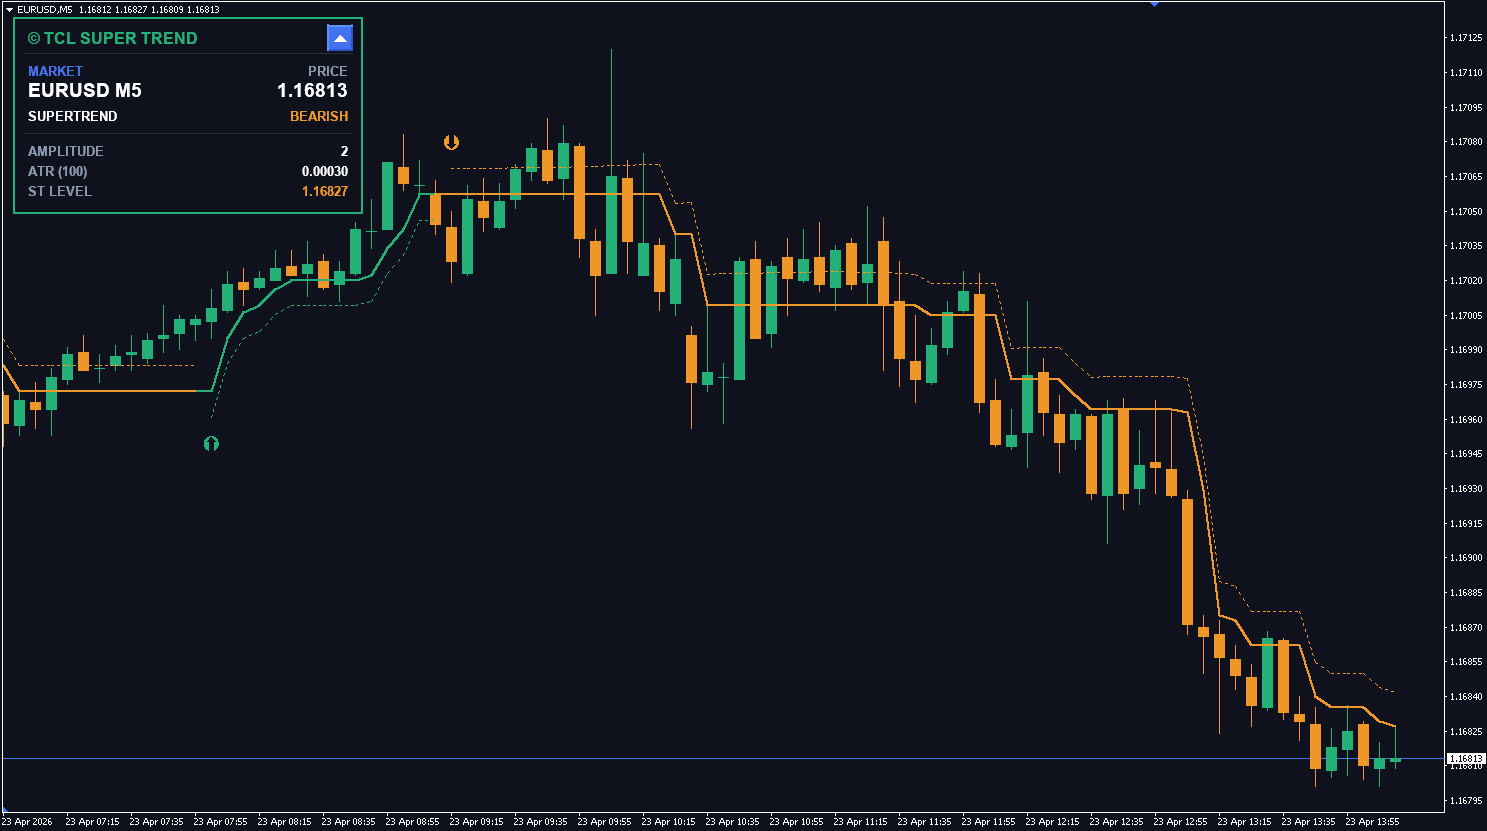
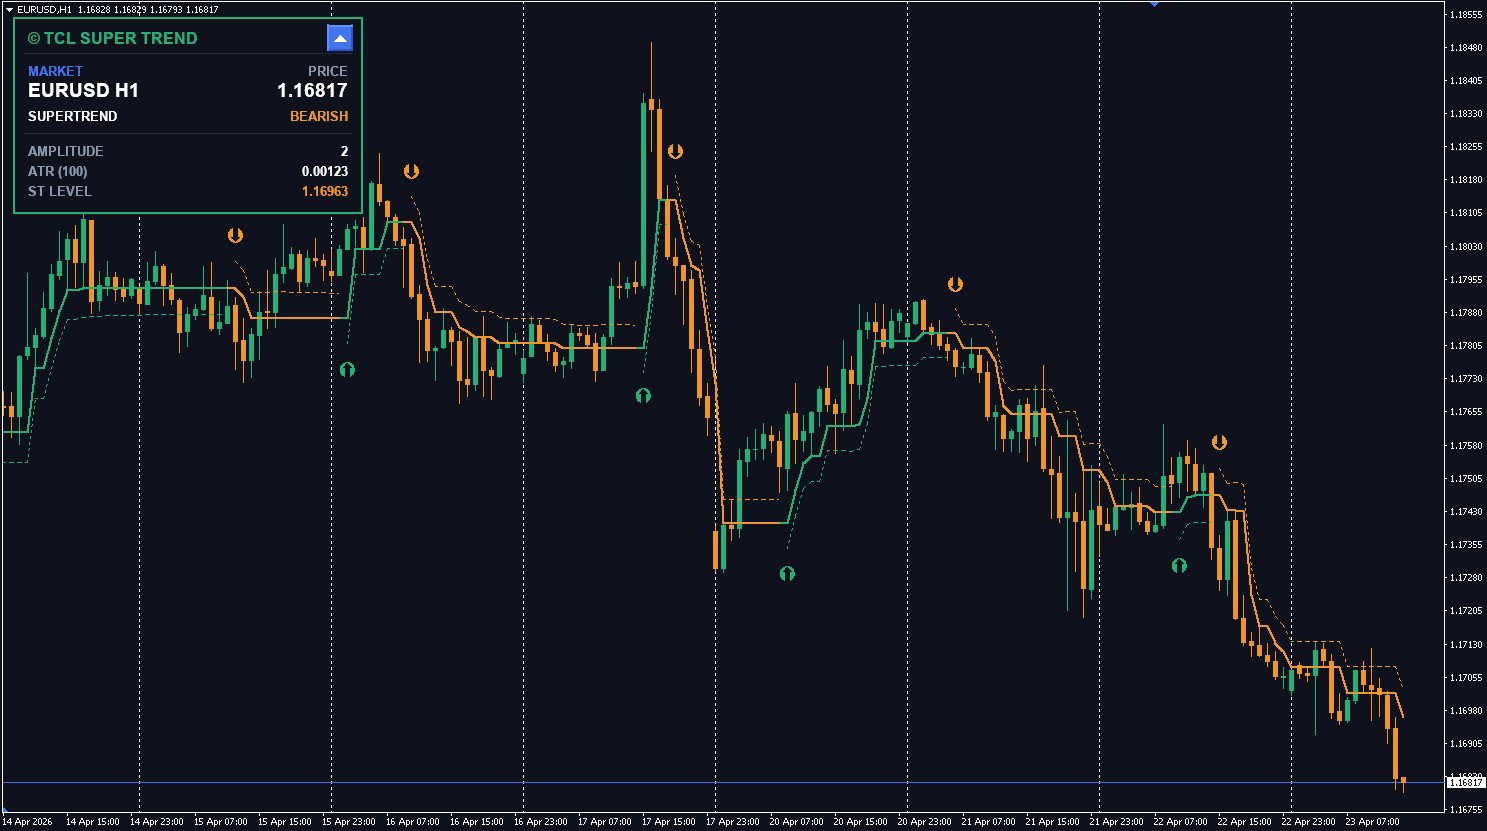
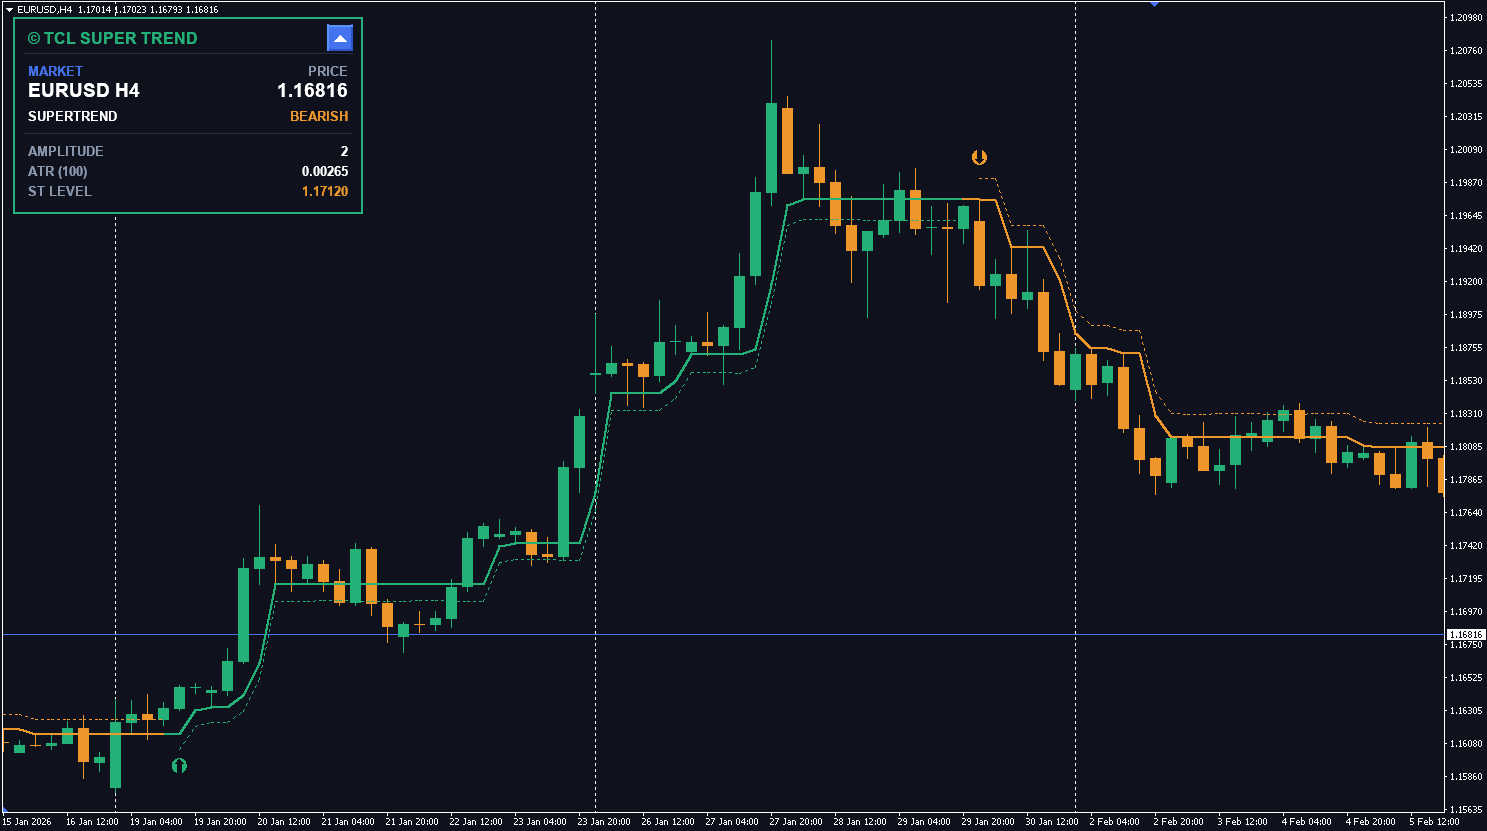
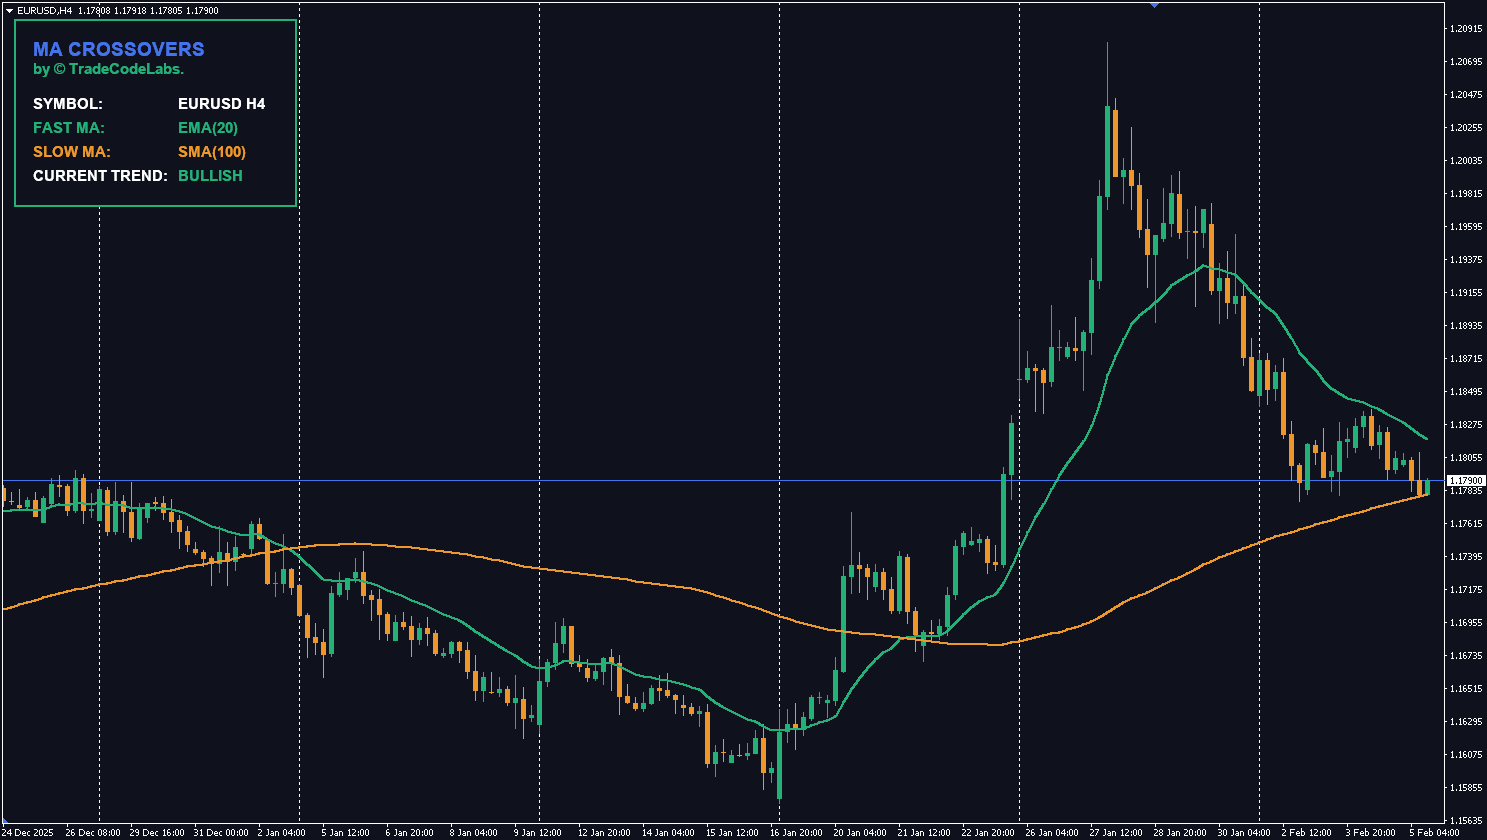
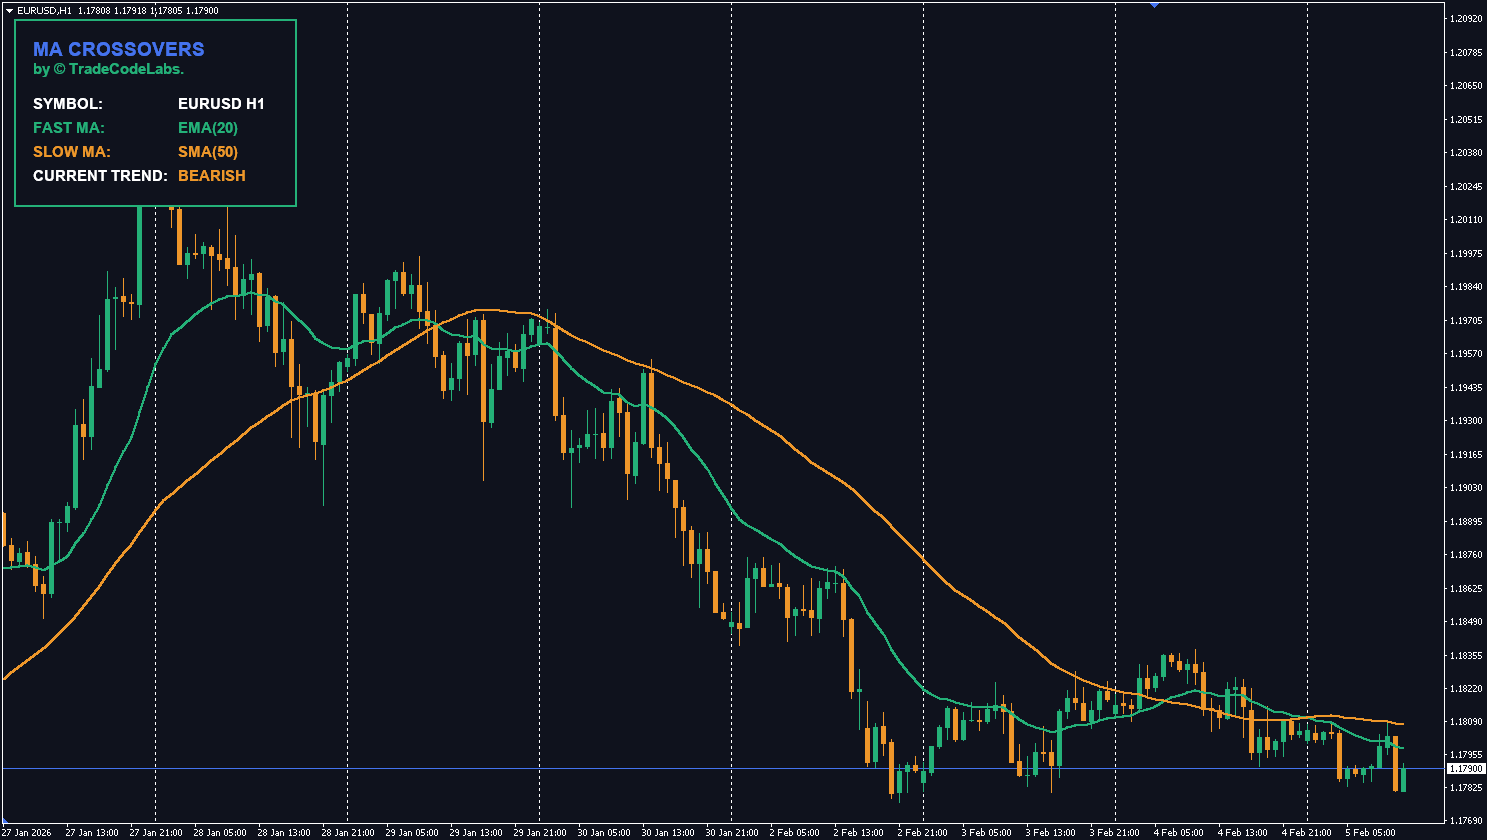
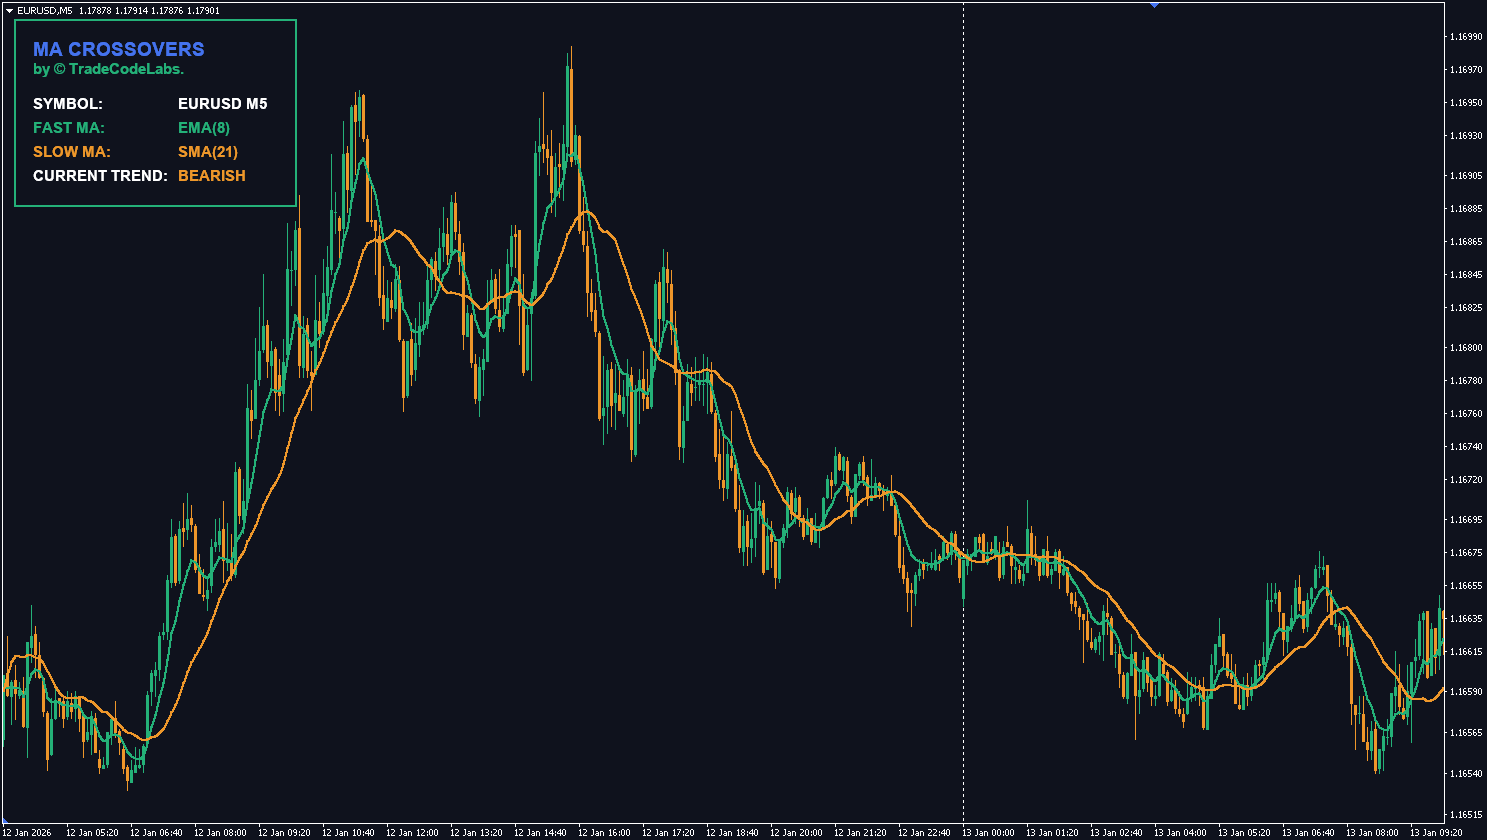
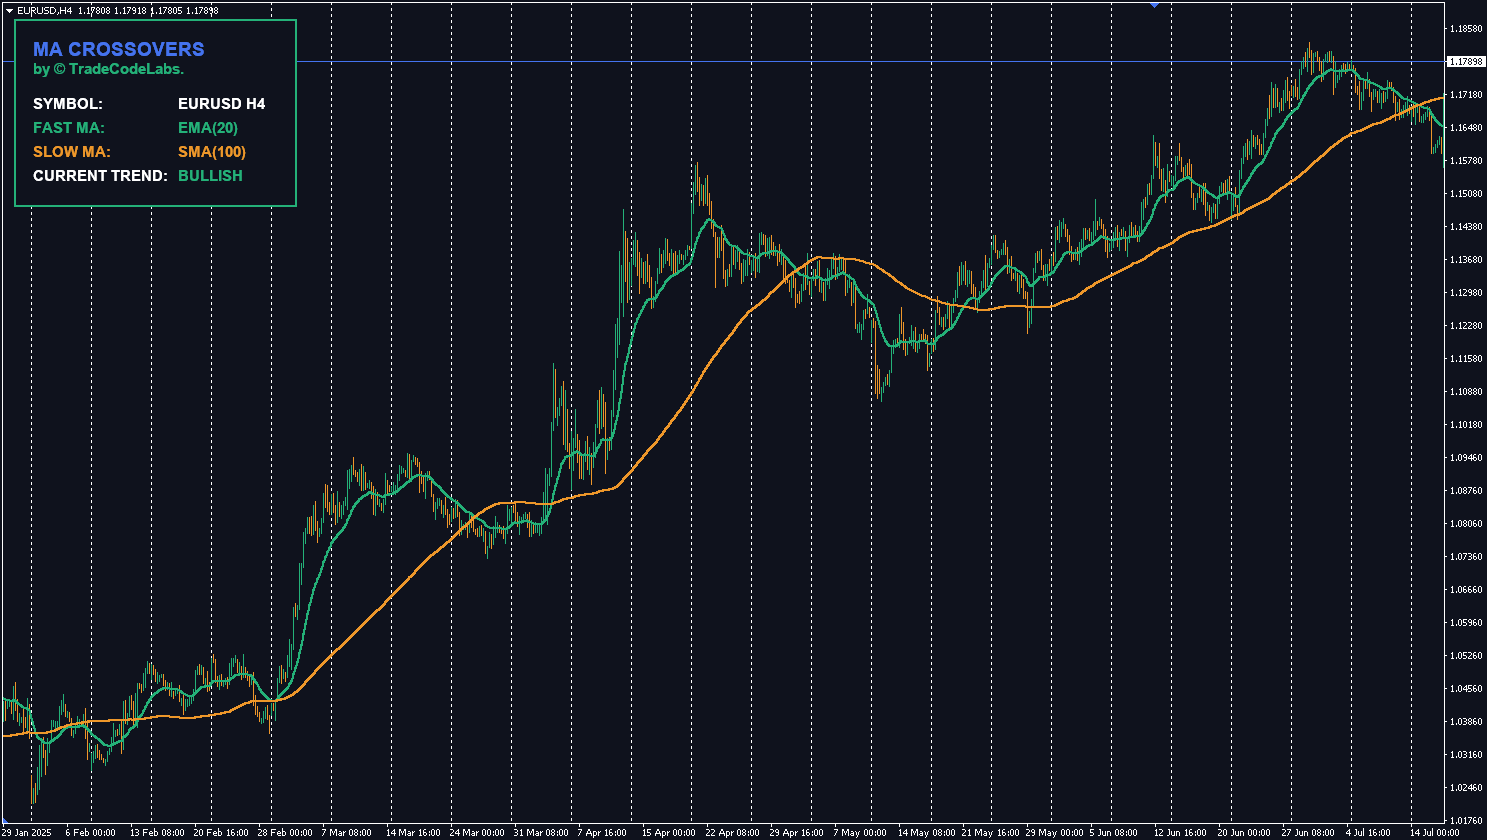
- Interactive On-Chart Dashboard: A sleek, minimizable GUI panel that gives you a bird’s-eye view of the market. Monitor the current instrument, live price, overall market trend, and exact RSI/Stochastic values without cluttering your workspace.
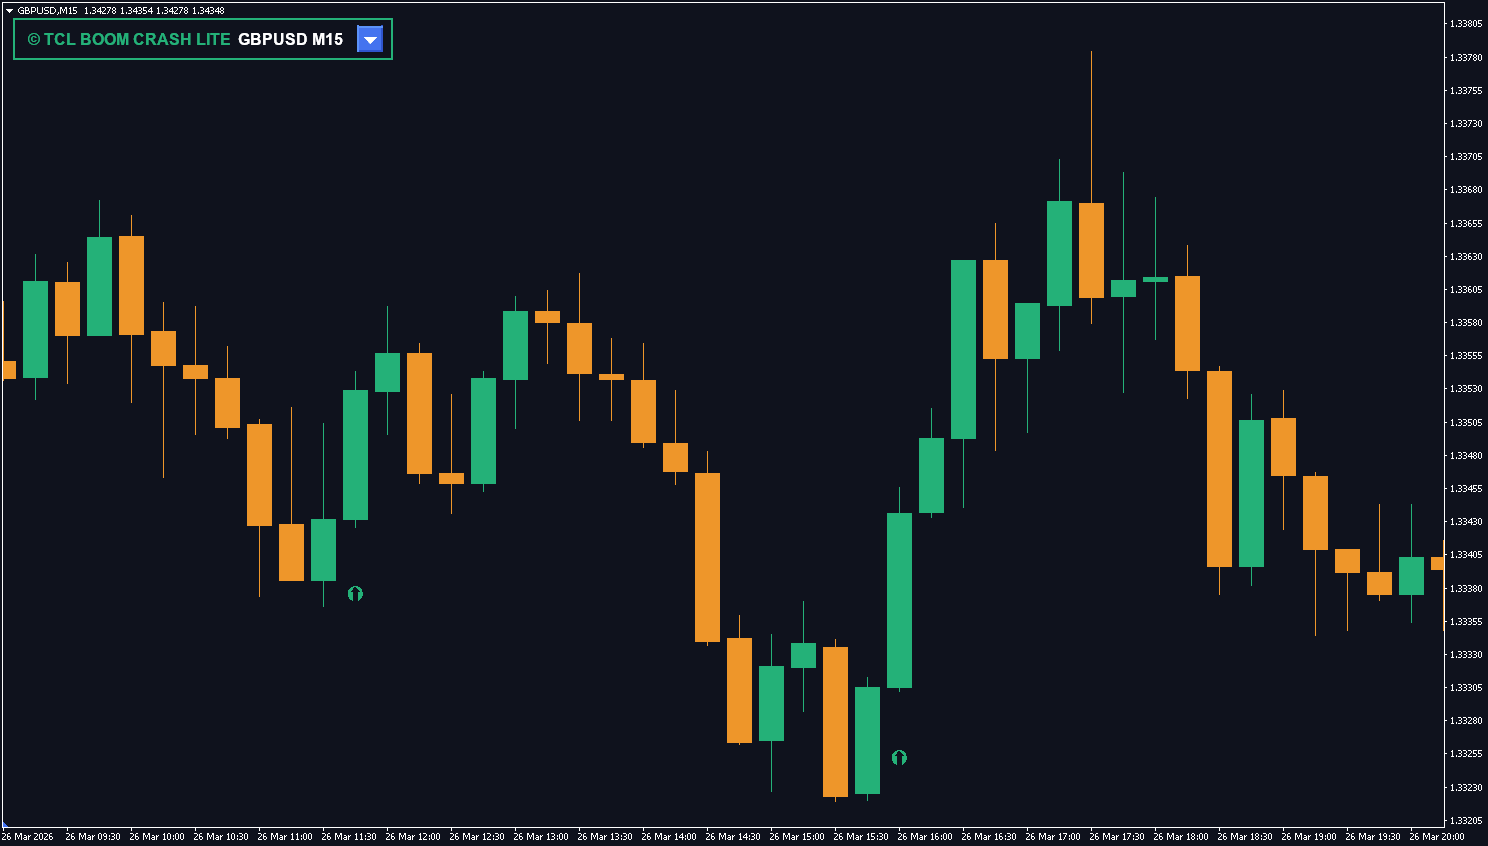
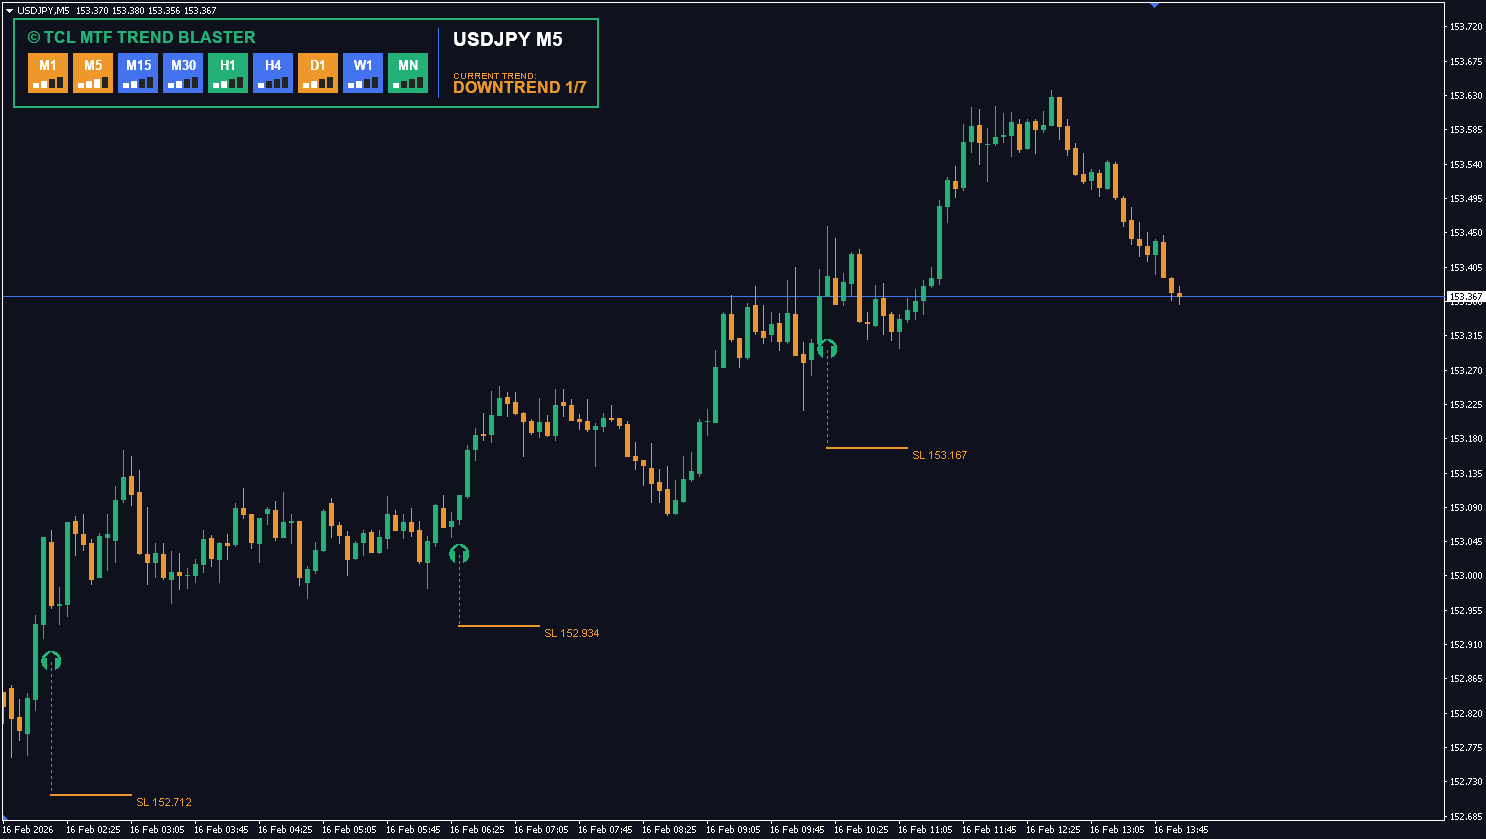
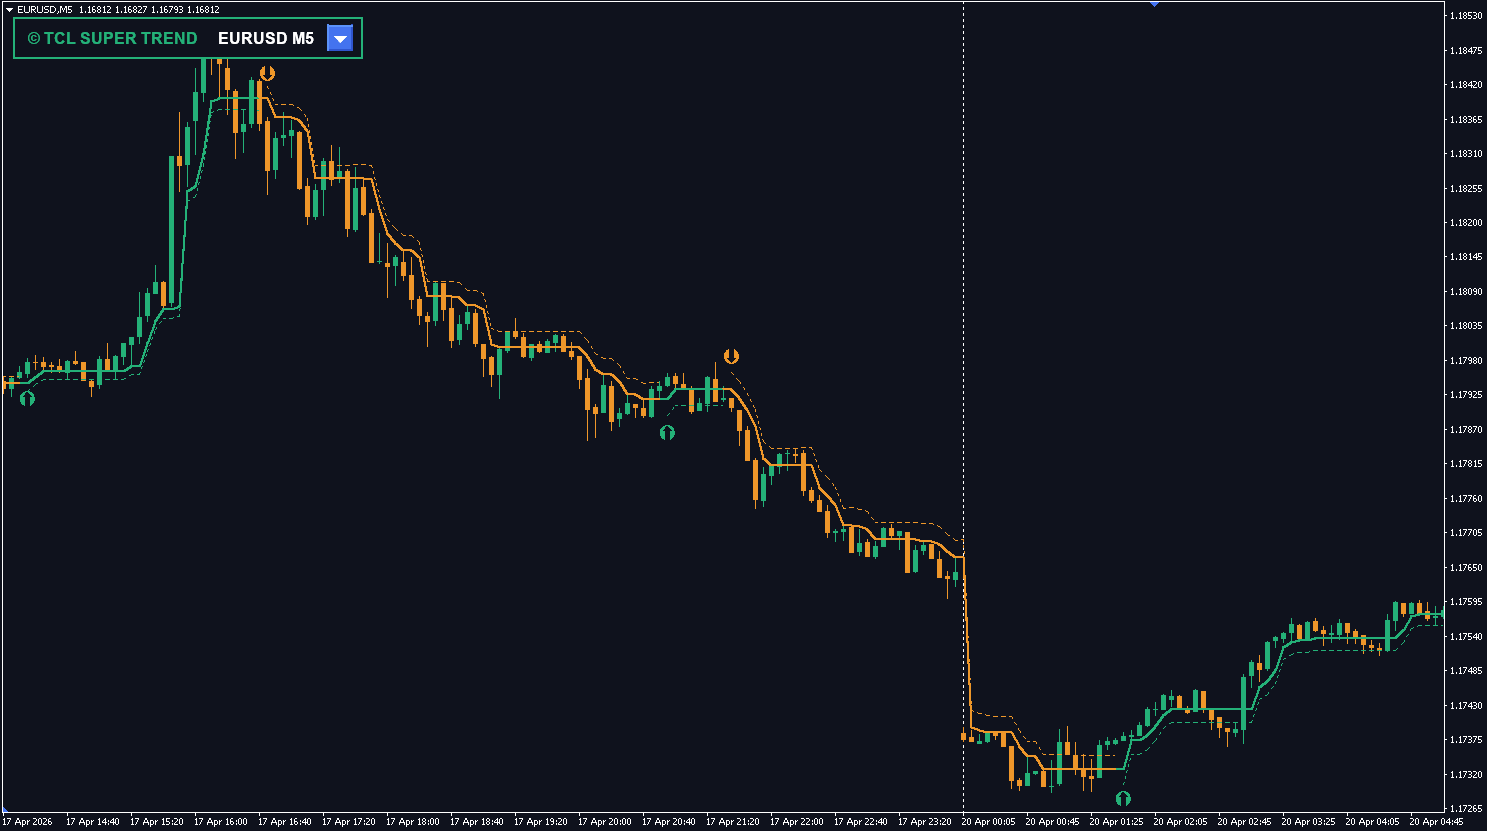
- Clear Visual Execution: Distinct TCL Green arrows for “Boom Buy” setups and TCL Orange arrows for “Crash Sell” setups keep your chart clean and your directional bias crystal clear.
- Omnichannel Alerts: Never miss a setup. Get notified instantly via terminal pop-ups, sound alerts, email dispatches, or mobile push notifications.
- Highly Customizable: Take full control over indicator periods, toggle specific filters (like divergence or candlestick rules) on or off, and adjust the minimum gap between signals to suit your exact trading style.
Recommended Trading Strategy
To get the most out of TCL BOOM CRASH LITE, we recommend trading in alignment with the built-in Master Trend Engine.
1. Trading the Boom Markets (Boom 500, Boom 1000)
Boom markets are characterized by slow bearish drops followed by massive bullish spikes.
- The Setup: Wait for a TCL Green Buy Arrow.
- Trend Filter: Check the dashboard. The highest probability buy signals occur when the Market Trend is BULLISH or NEUTRAL.
- Execution: Enter a Buy position immediately upon the close of the signal candle.
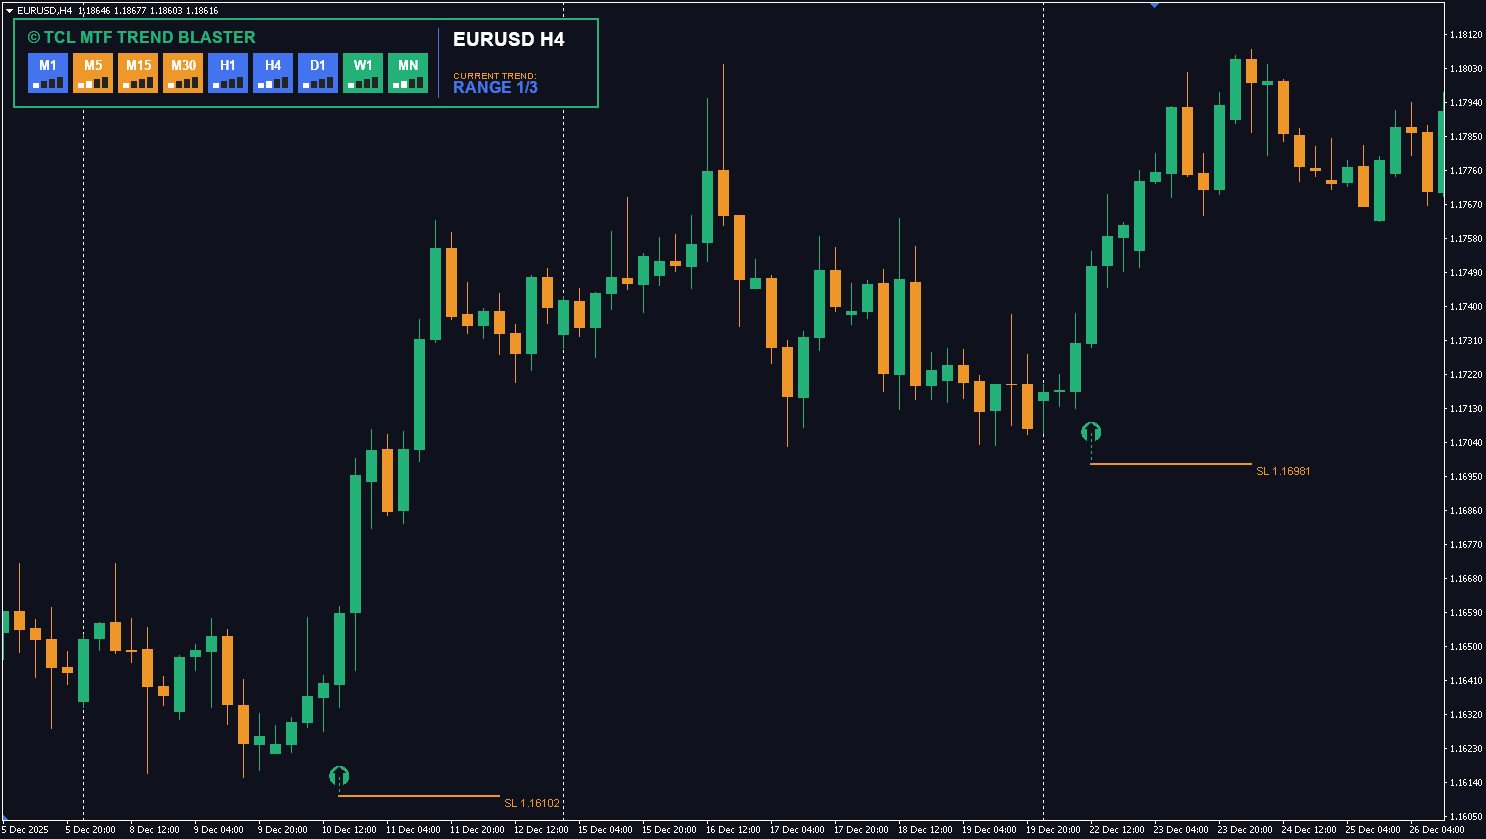
- Risk Management: Place your Stop Loss slightly below the recent swing low, or below the ATR-based buffer zone calculated by the indicator. Take Profit can be set at the next major resistance level or after catching 1 to 2 major spikes.
2. Trading the Crash Markets (Crash 500, Crash 1000)
Crash markets are characterized by slow bullish climbs followed by sudden, violent bearish drops.
- The Setup: Wait for a TCL Orange Sell Arrow.
- Trend Filter: Check the dashboard. The highest probability sell signals occur when the Market Trend is BEARISH or NEUTRAL.
- Execution: Enter a Sell position immediately upon the close of the signal candle.
- Risk Management: Place your Stop Loss slightly above the recent swing high. Take Profit can be set at the next major support level or after capitalizing on the initial crash sequence.
3. Advanced Tip: The Dashboard Advantage
Always keep an eye on the Dashboard before taking a trade. If you receive a Buy signal, but the dashboard shows RSI and Stochastic are already heavily overbought and the trend is bearish, it may be a lower-probability setup. Use the dashboard to confirm that there is still “room to run” in your chosen direction.
User Reviews (1)
Mokhine Phogole
the multi-layer confirmation is legit. RSI + Stochastic + candlestick pattern all have to align before it prints an arrow. way fewer false signals than other boom crash tools ive tried. the trend engine filter prevents trading against the bigger picture. running it on Deriv MT5 Boom 1000 no issues
Write a Review