MetaTrader 4 (MT4) remains the most widely used trading platform in the world — and for good reason. With over 30 built-in technical indicators and thousands of custom ones available, MT4 gives traders at every level the tools they need to analyze markets, spot setups, and execute with confidence.
But here’s the problem: most traders either use too many indicators (creating confusion) or use the wrong ones entirely.
This guide breaks down everything you need to know about MT4 indicators in 2026 — what they are, how they work, the four core categories, the best ones to use, and the mistakes that cost traders money. Whether you’re just getting started or looking to sharpen your edge, this is the only guide you’ll need.
What Is an MT4 Indicator?
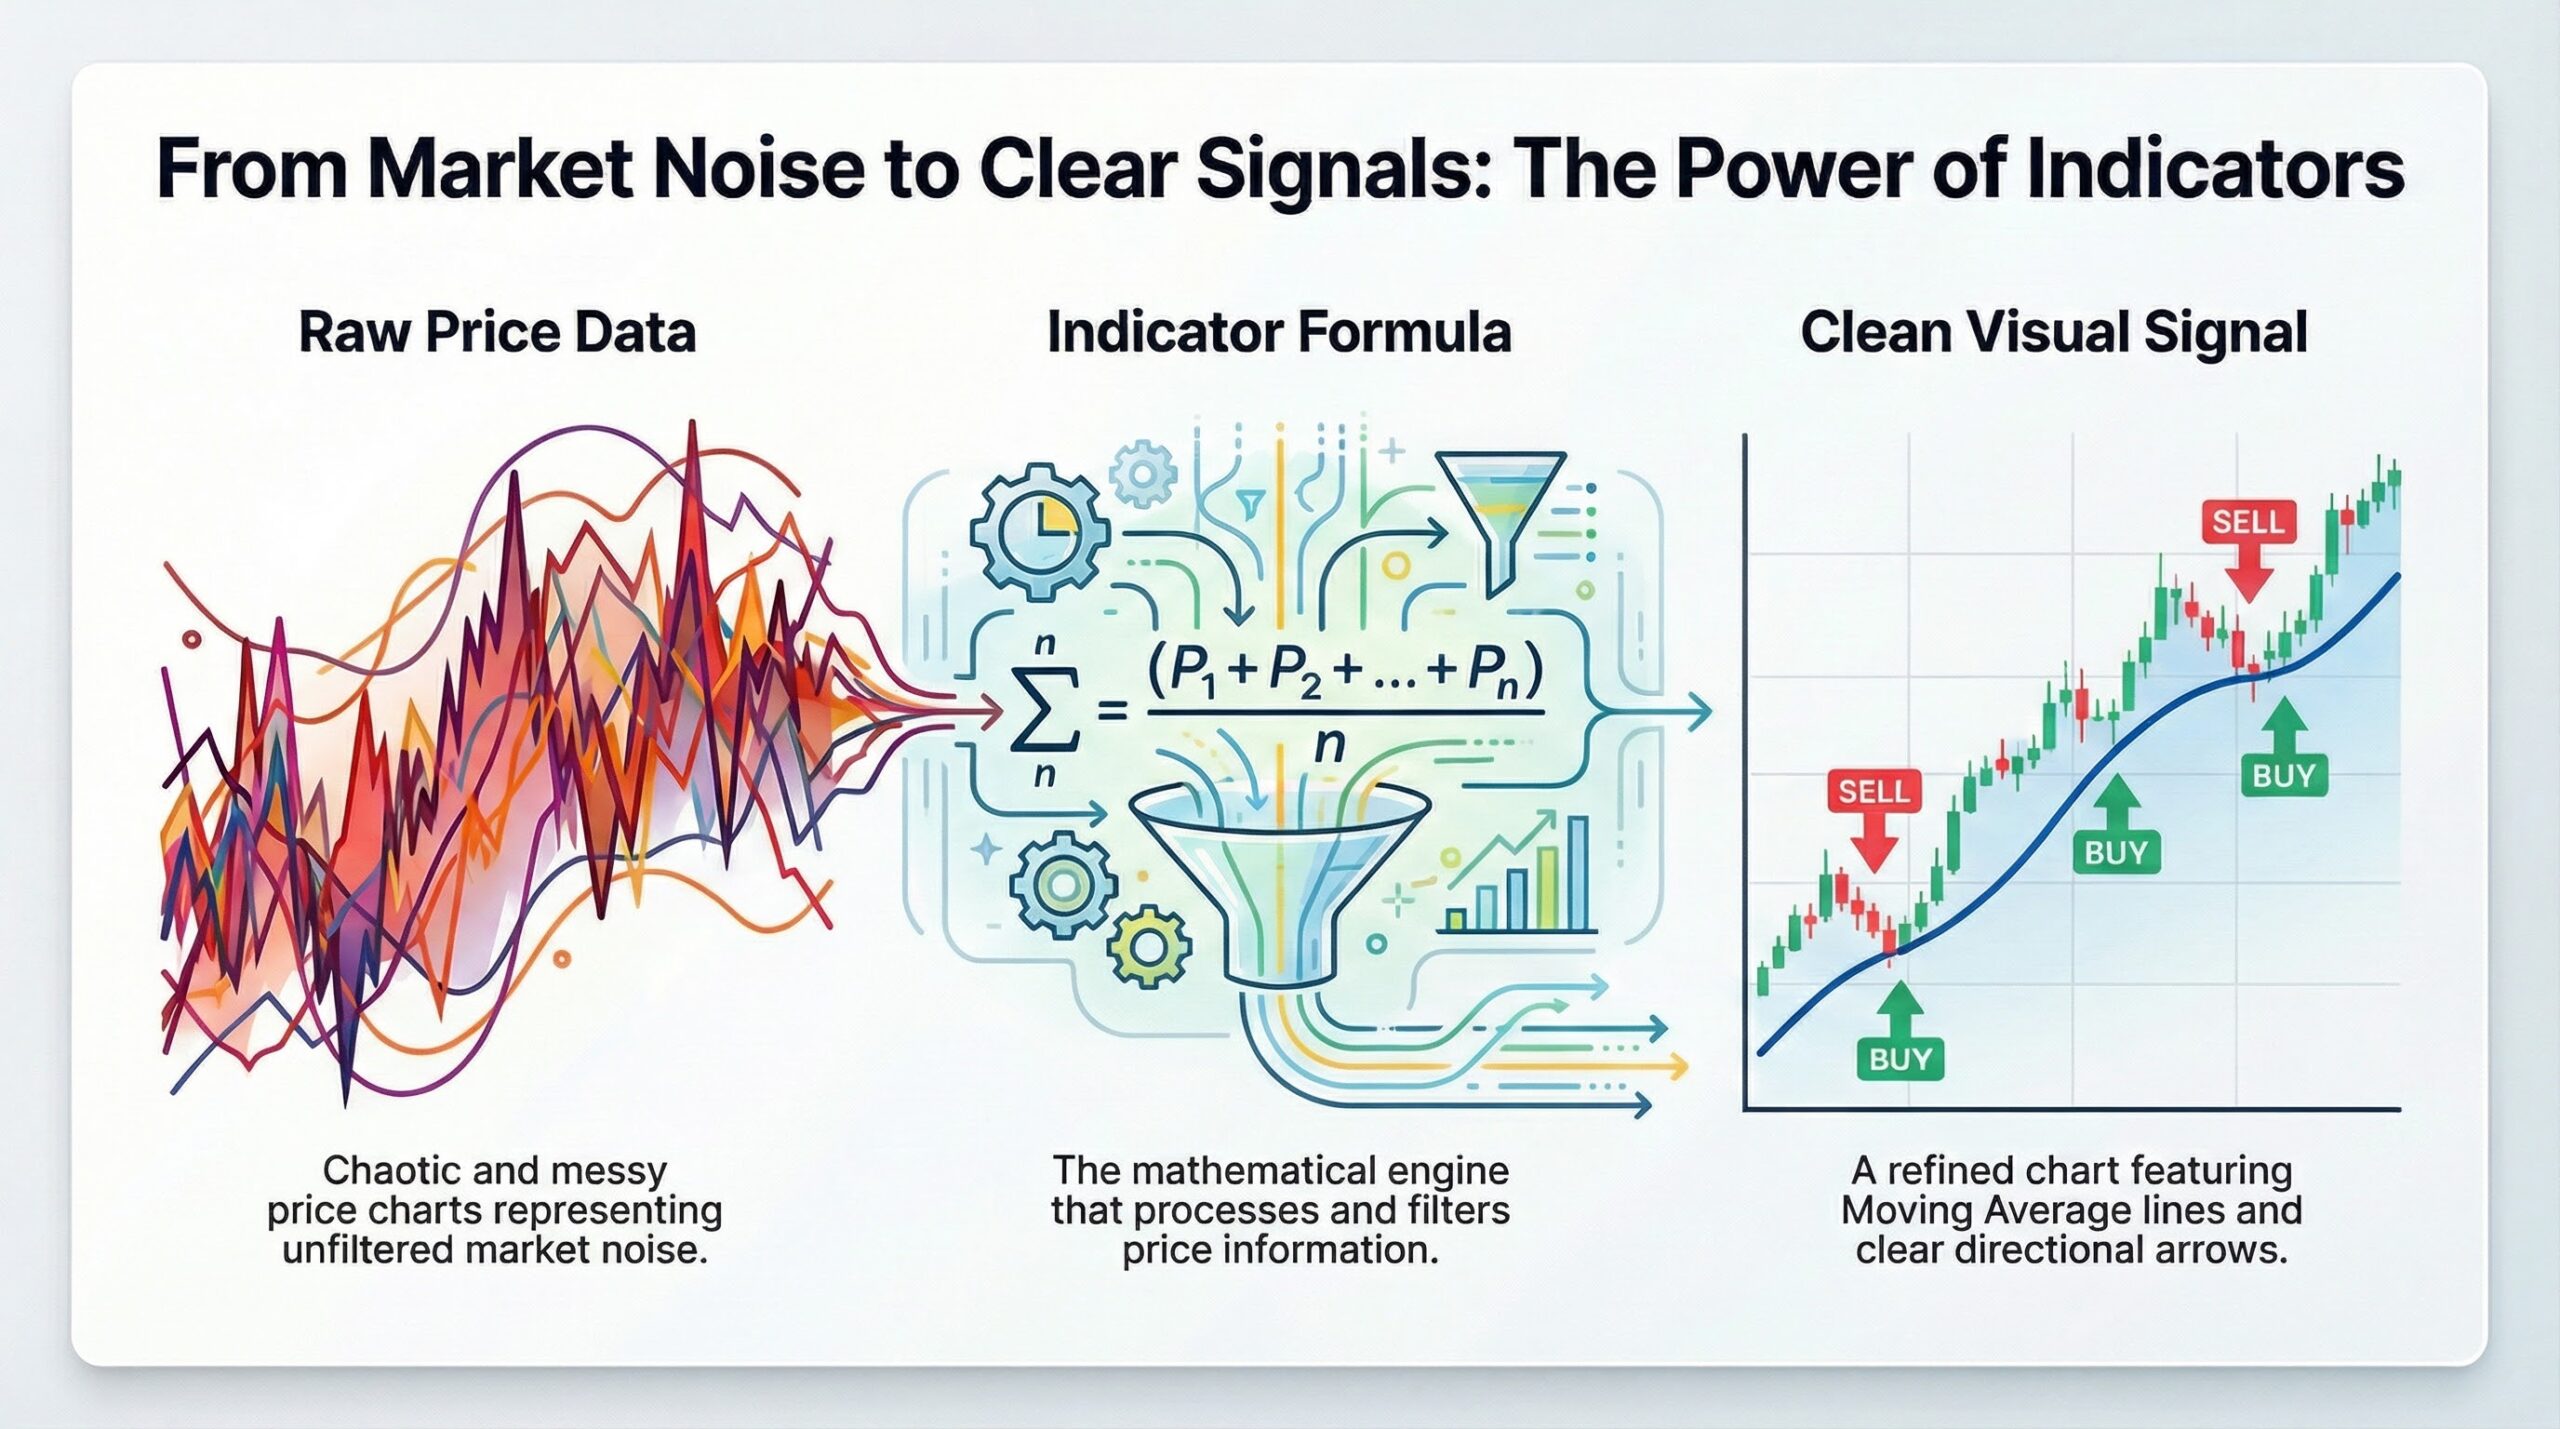
An MT4 indicator is a technical analysis tool that processes historical price data — such as open, close, high, low prices, and sometimes volume — through mathematical formulas to generate visual signals directly on your chart.
Think of indicators as a translation layer. Raw price data is messy and hard to read in real-time. Indicators take that raw data and convert it into clean, visual cues — lines, histograms, bands, arrows, color-coded zones — that help you quickly identify:
- The direction of the current trend
- Whether the market is overbought or oversold
- Potential reversal points
- Volatility expansion or contraction
- Entry and exit timing
Built-in vs. Custom Indicators
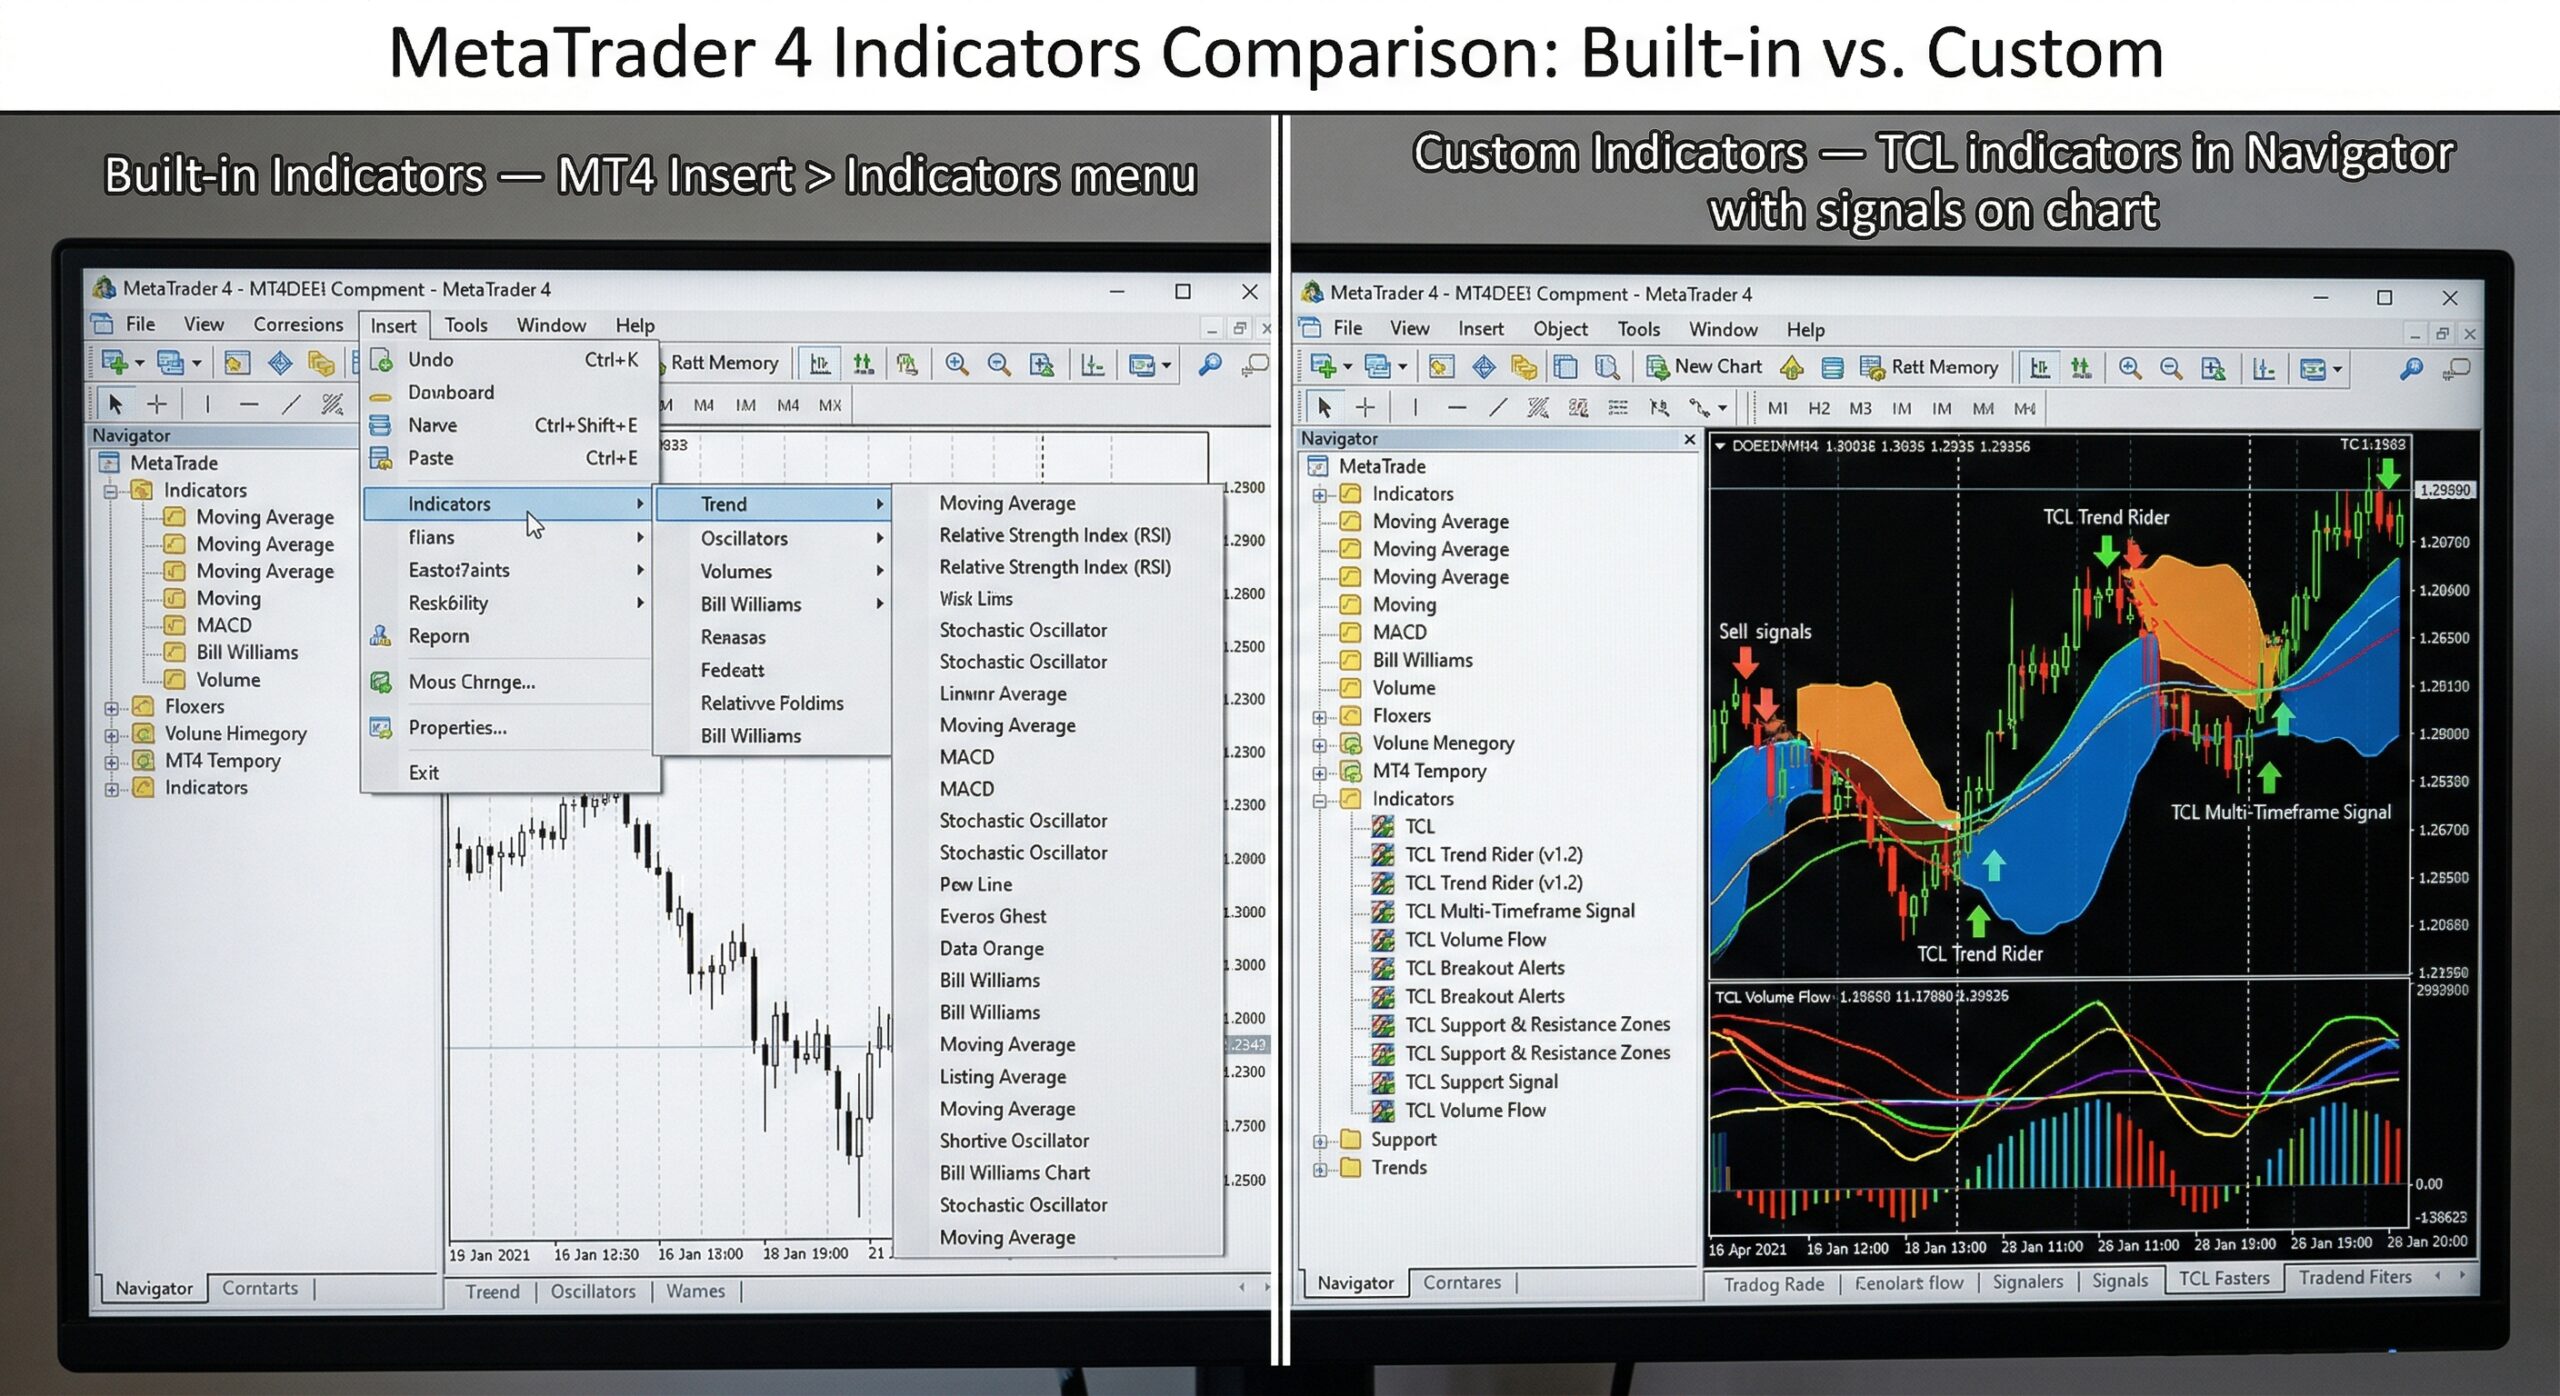
Built-in Indicators: MT4 ships with 30+ pre-installed indicators covering trend, momentum, volume, and volatility analysis. These are available immediately under the “Insert > Indicators” menu.
Custom Indicators: Created by third-party developers (or yourself) using MQL4, MT4’s native programming language. Custom indicators extend the platform’s capabilities far beyond the defaults — adding features like auto-drawn Fibonacci levels, supply and demand zones, multi-timeframe dashboards, and more.
At TradeCodeLabs, every indicator we build is a custom MT4 indicator — engineered to solve specific trading problems that the built-in tools can’t address. Browse our full indicator catalog →
The 4 Categories of MT4 Indicators
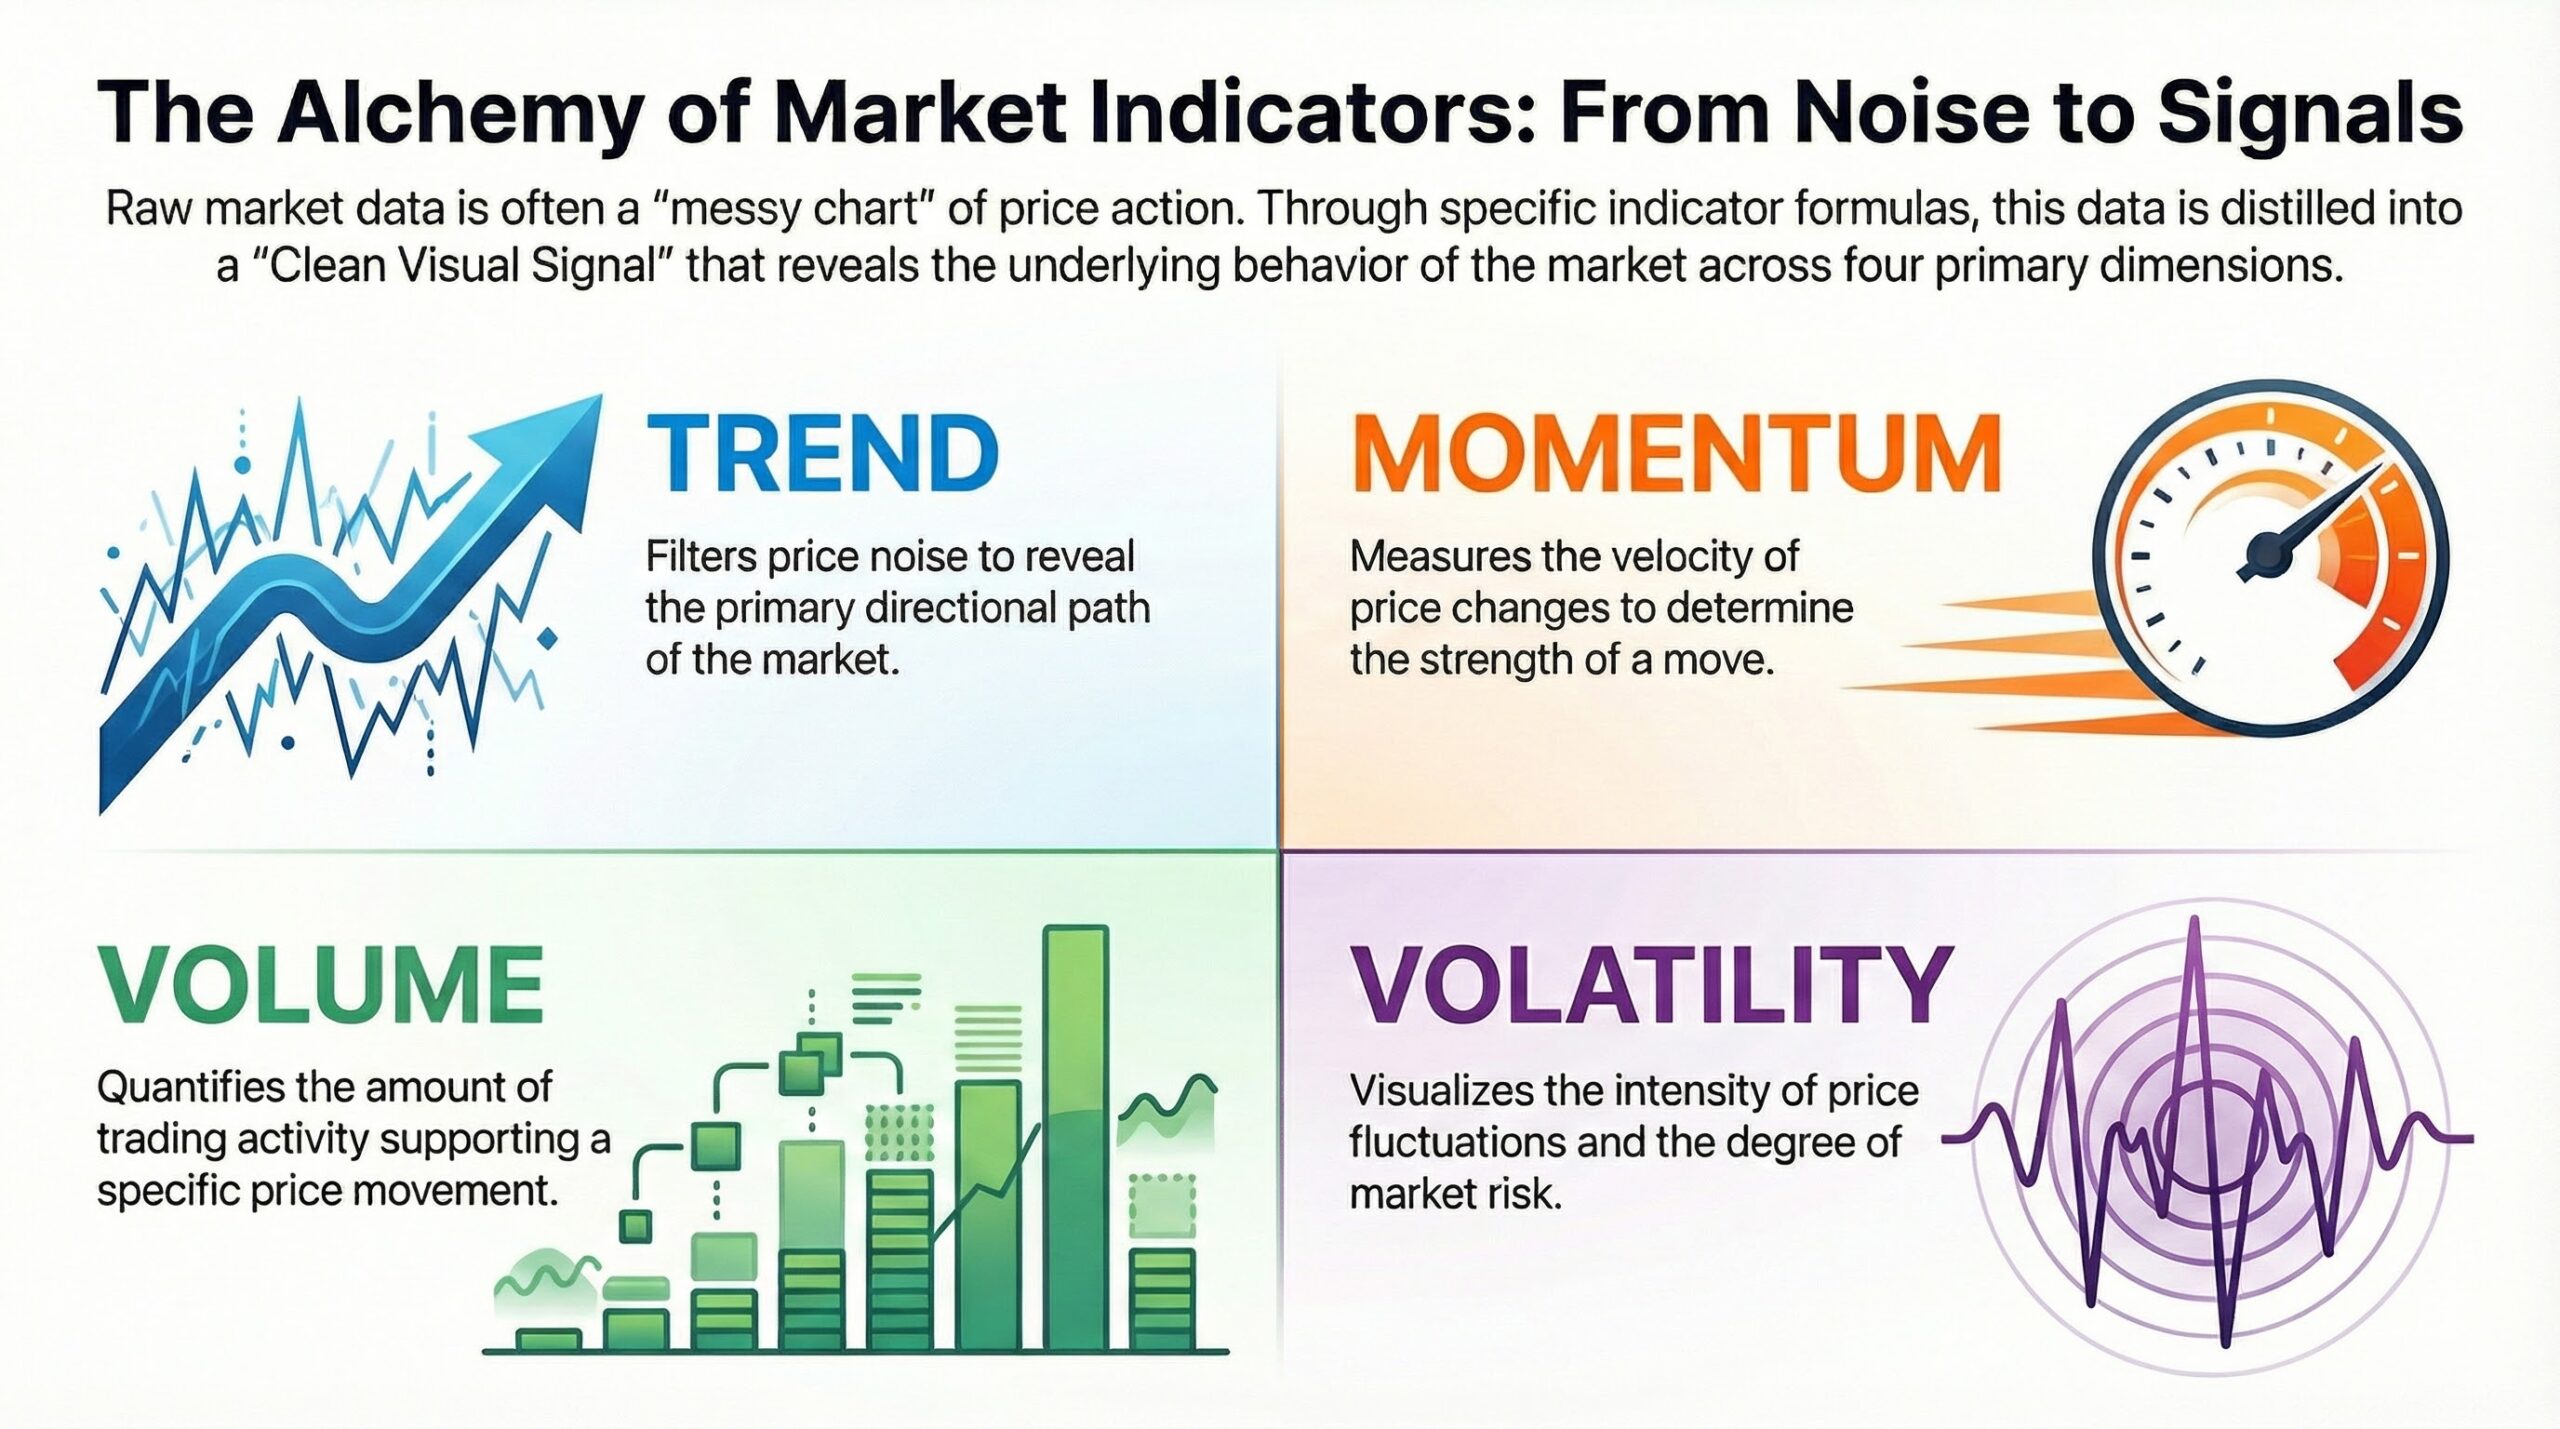
Every technical indicator on MT4 falls into one of four core categories. Understanding these categories is critical because it prevents you from stacking redundant indicators that tell you the same thing.
| Category | What It Measures | Best Used For |
| Trend | Direction of price movement | Identifying and riding trends |
| Momentum | Speed and strength of price changes | Spotting overbought/oversold conditions |
| Volume | Trading activity and participation | Confirming trend strength |
| Volatility | Size of price fluctuations | Setting stop-losses, timing breakouts |
1. Trend Indicators
Trend indicators answer the most fundamental question in trading: “Which direction is the market moving?”
They smooth out price noise and show you whether an asset is in an uptrend, downtrend, or moving sideways. Trading with the trend is the foundation of nearly every profitable strategy — and trend indicators make it visible.
Moving Averages (MA)
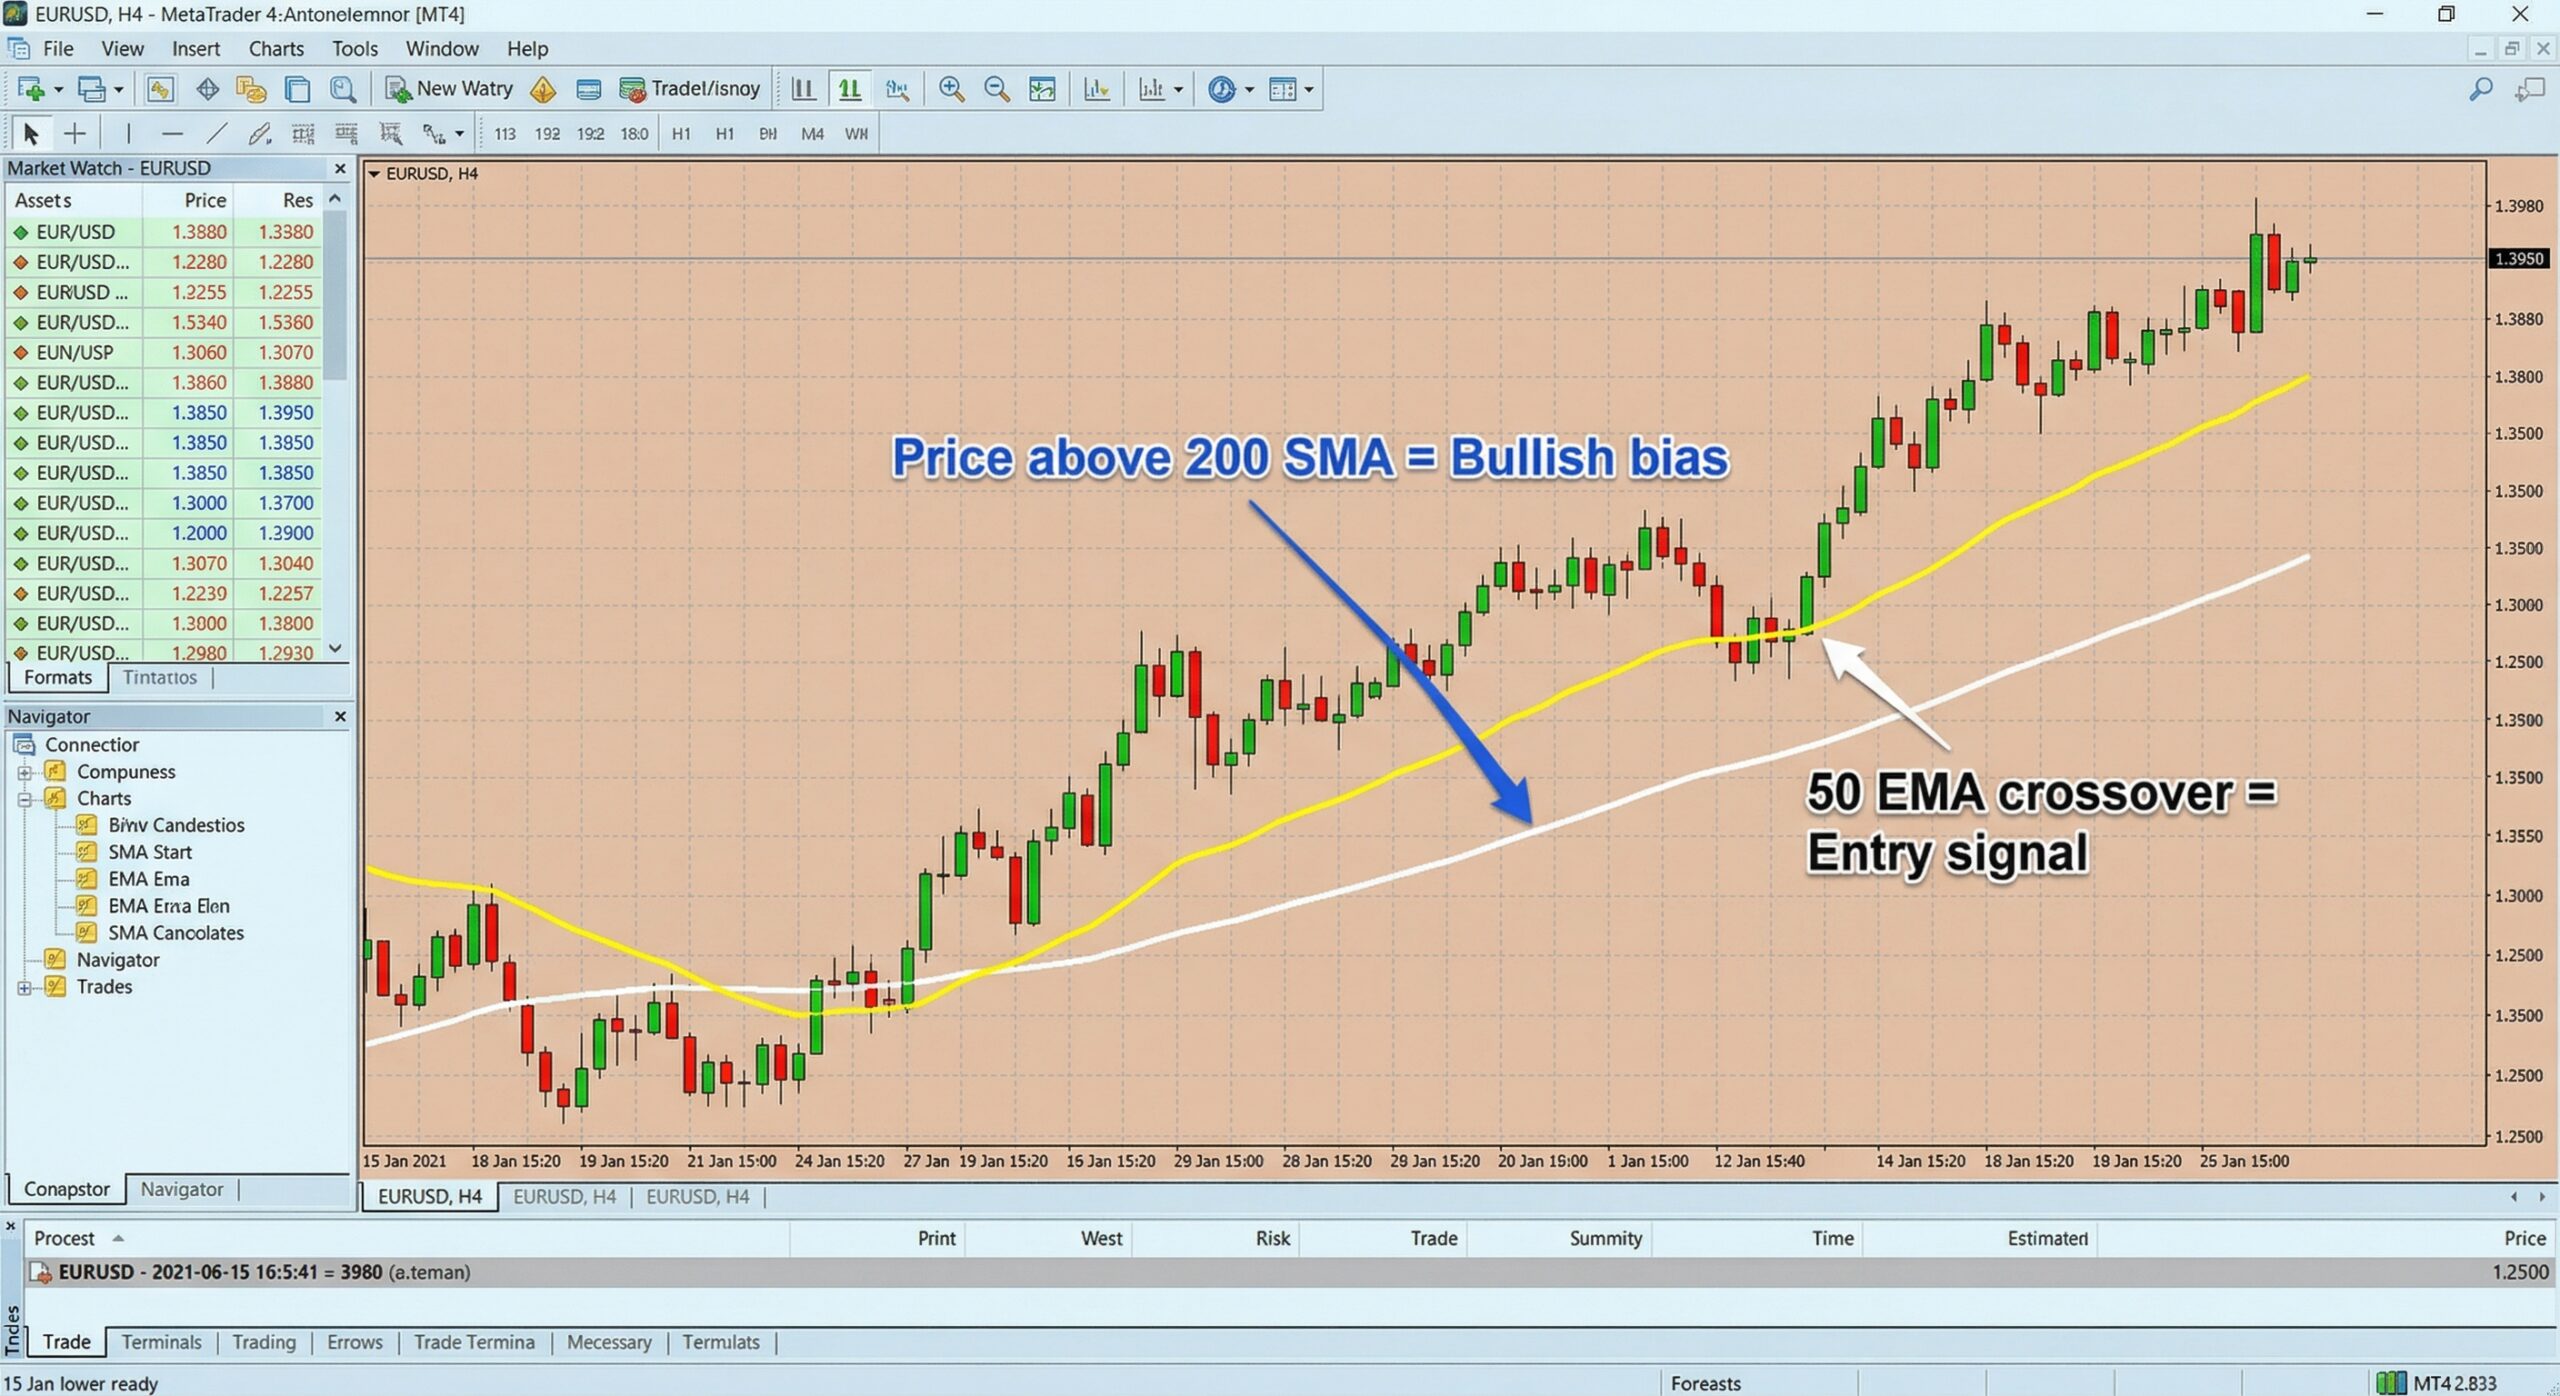
The most widely used indicator in trading. Moving Averages calculate the average price over a set number of periods and plot it as a smooth line on the chart. When price is above the MA, the trend is up. When below, it’s down.
There are two main types:
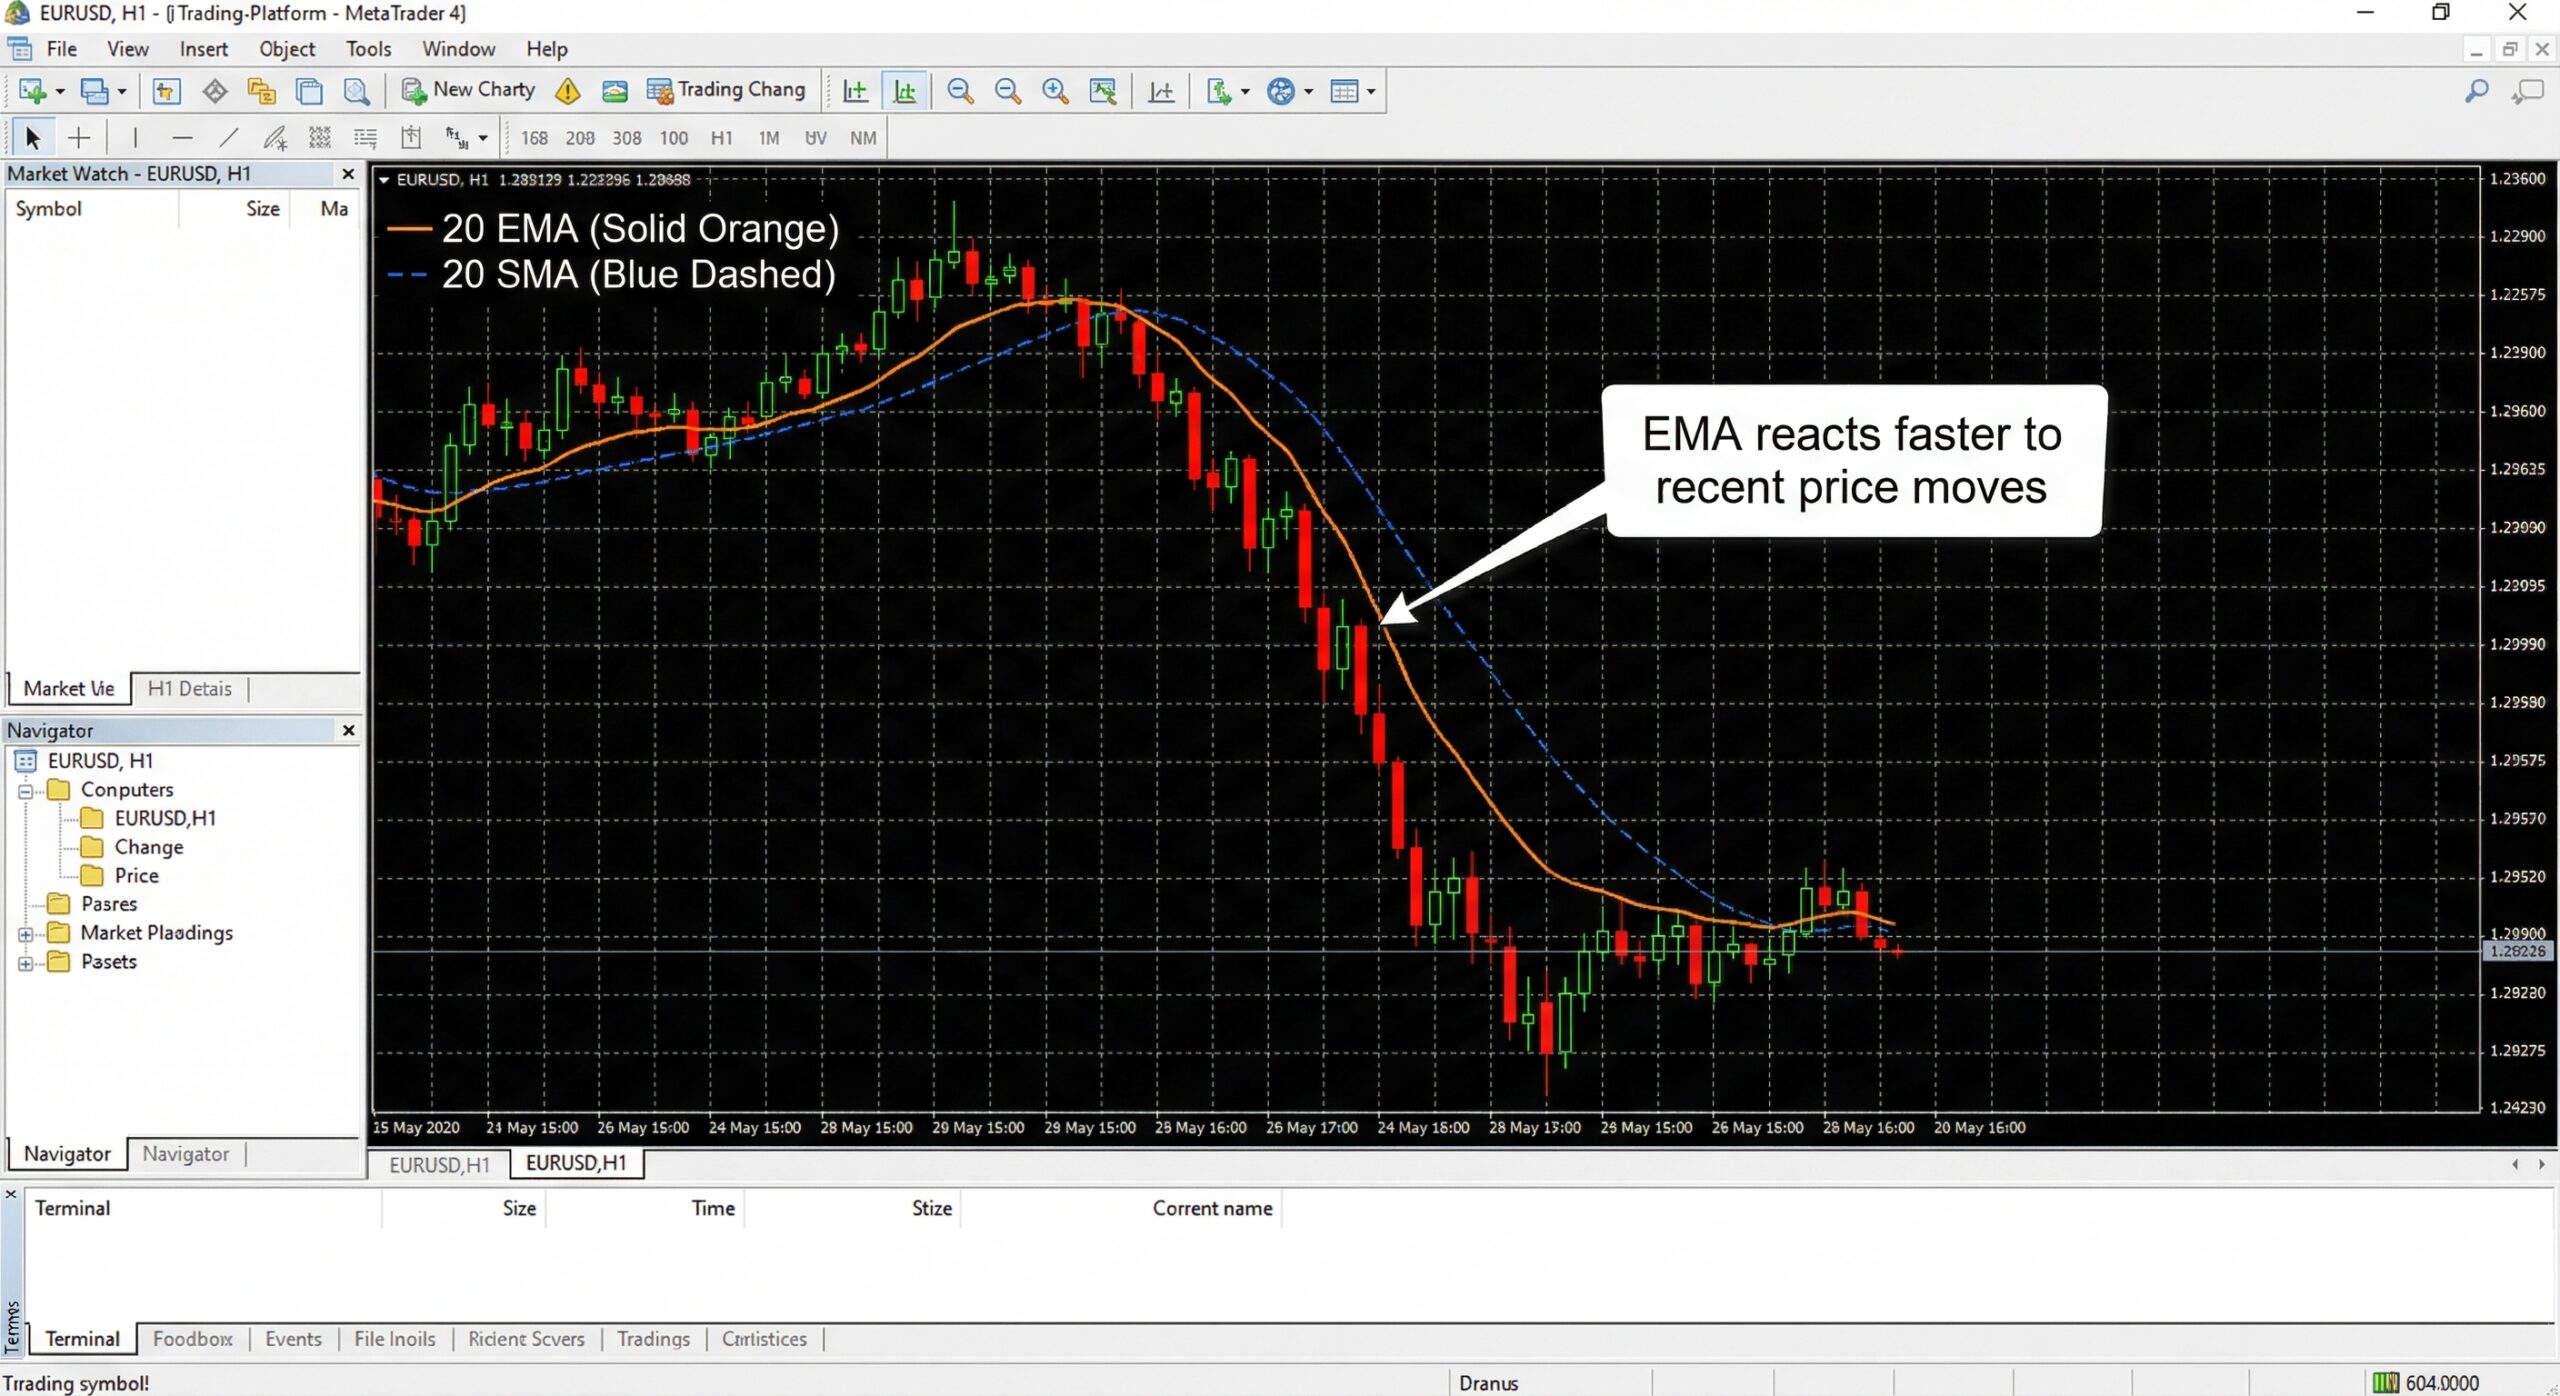
- Simple Moving Average (SMA): Gives equal weight to all prices in the period. Best for longer-term trend identification.
- Exponential Moving Average (EMA): Gives more weight to recent prices, making it more responsive. Preferred by shorter-term traders.
Common settings: 20 EMA (short-term), 50 SMA (medium-term), 200 SMA (long-term trend filter).
MACD (Moving Average Convergence Divergence)
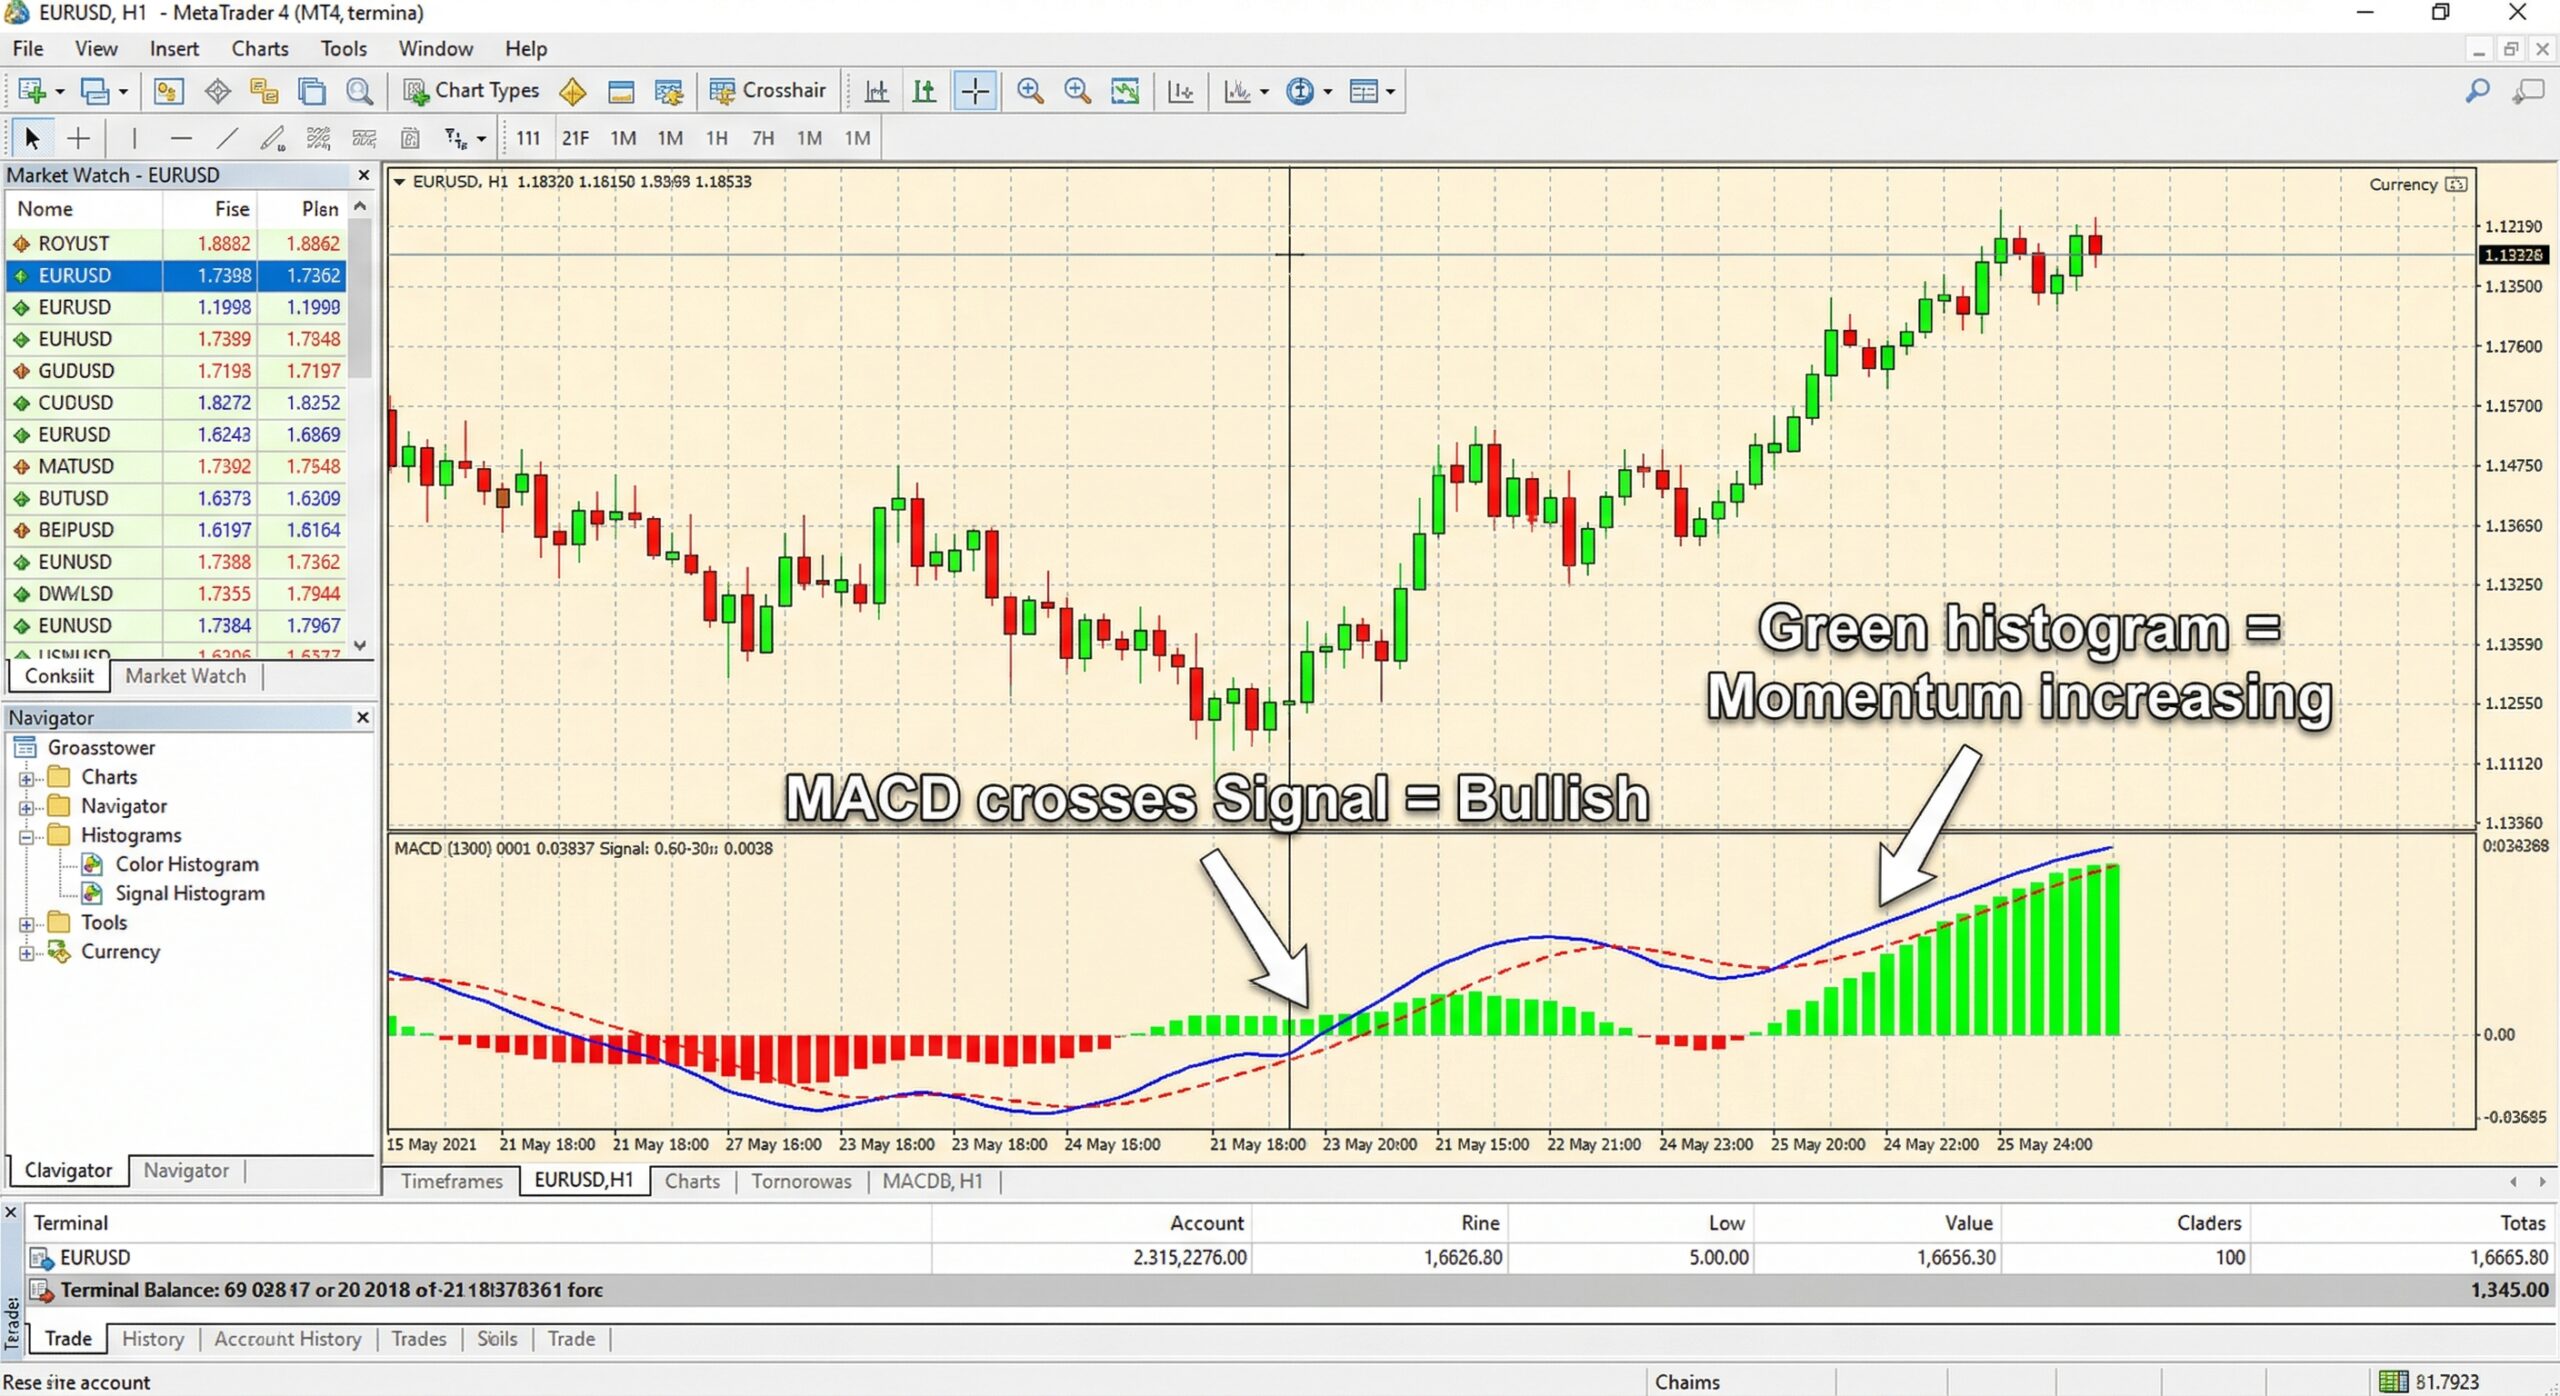
The MACD shows the relationship between two EMAs (typically the 12 and 26 period). It generates signals through crossovers, histogram changes, and divergences. It’s both a trend and momentum indicator — one of the most versatile tools on MT4.
Default settings: 12, 26, 9.
Parabolic SAR
Plots dots above or below price to indicate trend direction. When dots are below the candles, the trend is bullish. When above, bearish. Also useful for trailing stop-loss placement. Learn more about Parabolic SAR →
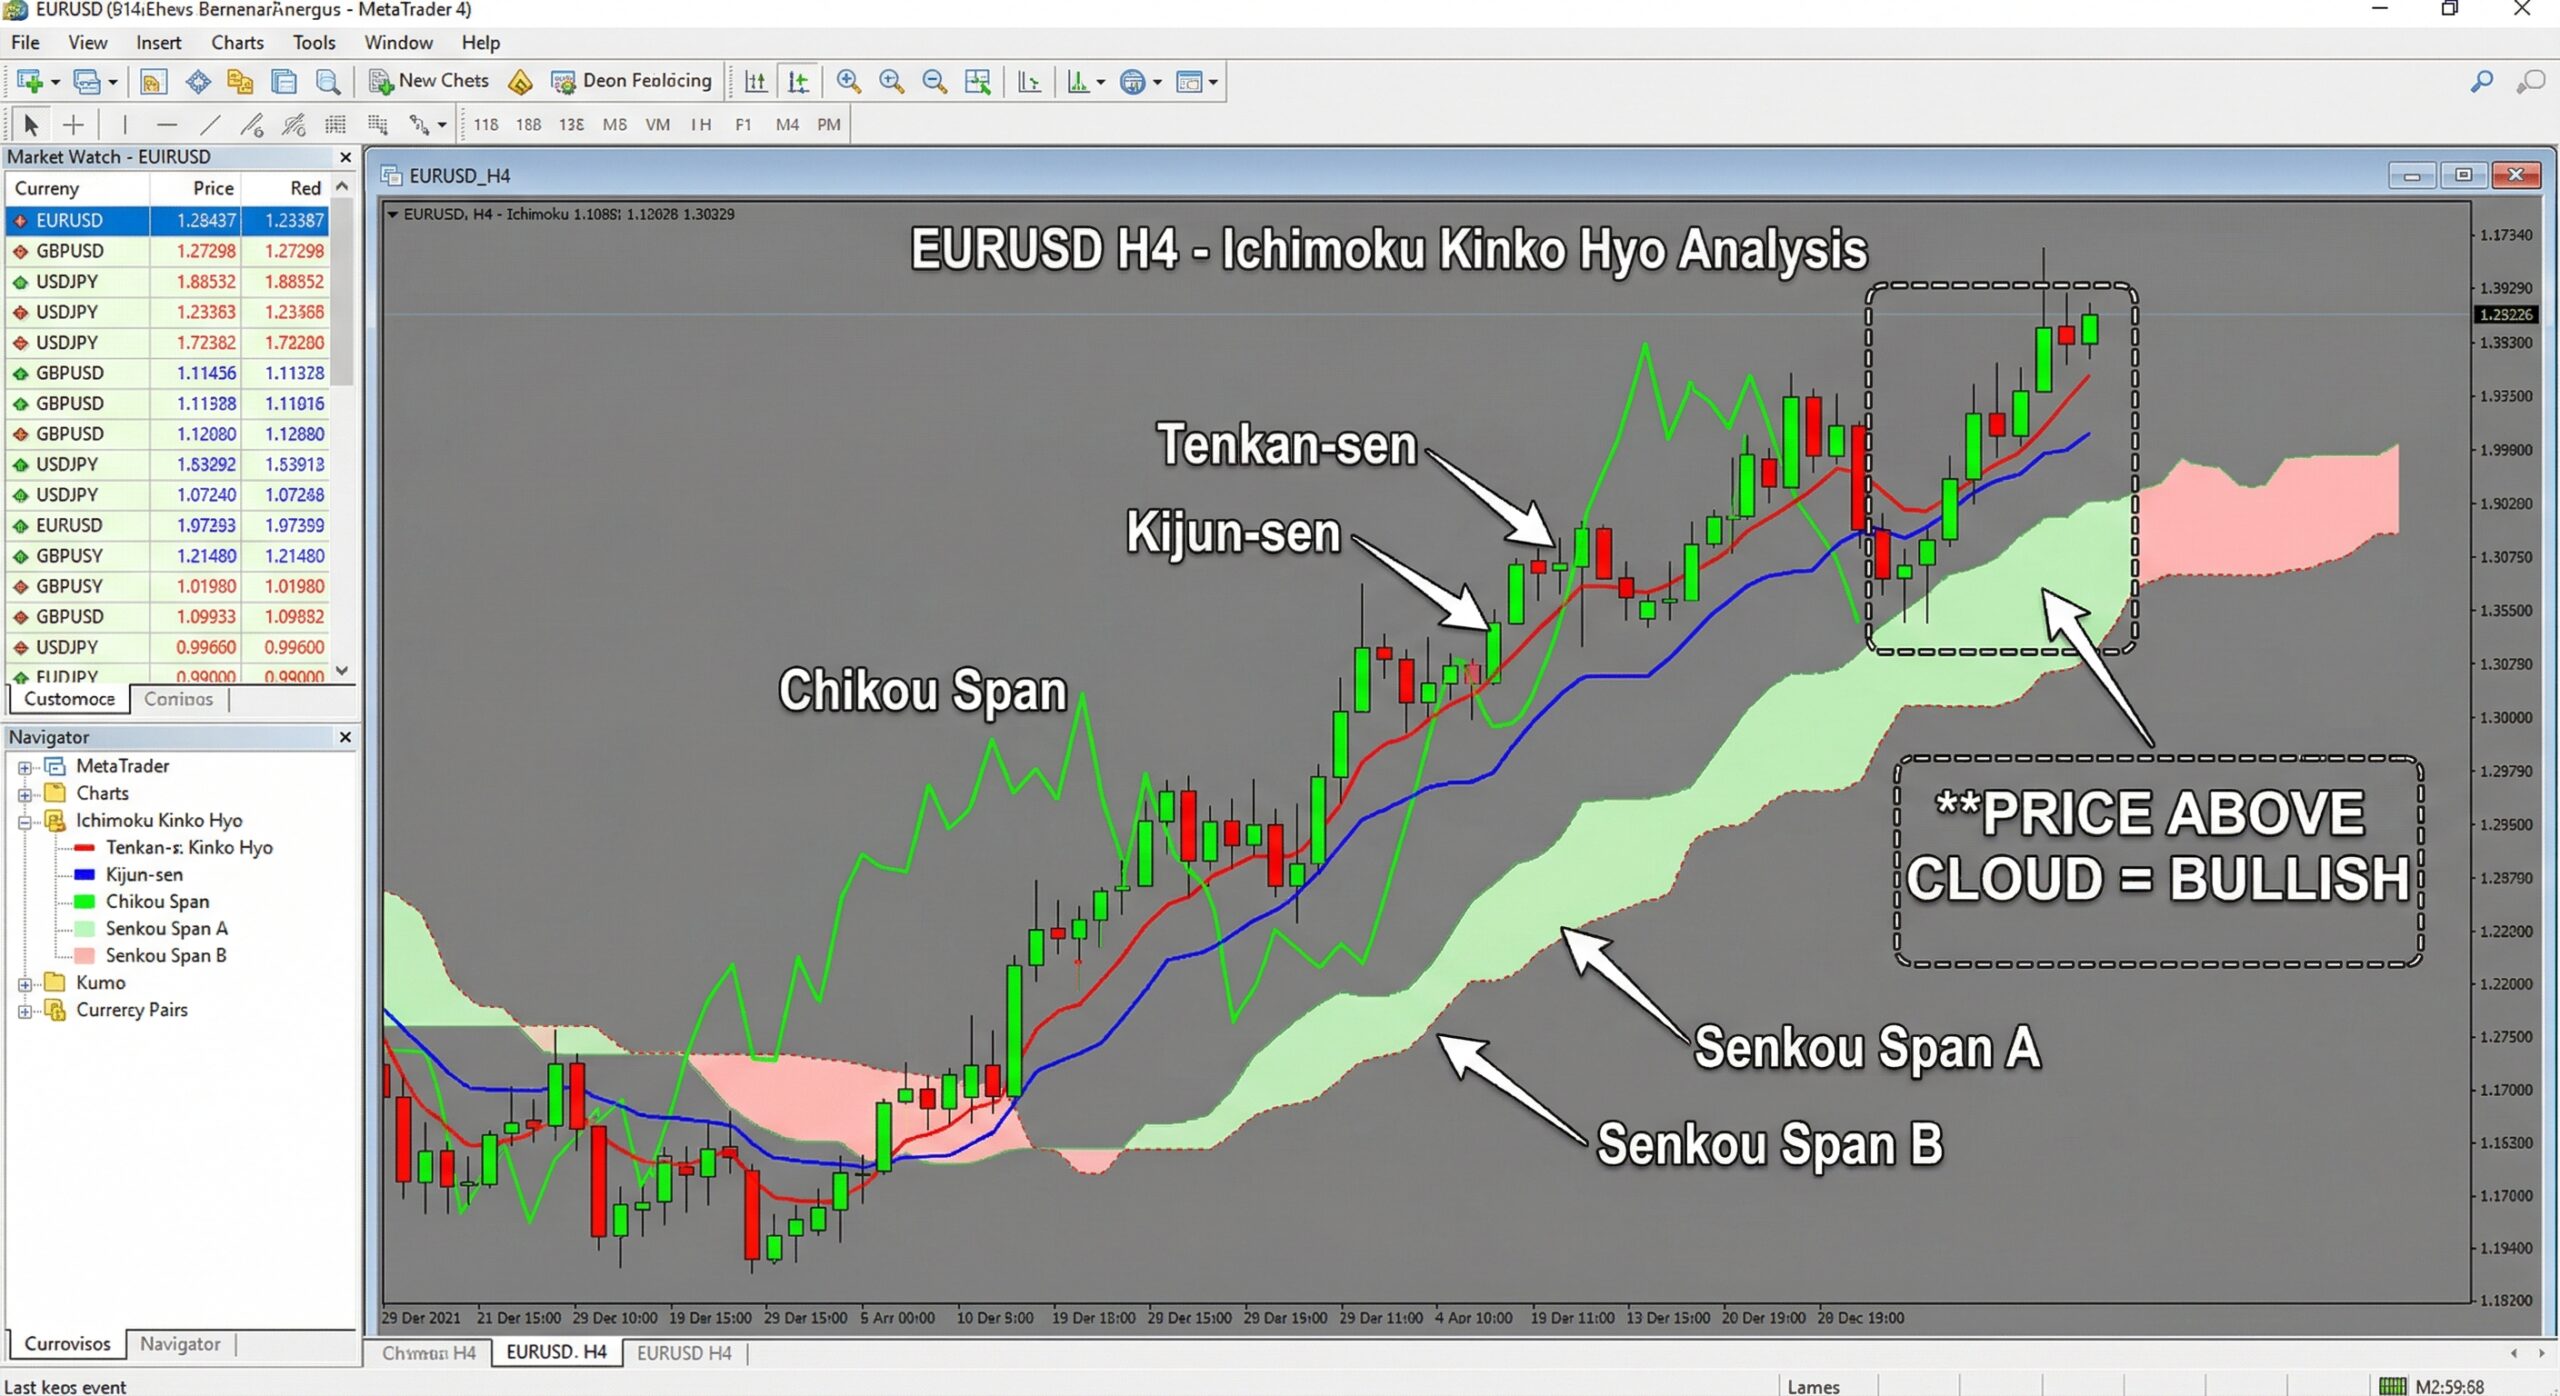
Ichimoku Cloud
A comprehensive system that shows trend direction, momentum, and support and resistance all in one indicator. The “cloud” (Kumo) provides dynamic S/R zones. While complex at first glance, Ichimoku is extremely powerful for experienced traders.
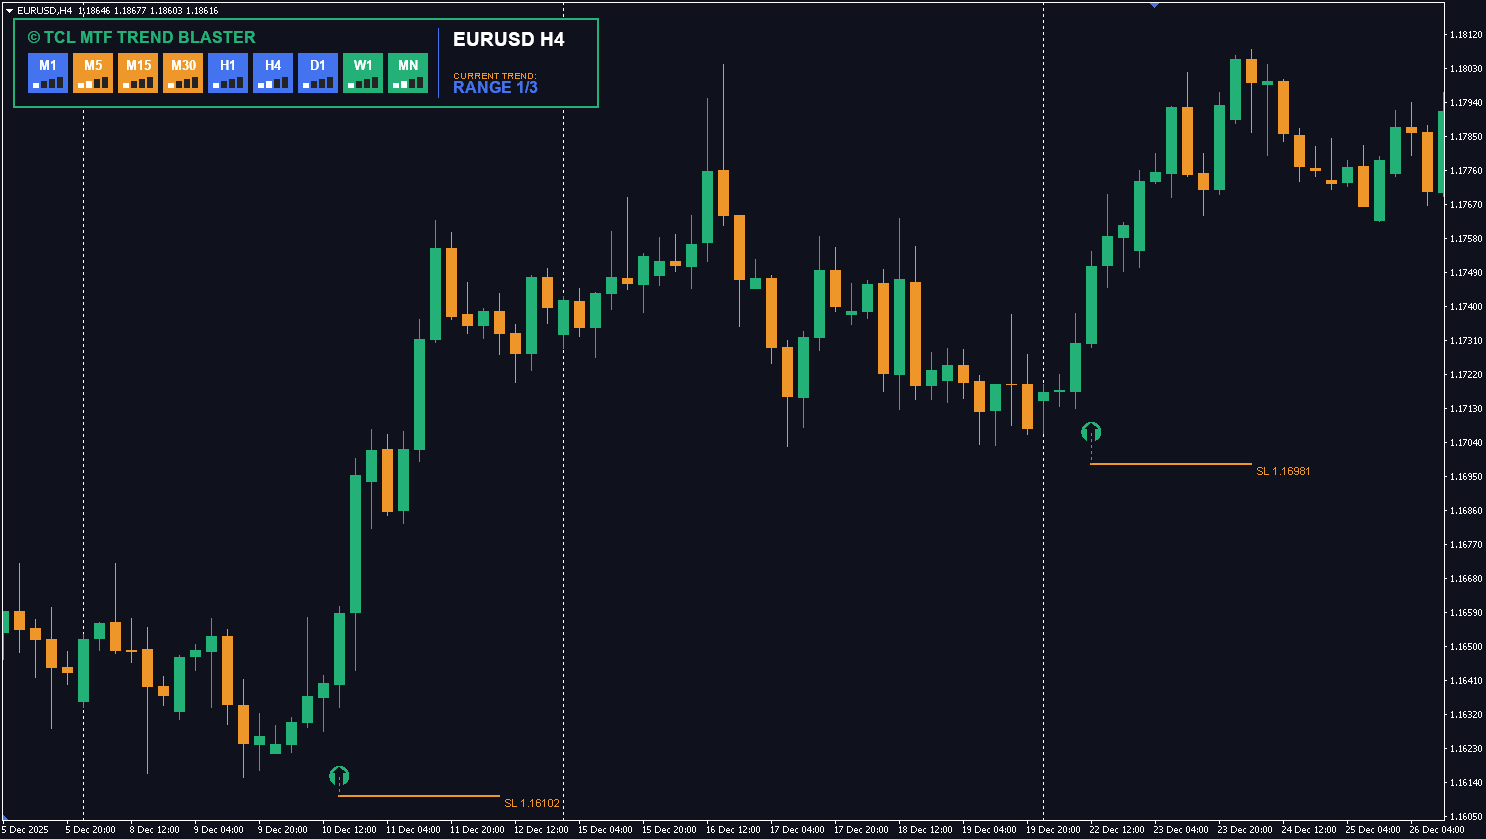
Pro Tip: At TradeCodeLabs, our TCL MTF TREND BLASTER combines multi-timeframe trend analysis into a single, easy-to-read dashboard — so you can see the trend across M5, M15, H1, H4, and D1 without switching charts.
2. Momentum Indicators (Oscillators)
Momentum indicators measure how fast price is moving — not where it’s going, but how hard it’s pushing in that direction.
They’re called “oscillators” because they oscillate between fixed values (usually 0–100), making them ideal for spotting when a market is overextended and due for a reversal.
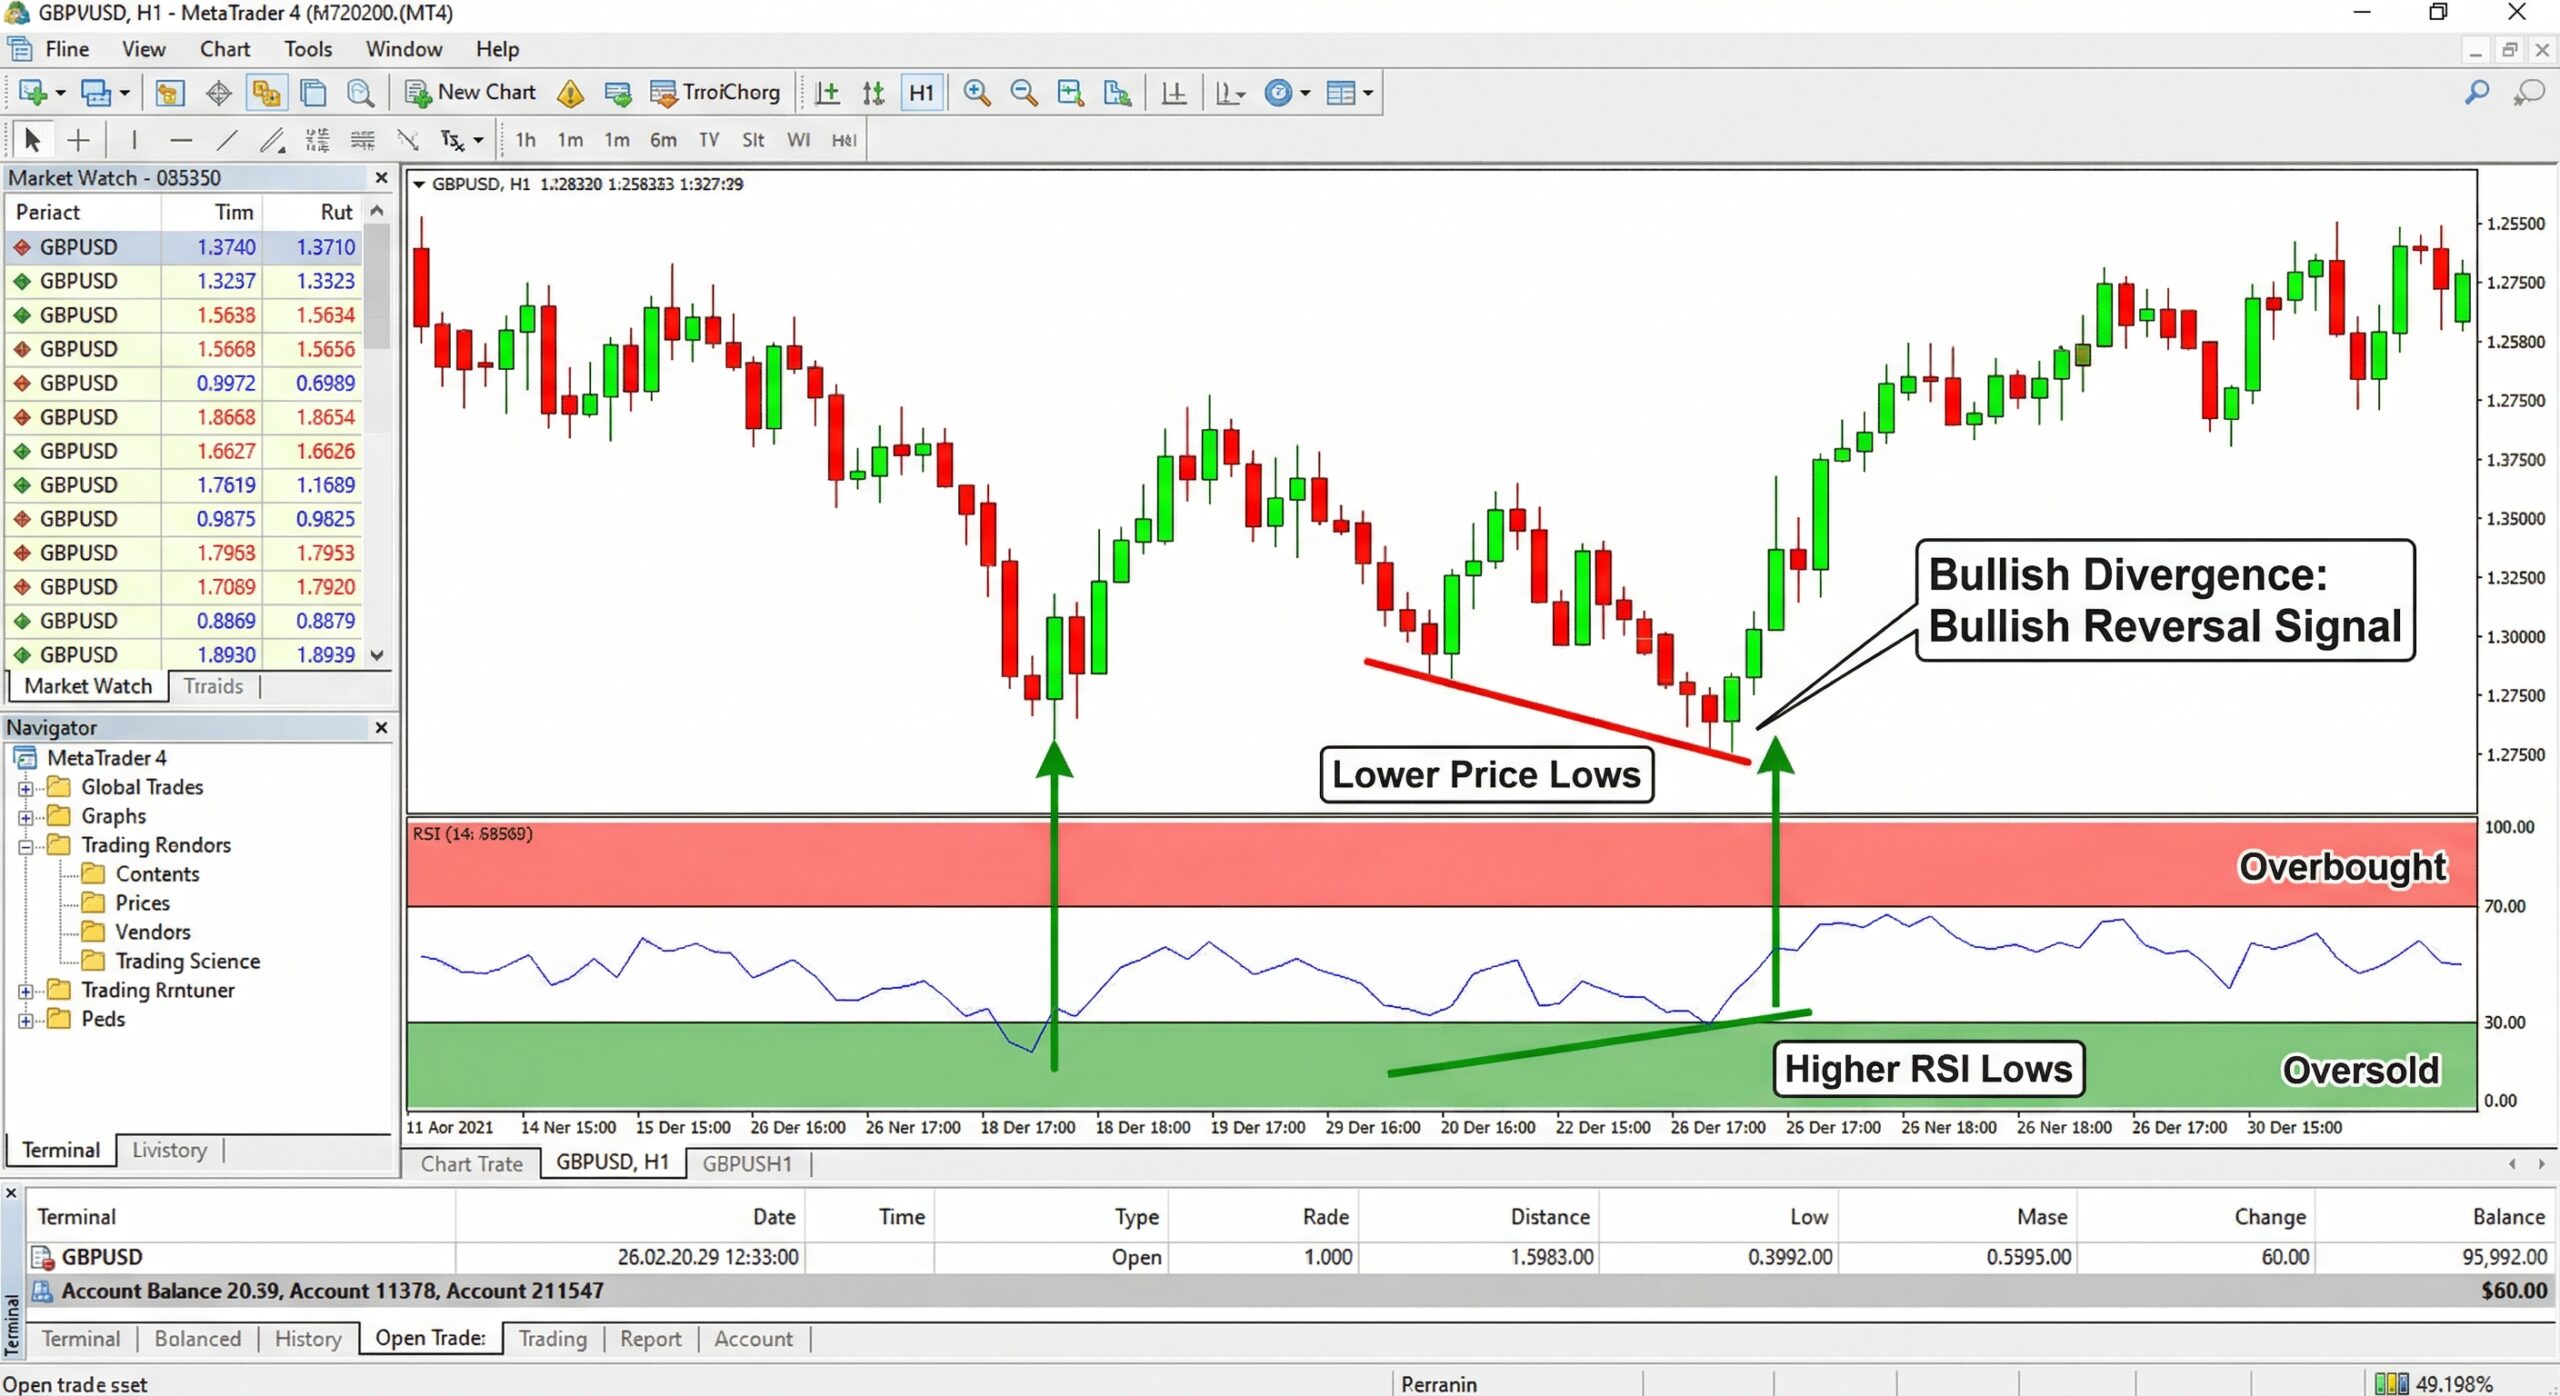
Relative Strength Index (RSI)
The RSI measures the speed and magnitude of recent price changes on a scale of 0 to 100. Readings above 70 signal overbought conditions (potential sell). Readings below 30 signal oversold conditions (potential buy).
Default setting: 14-period RSI.
The RSI is also powerful for spotting divergences — when price makes a new high but RSI doesn’t, it often signals weakening momentum and an impending reversal.
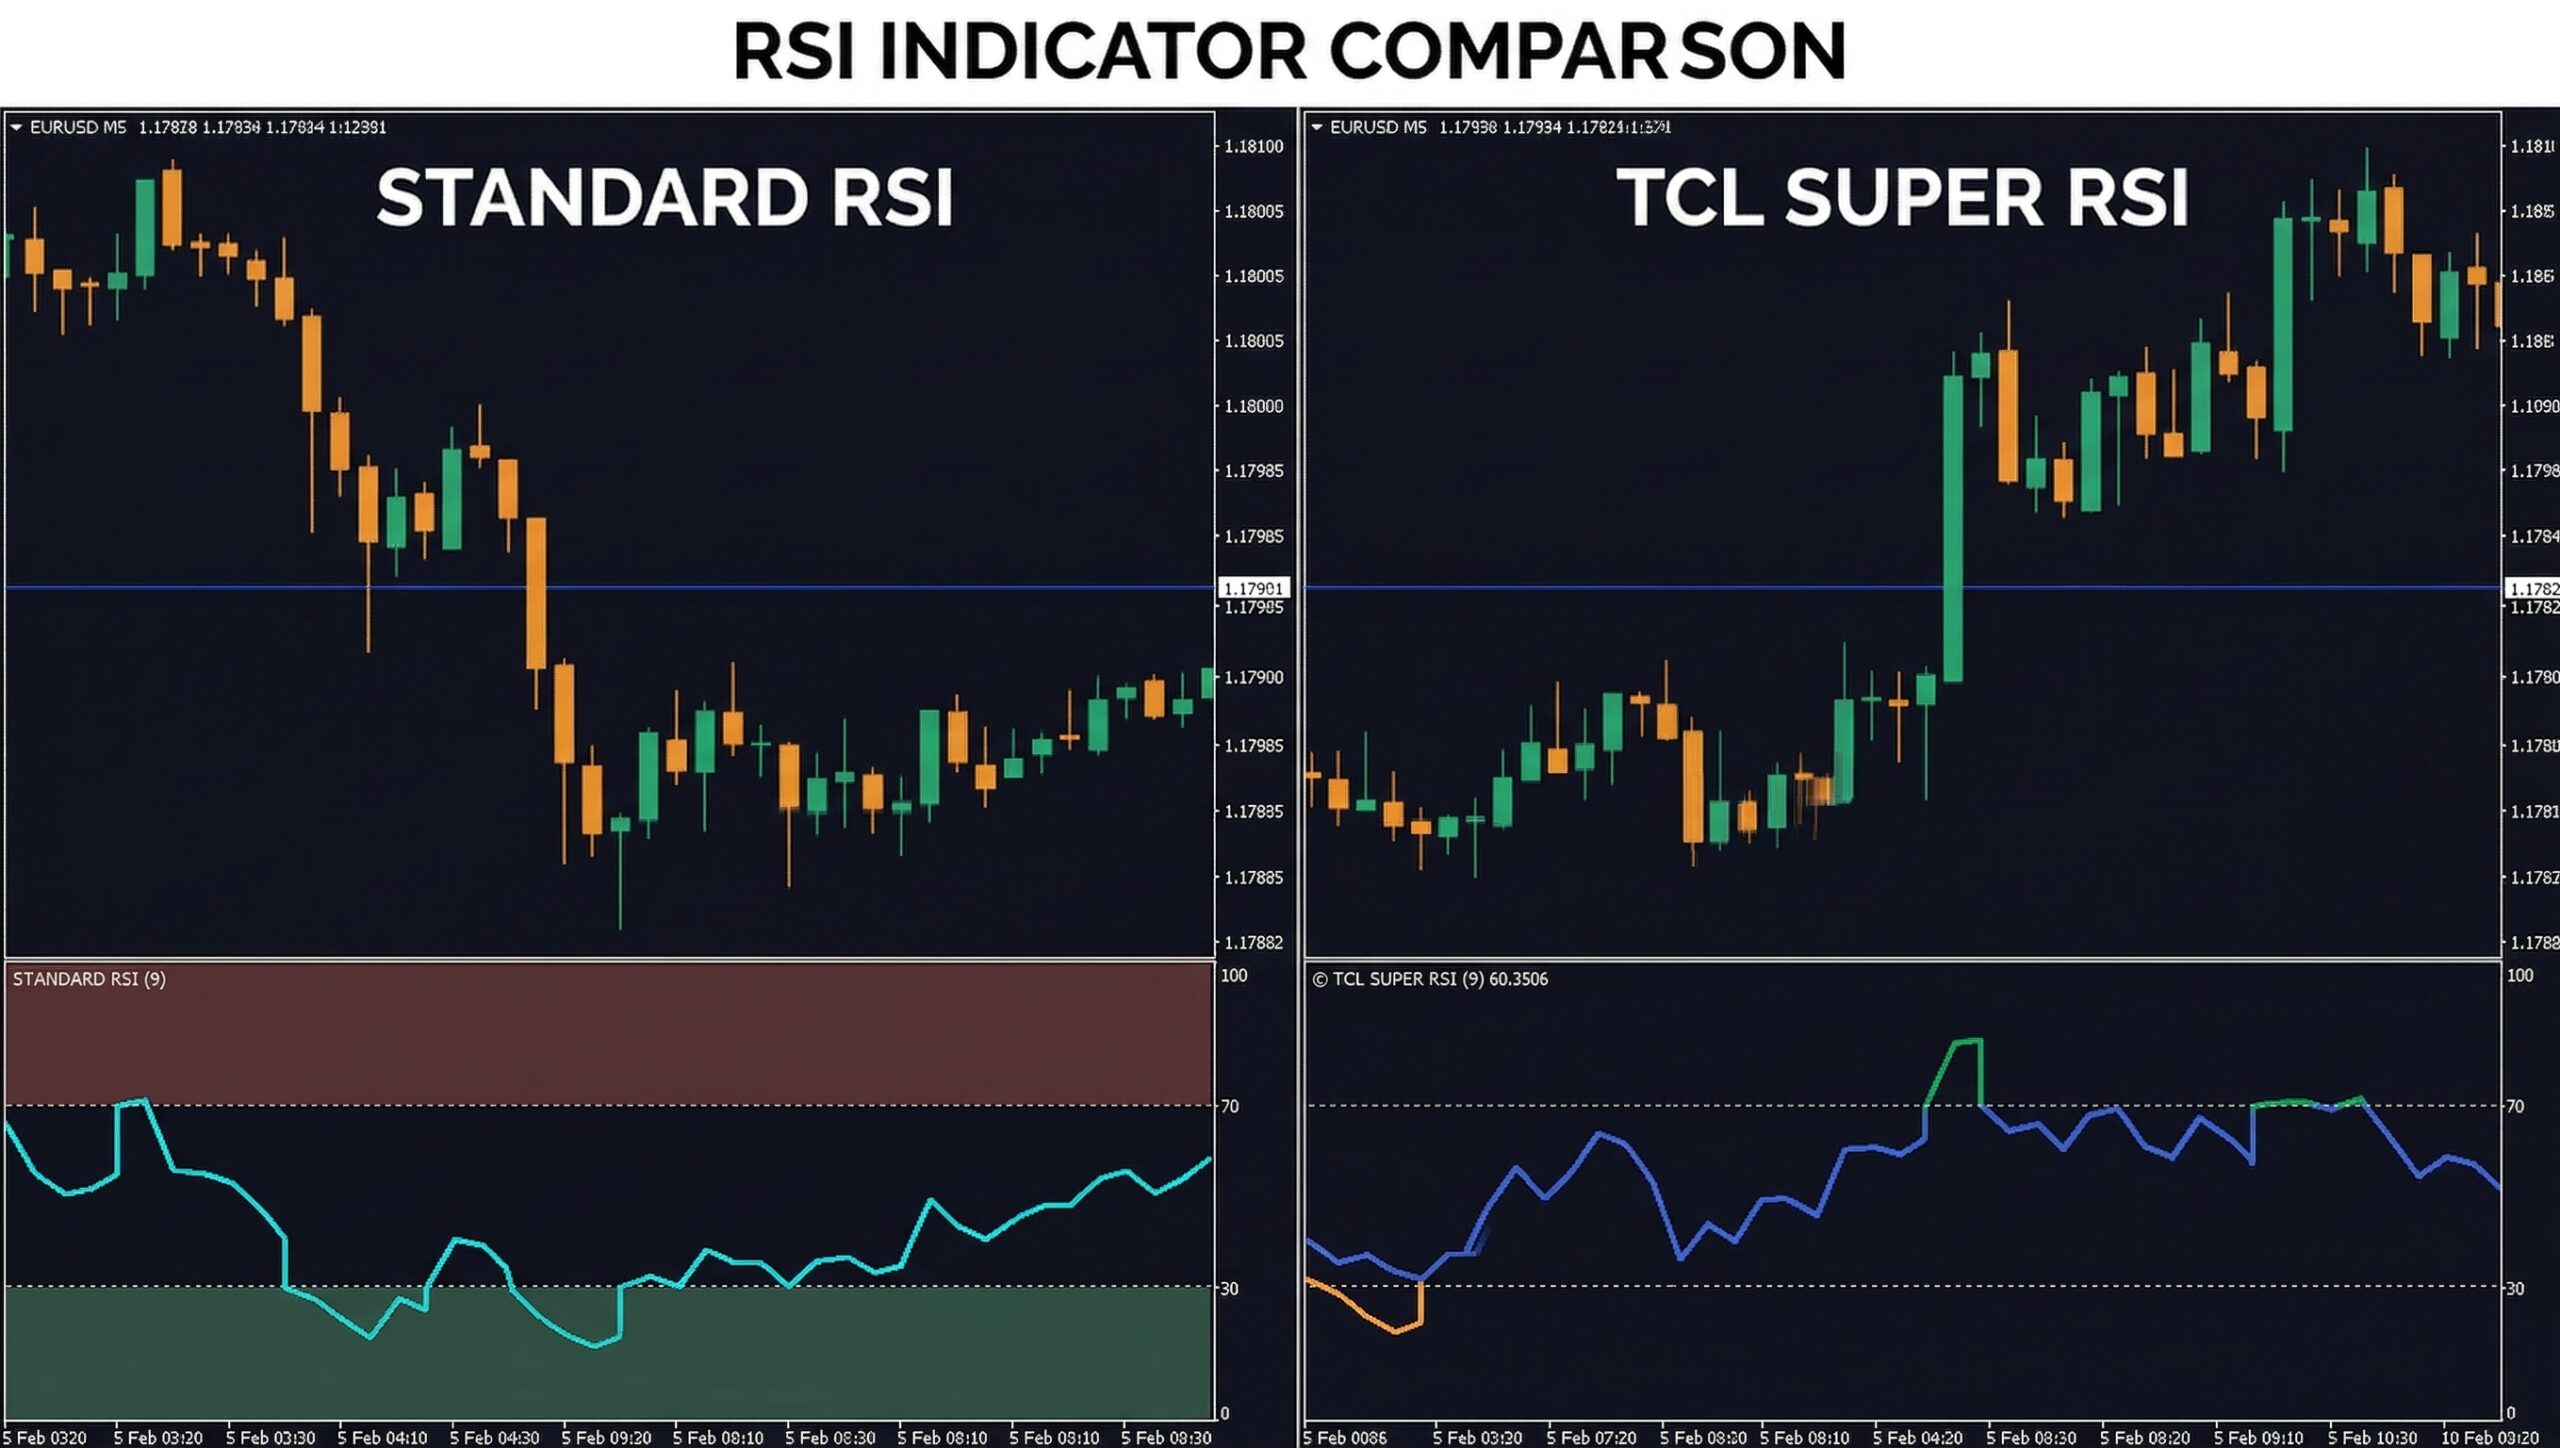
At TradeCodeLabs, our TCL SUPER RSI enhances the standard RSI with dynamic overbought/oversold zones, trend-filtered signals, and on-chart arrows — eliminating the guesswork from RSI-based trading.
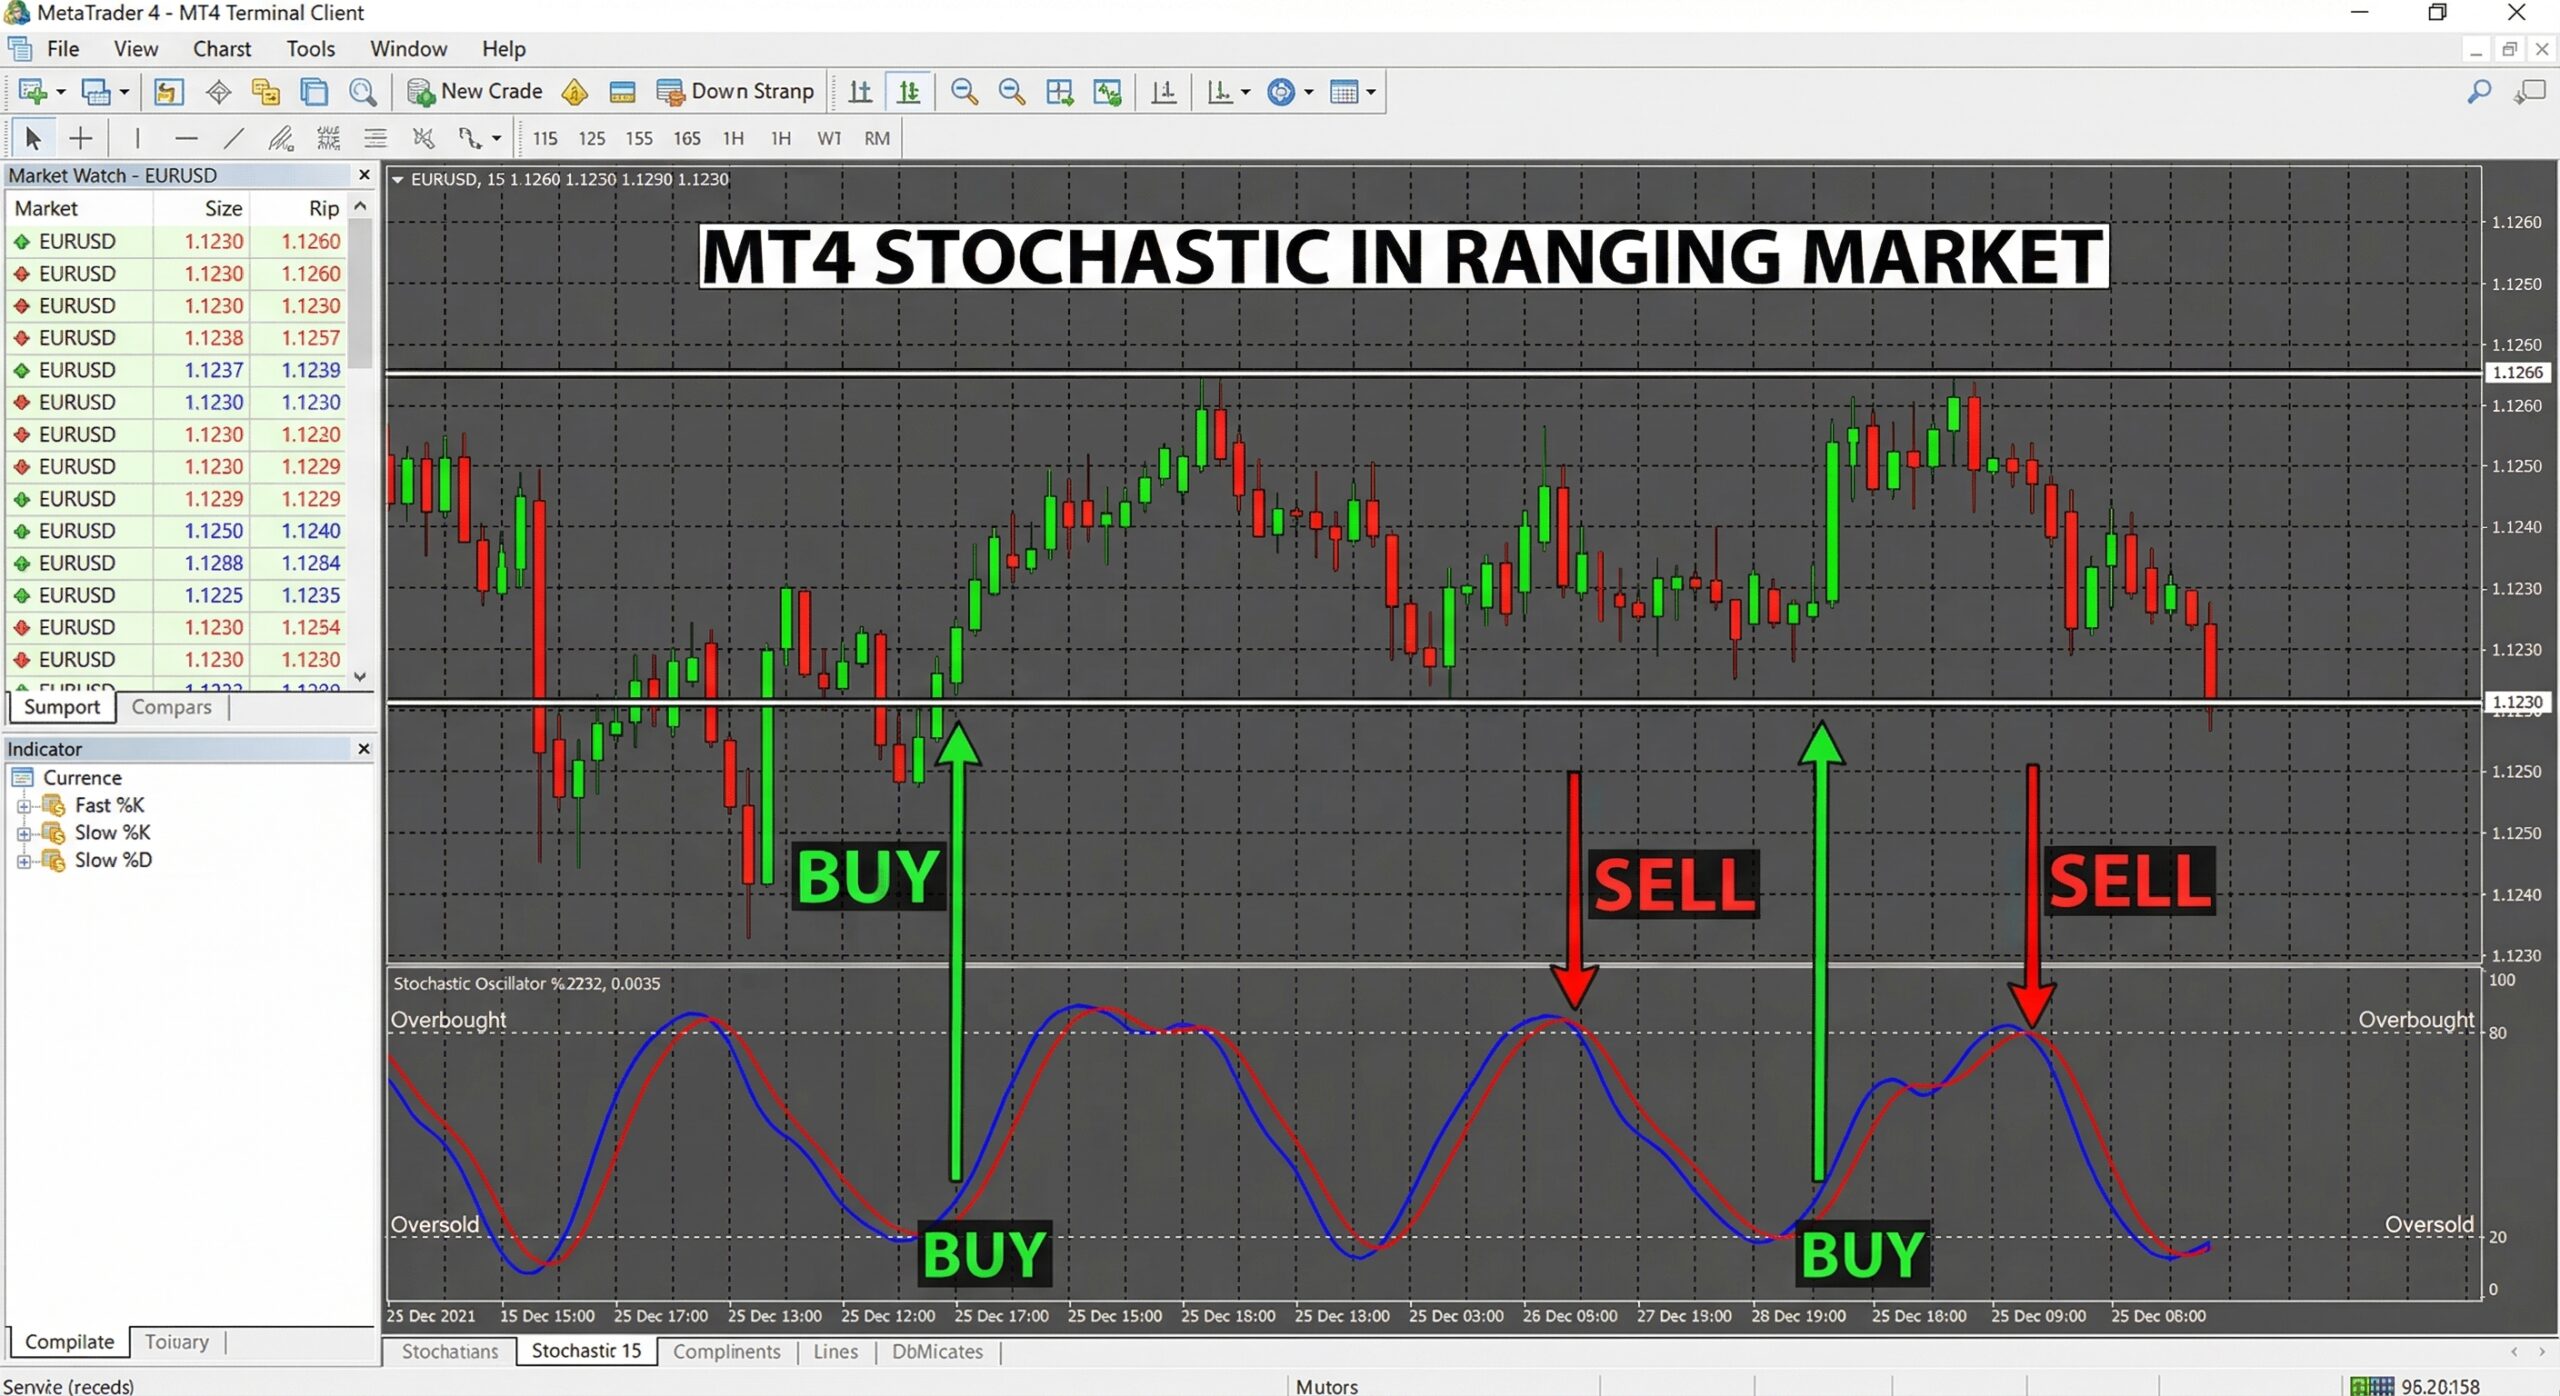
Stochastic Oscillator
The Stochastic Oscillator compares the closing price to the price range over a set period. It oscillates between 0 and 100, with readings above 80 indicating overbought and below 20 indicating oversold. Particularly effective in ranging markets.
Williams %R
Similar to the Stochastic but inverted. Values range from -100 to 0, with readings above -20 indicating overbought and below -80 indicating oversold. Some traders prefer its sensitivity for short-term signals. Learn more →
CCI (Commodity Channel Index)
Measures the deviation of price from its statistical mean. Readings above +100 suggest an overbought condition or the start of a strong uptrend, while readings below -100 may indicate an oversold condition or a strong downtrend.
3. Volume Indicators
Volume indicators analyze trading activity to confirm whether a price movement has genuine participation behind it — or if it’s a weak move likely to reverse.
Important note: In spot forex, true volume data isn’t available through MT4. Instead, MT4 uses “tick volume” — the number of price changes within a period. Research has shown a strong correlation between tick volume and actual traded volume, making it a reliable proxy.
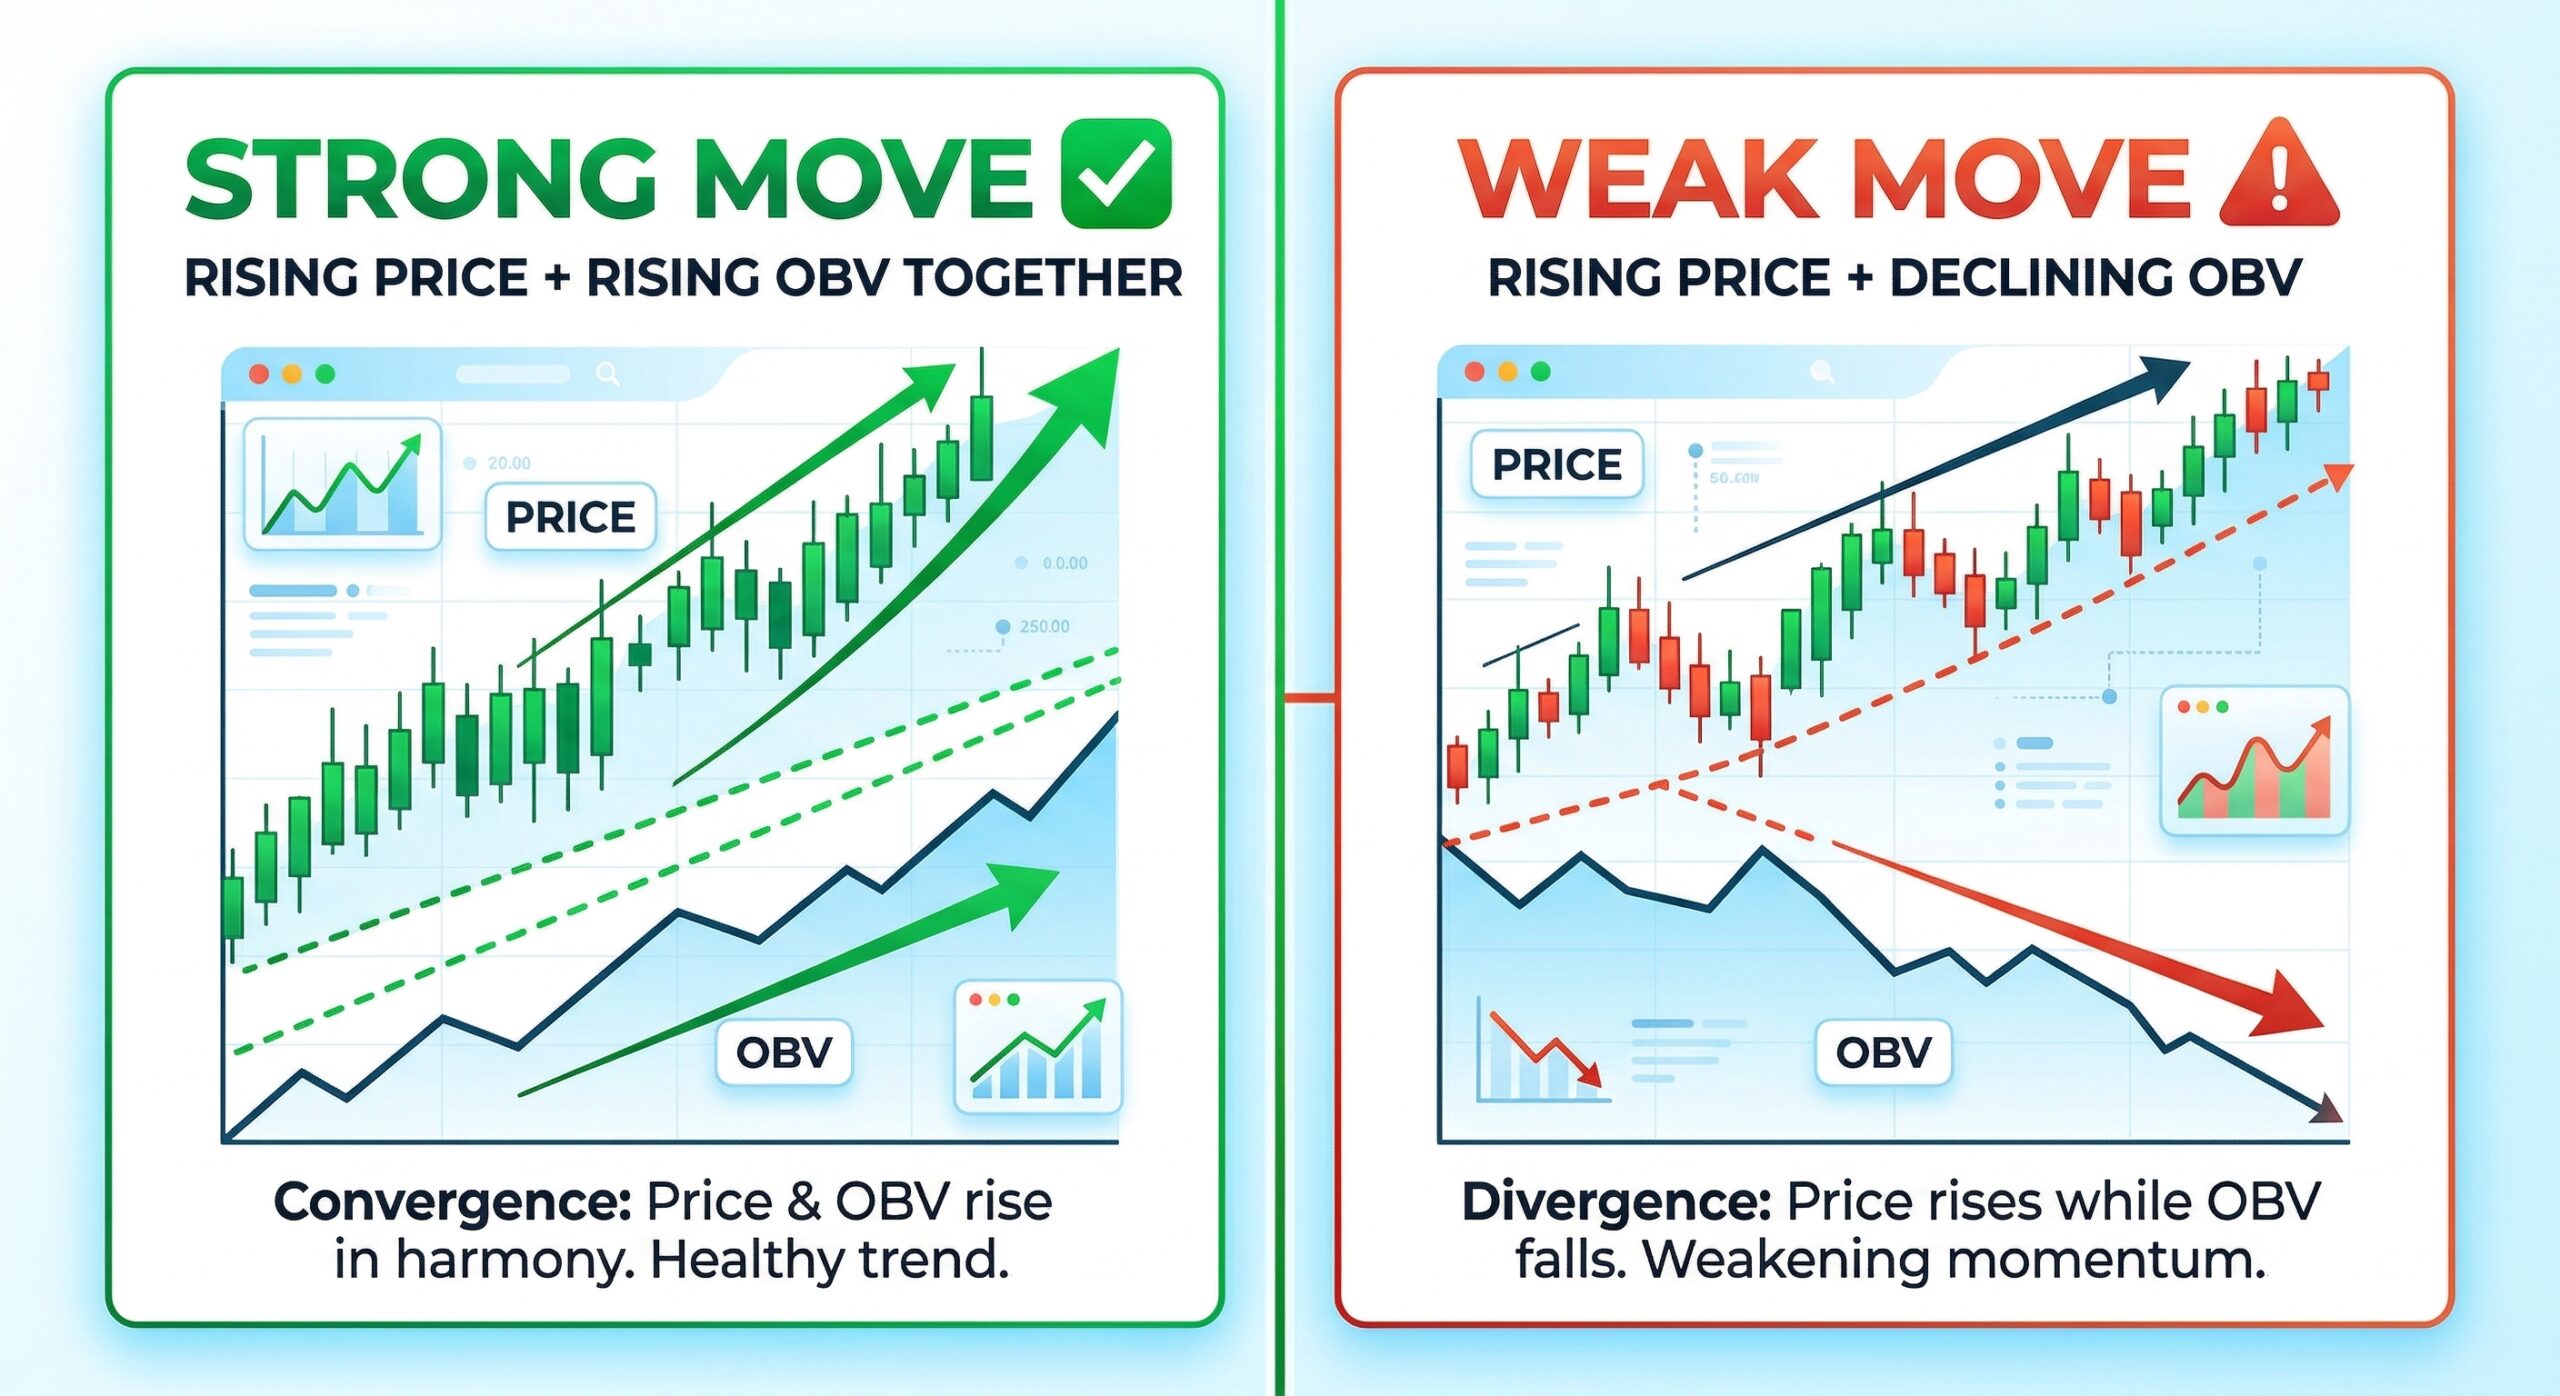
On-Balance Volume (OBV)
OBV adds volume on up-days and subtracts it on down-days, creating a cumulative total. When OBV rises alongside price, the trend has strong buying support. When OBV diverges from price (price rising, OBV falling), it warns of a potential reversal.
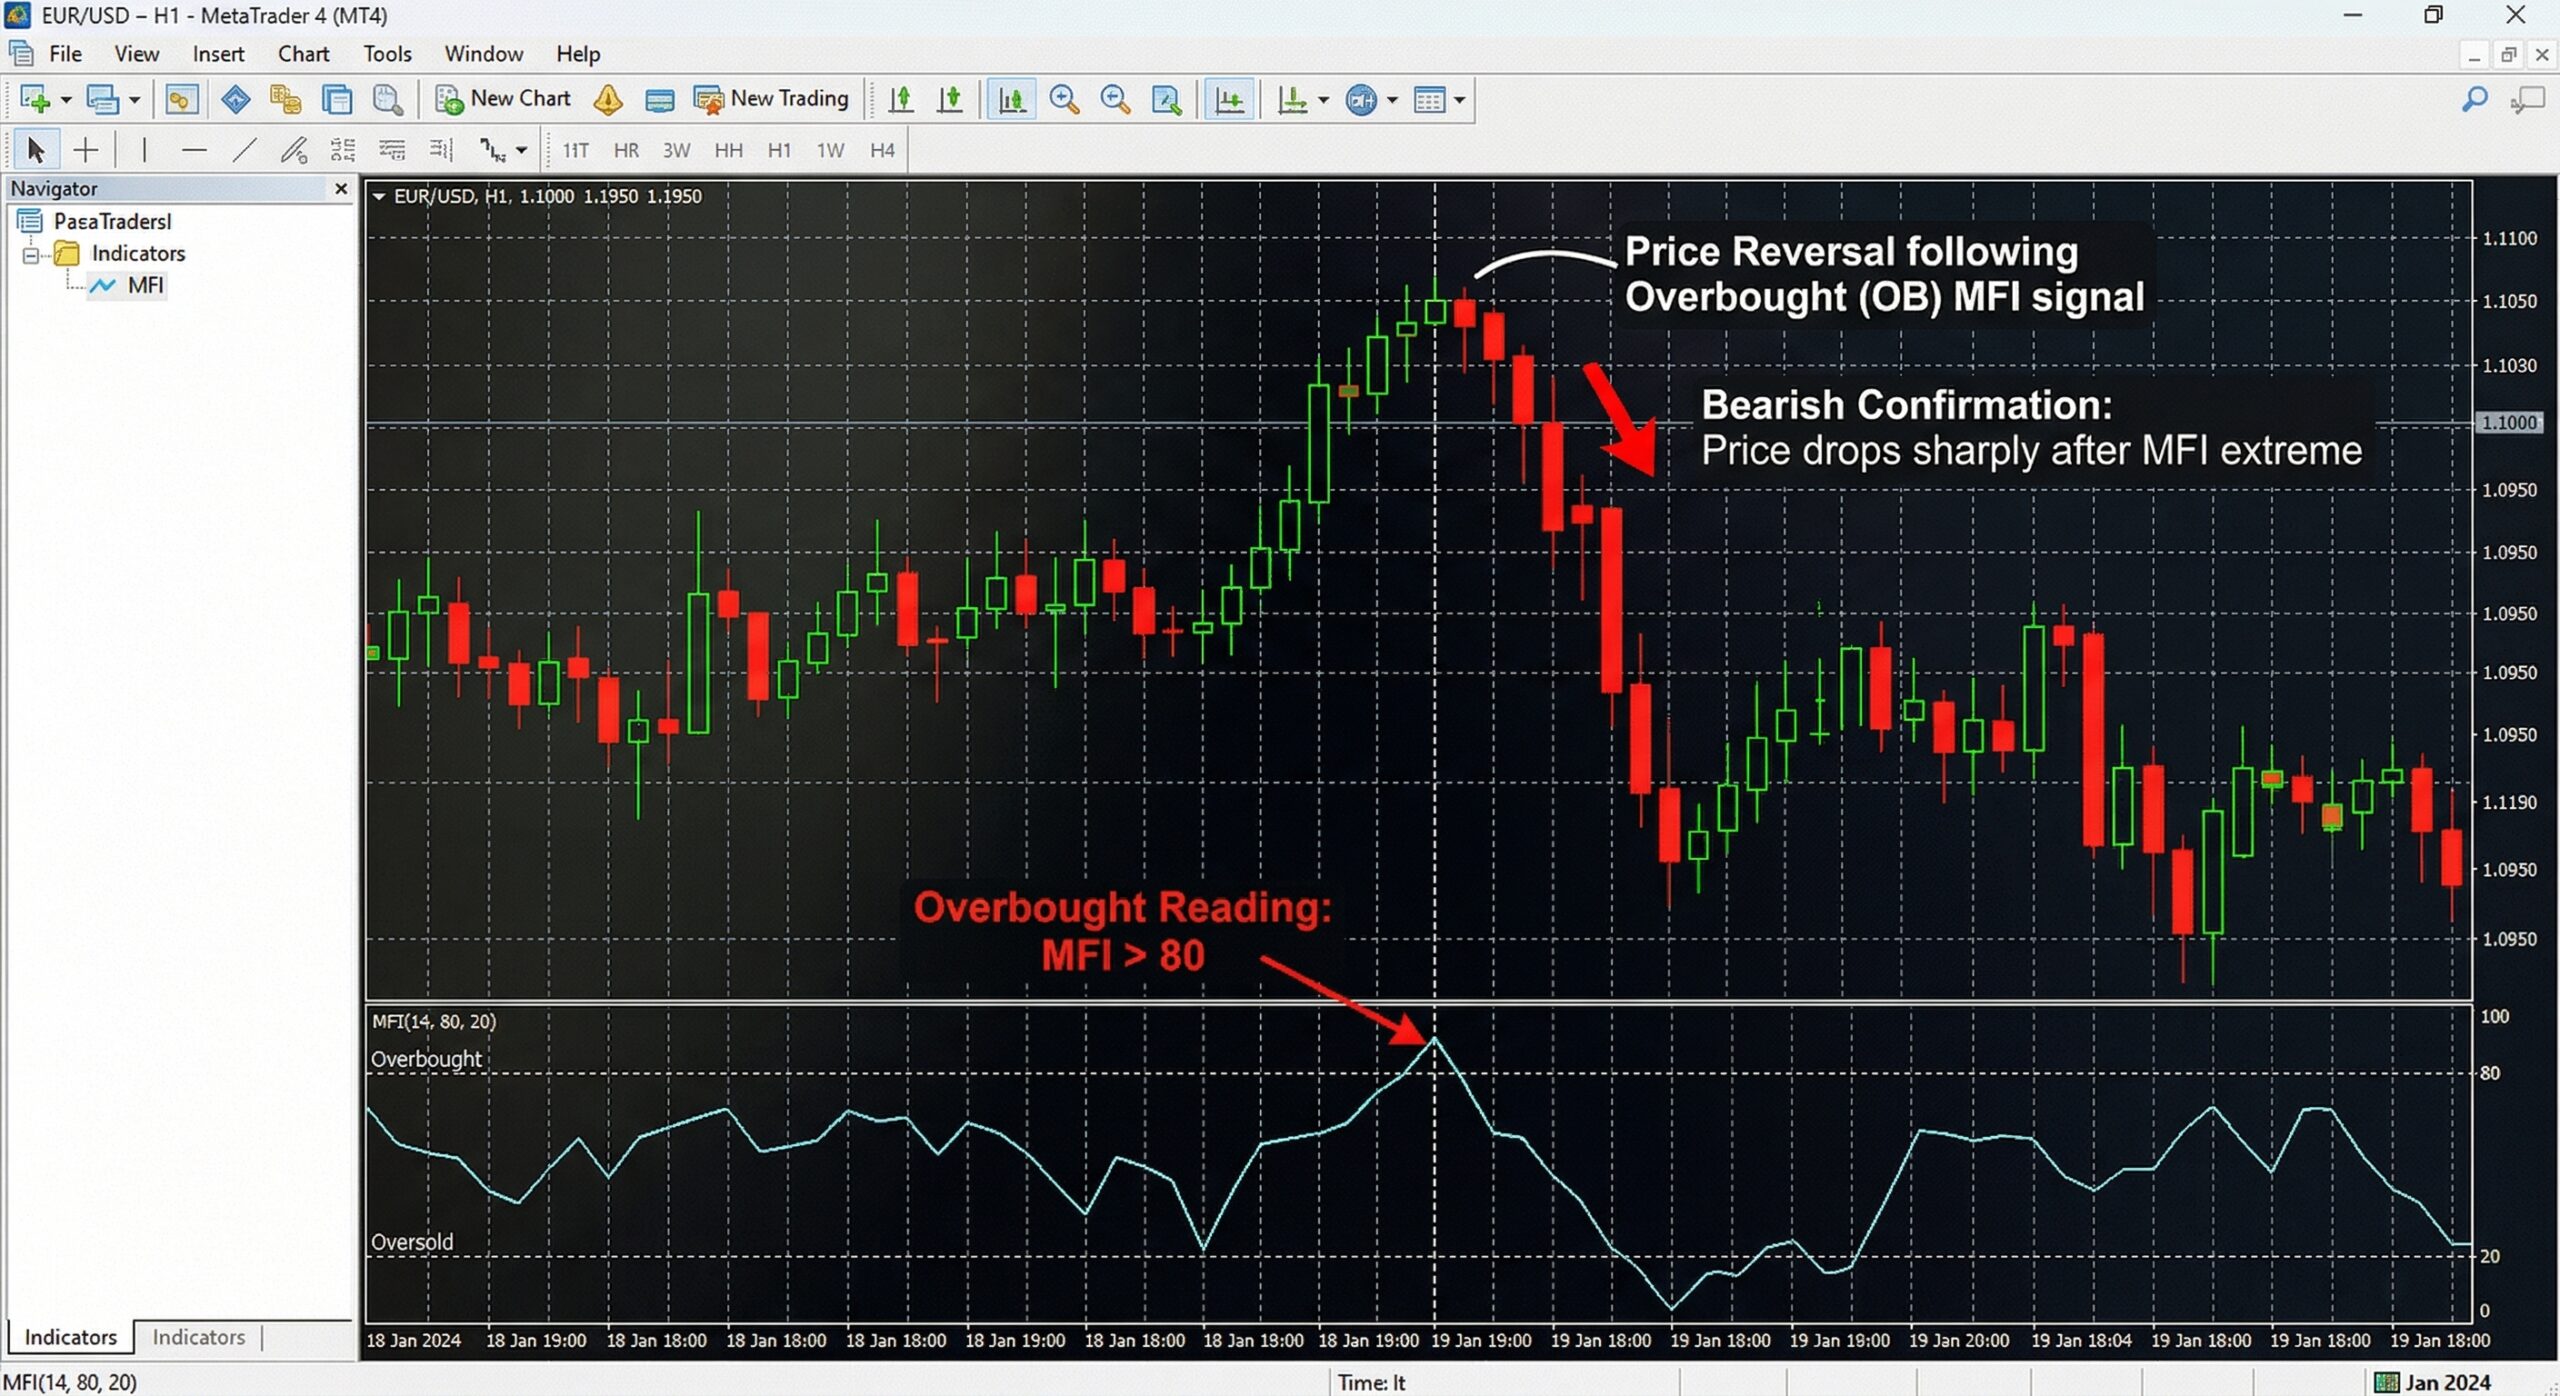
Money Flow Index (MFI)
Often called the volume-weighted RSI the MFI uses both price and volume to identify overbought/oversold conditions. Readings above 80 indicate overbought; below 20, oversold. It adds a volume dimension that the standard RSI lacks.
Accumulation/Distribution Line
Similar to OBV but considers the entire trading range (not just close), making it more sensitive to intra-bar price action. It helps identify whether a security is being accumulated (bought) or distributed (sold). Learn more →
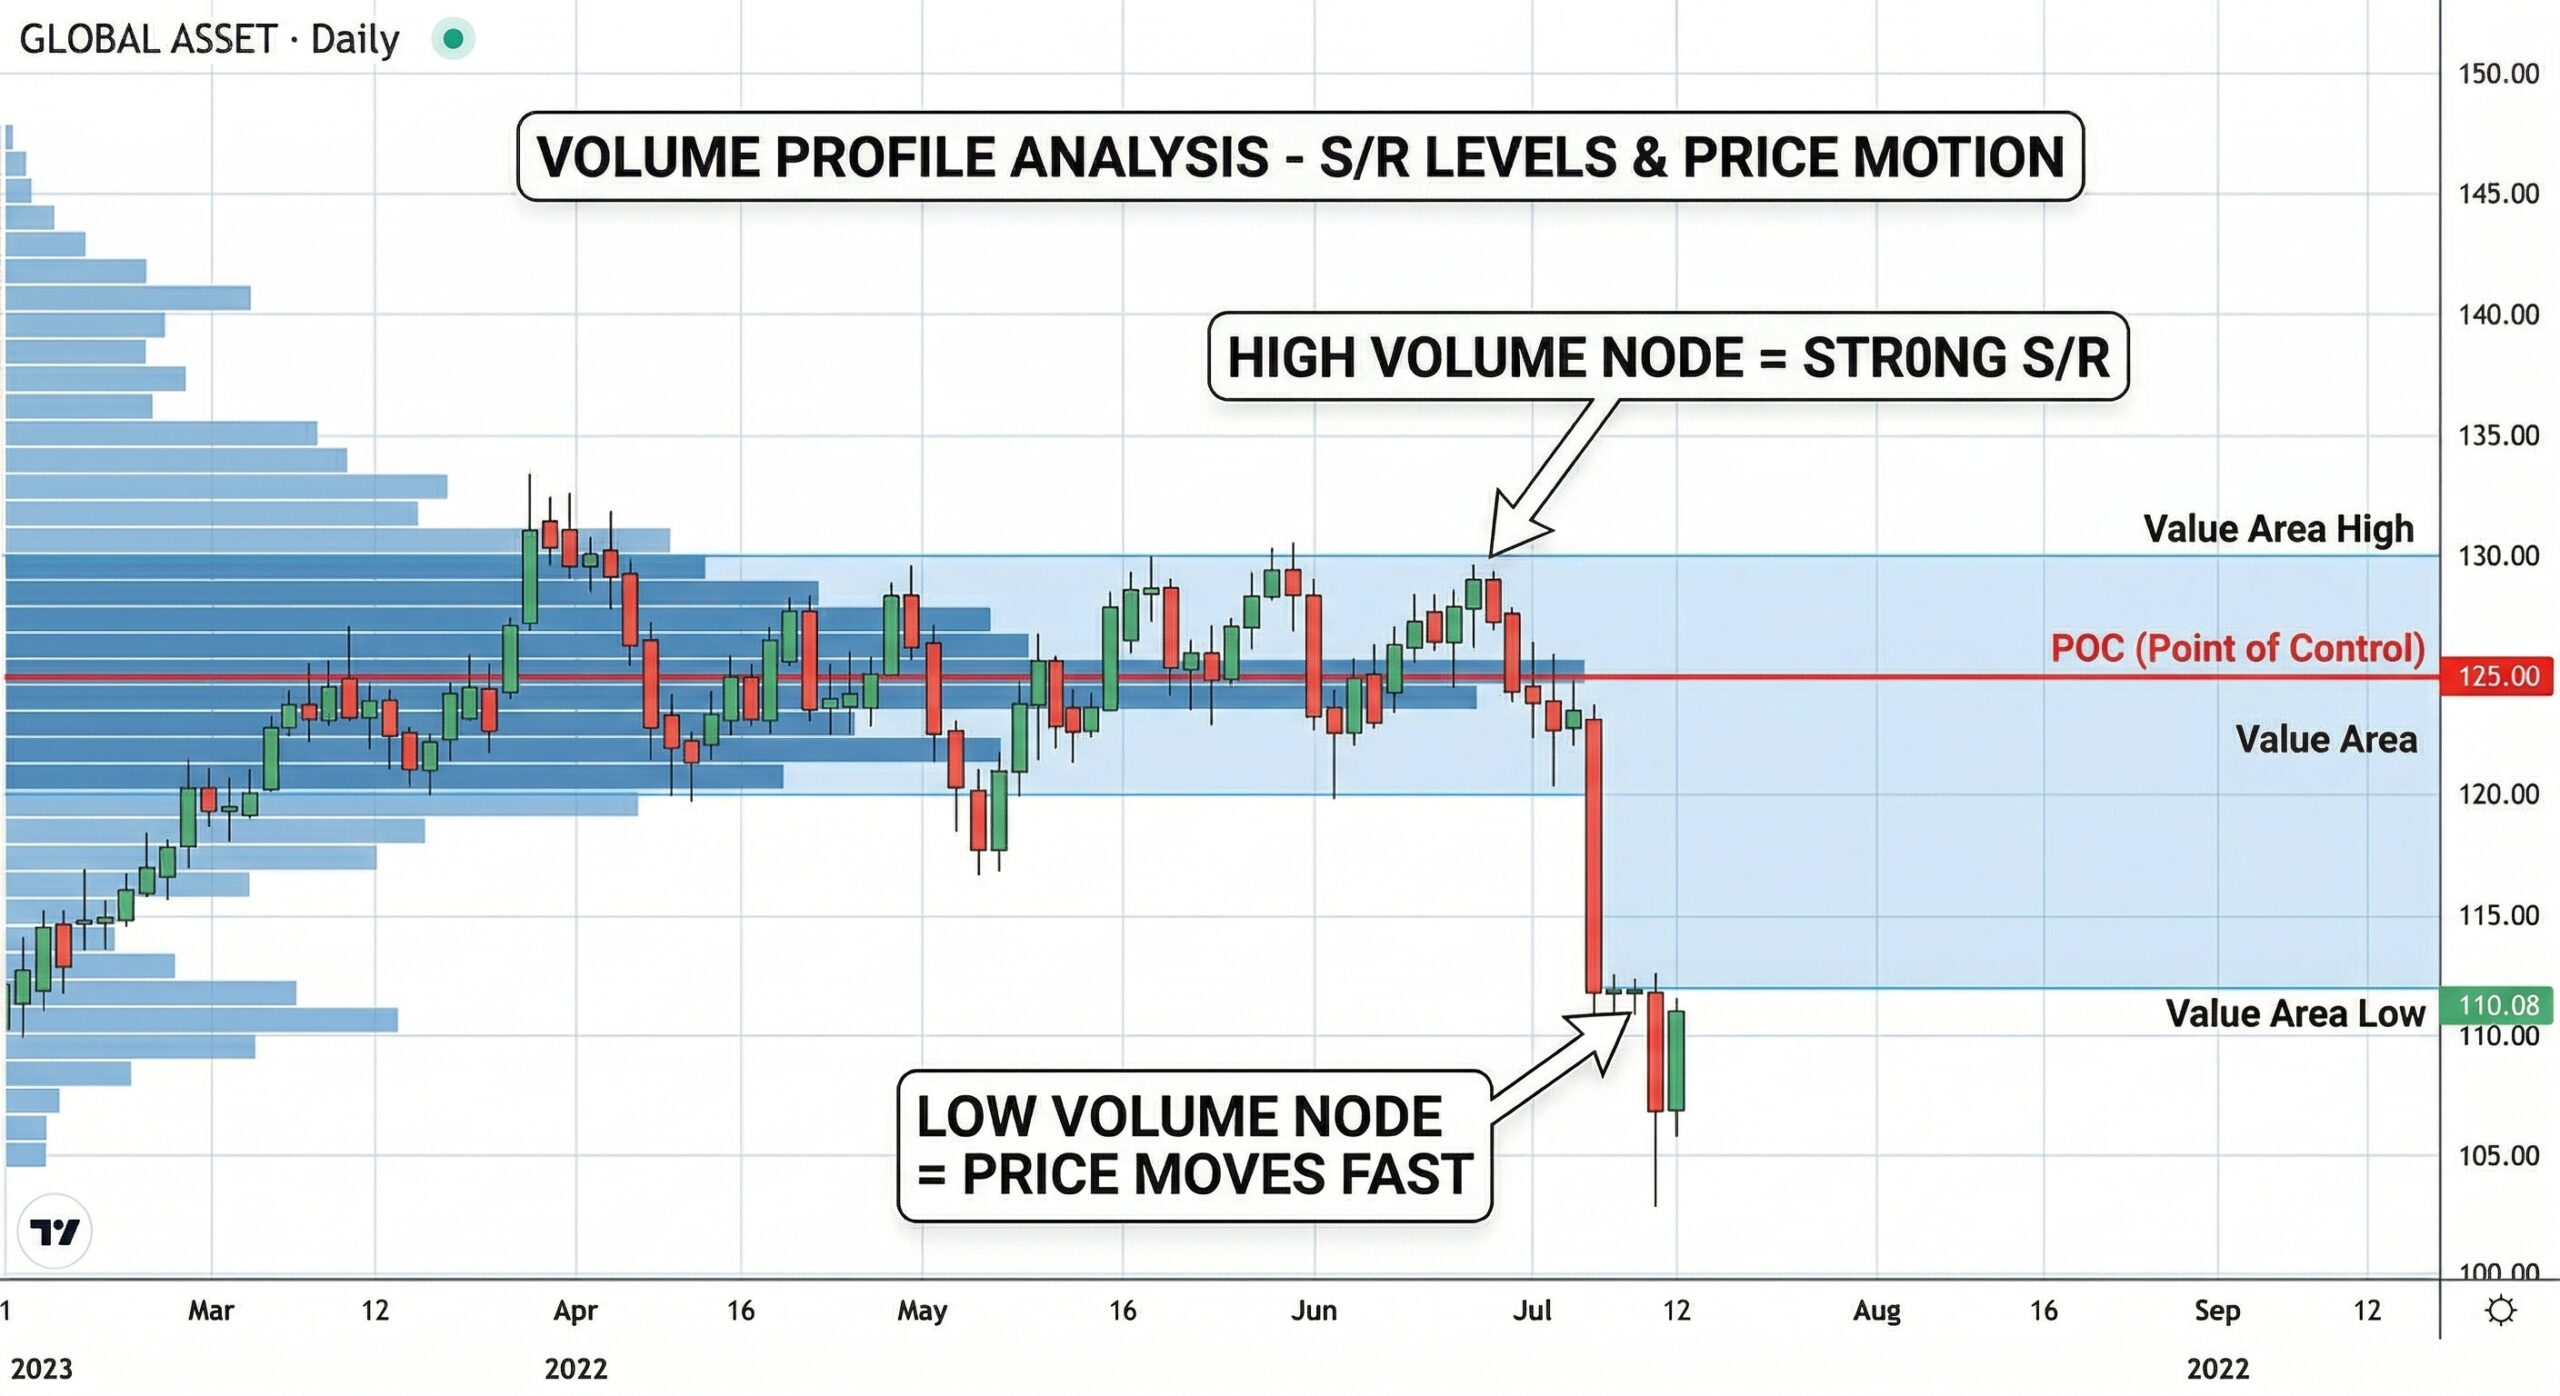
Volume Profile
While not a default MT4 indicator, Volume Profile displays trading volume at each price level rather than over time. This reveals high-volume nodes (strong support/resistance) and low-volume nodes (price moves fast through here) — extremely valuable for identifying support and resistance zones.
4. Volatility Indicators
Volatility indicators measure how much price is fluctuating. They don’t tell you direction — they tell you how turbulent the market is. This is critical for:
- Setting appropriate stop-loss distances
- Timing entries during volatility expansion
- Avoiding trades during low-volatility chop
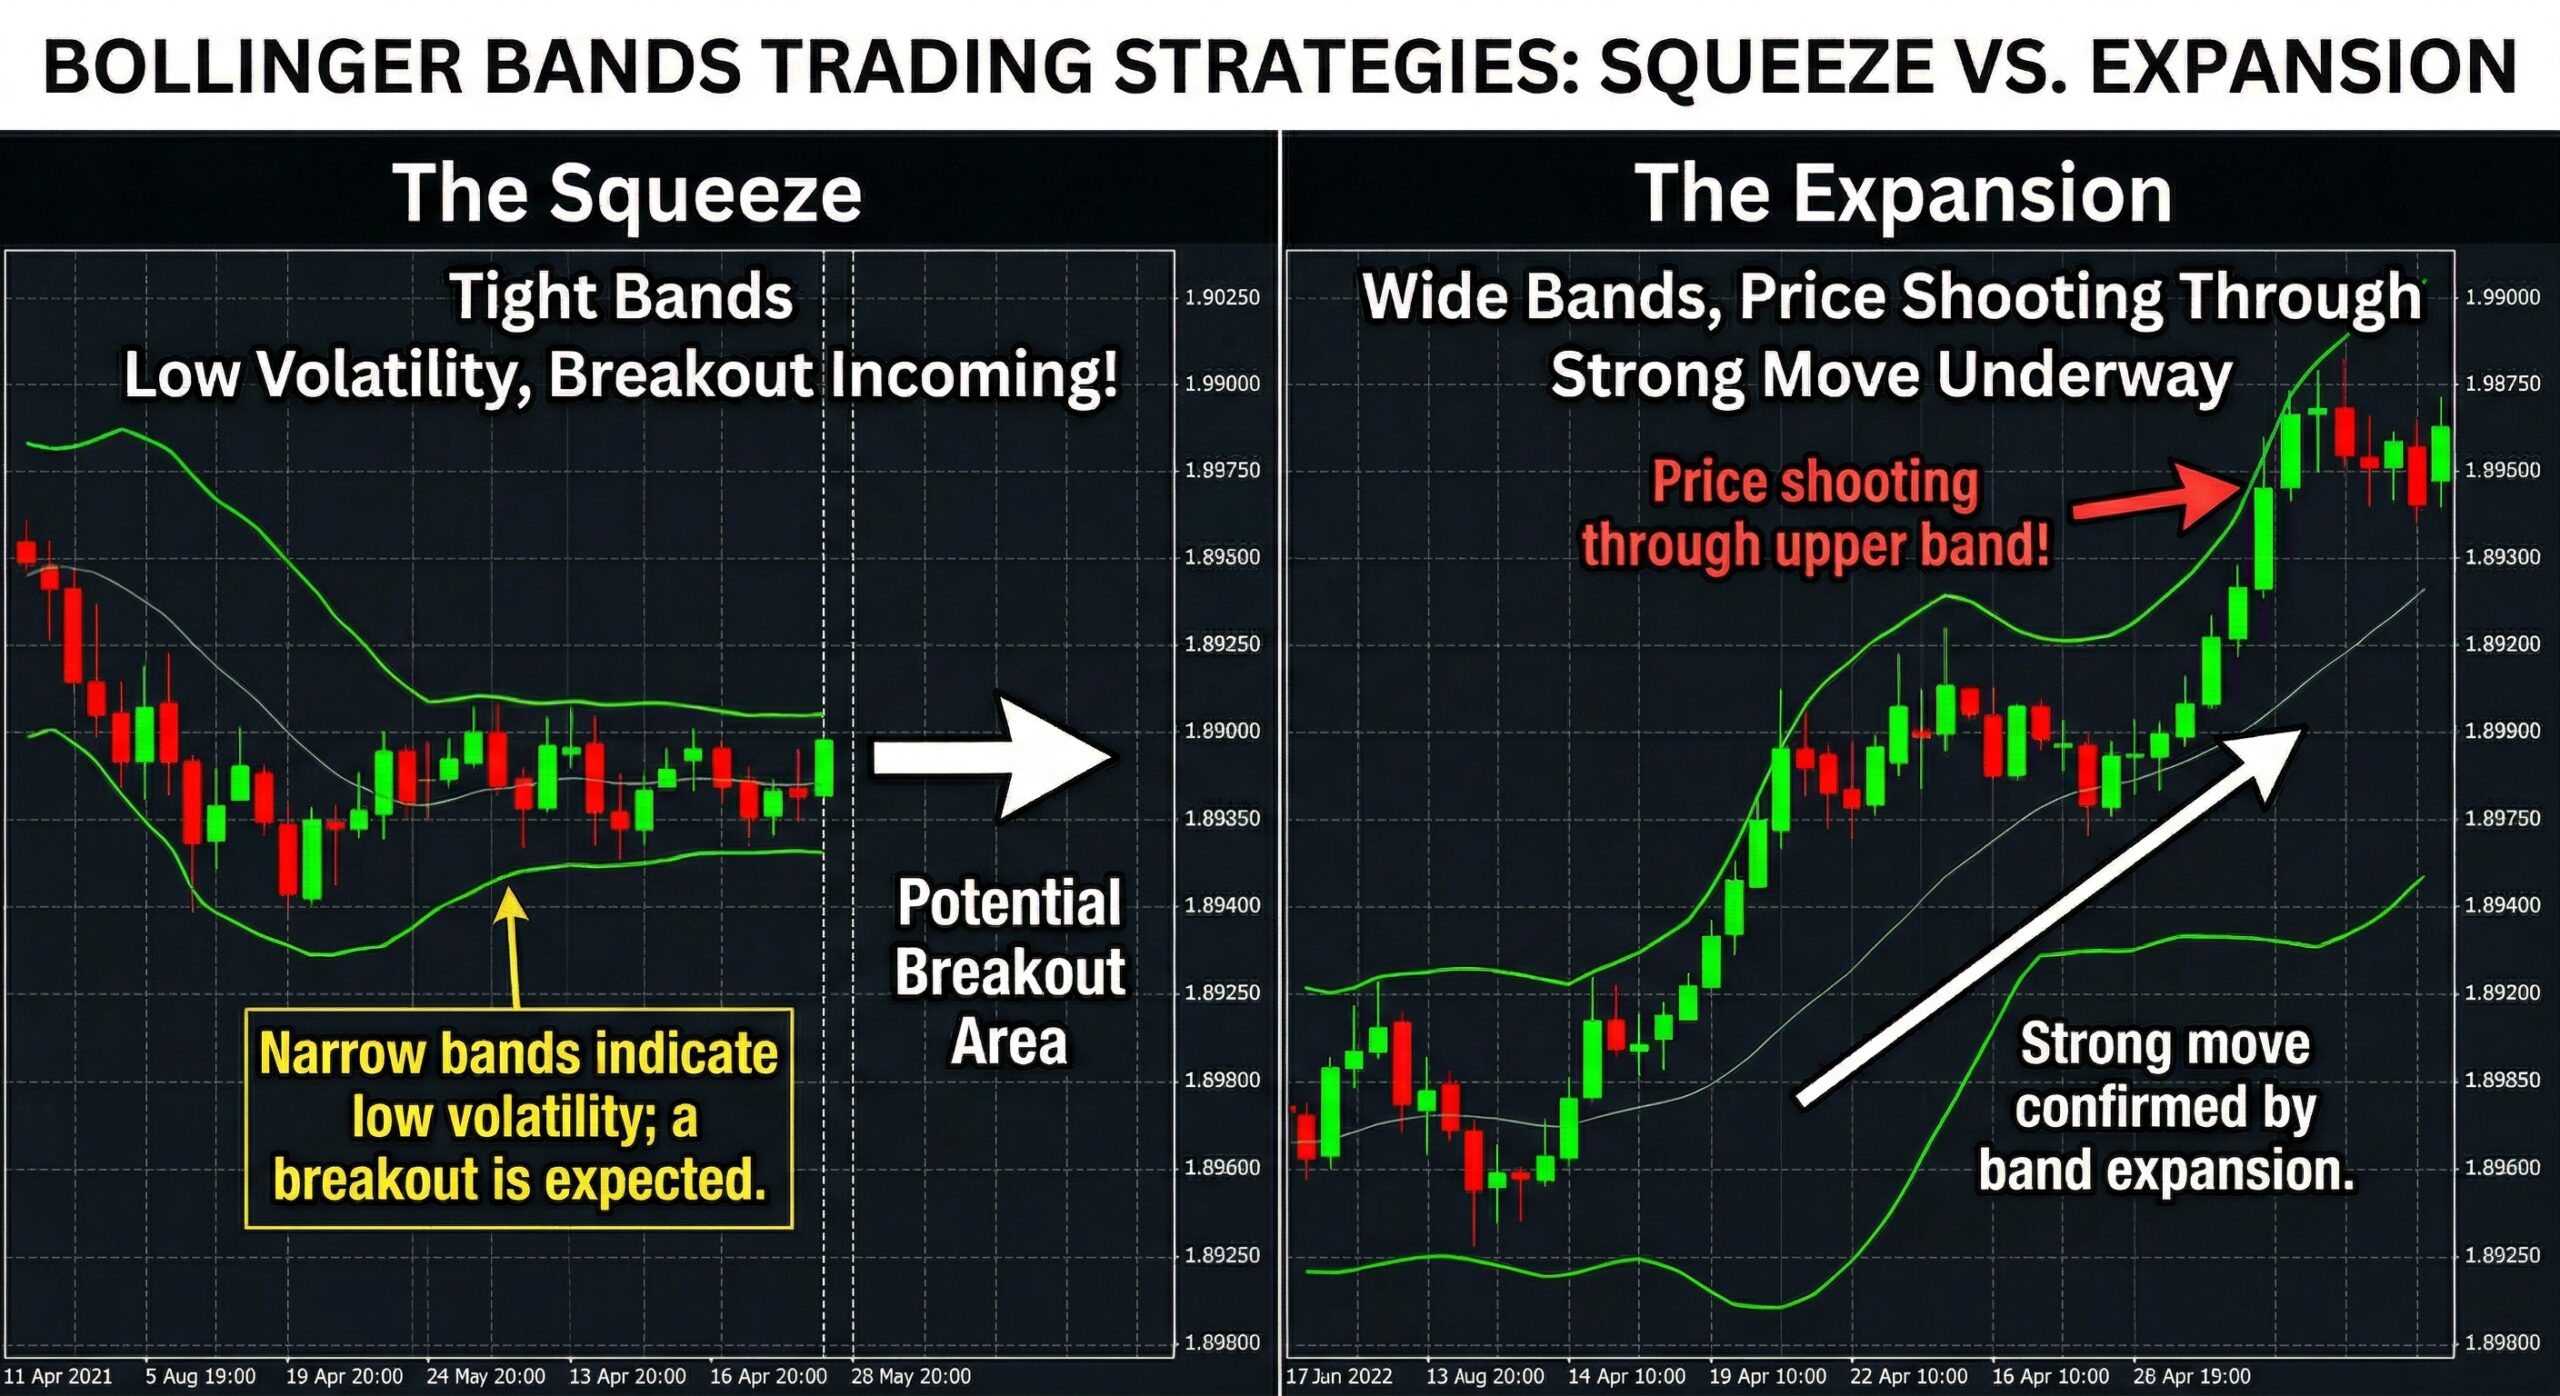
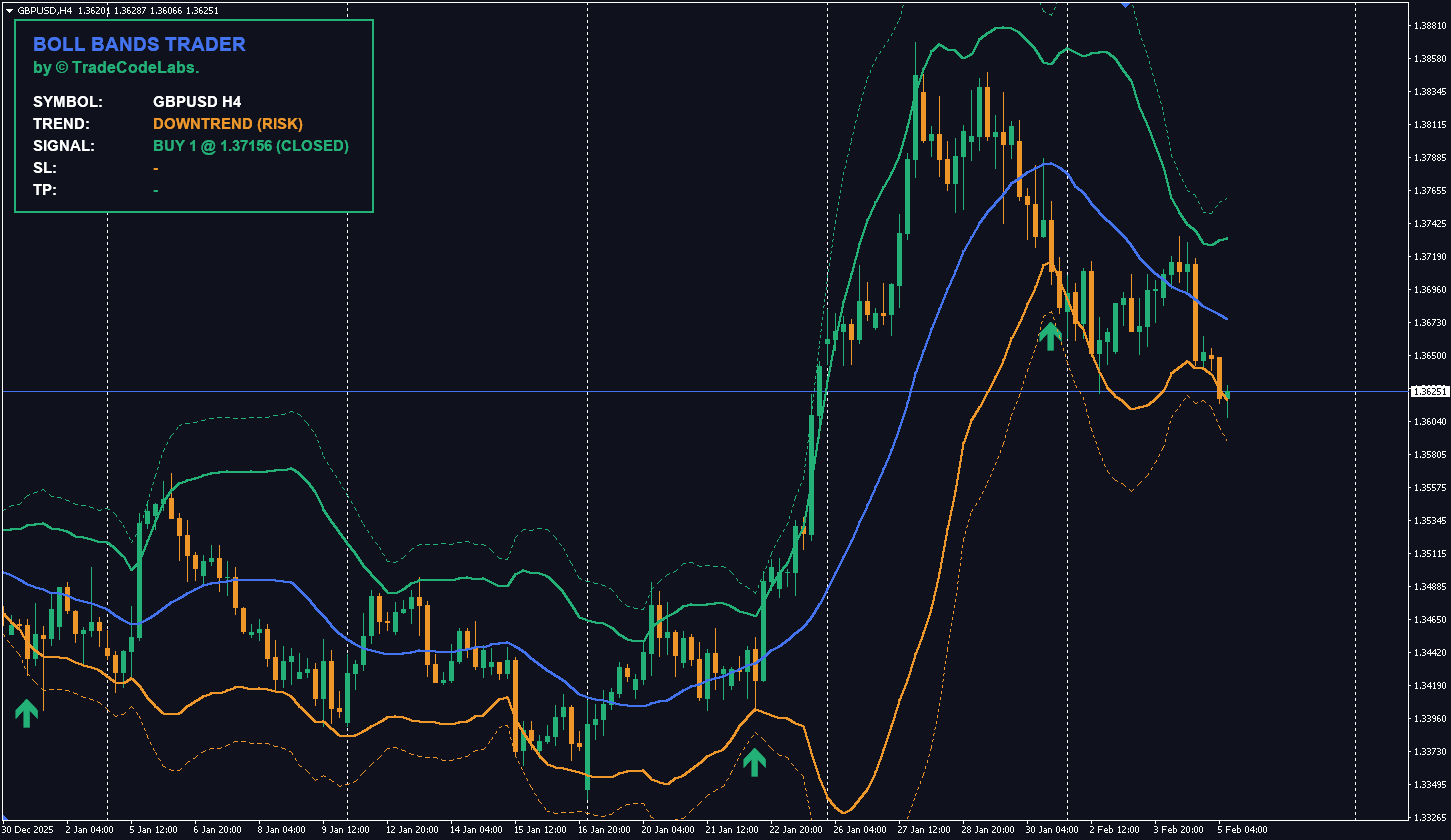
Bollinger Bands
Bollinger Bands consist of a 20-period SMA (middle band) with upper and lower bands plotted 2 standard deviations away. When bands squeeze together, low volatility is present and a breakout is imminent. When bands expand, a strong move is underway.
Price touching the upper band suggests overbought conditions; touching the lower band suggests oversold. But in strong trends, price can “walk the band” — staying pinned to the upper or lower band for extended periods.
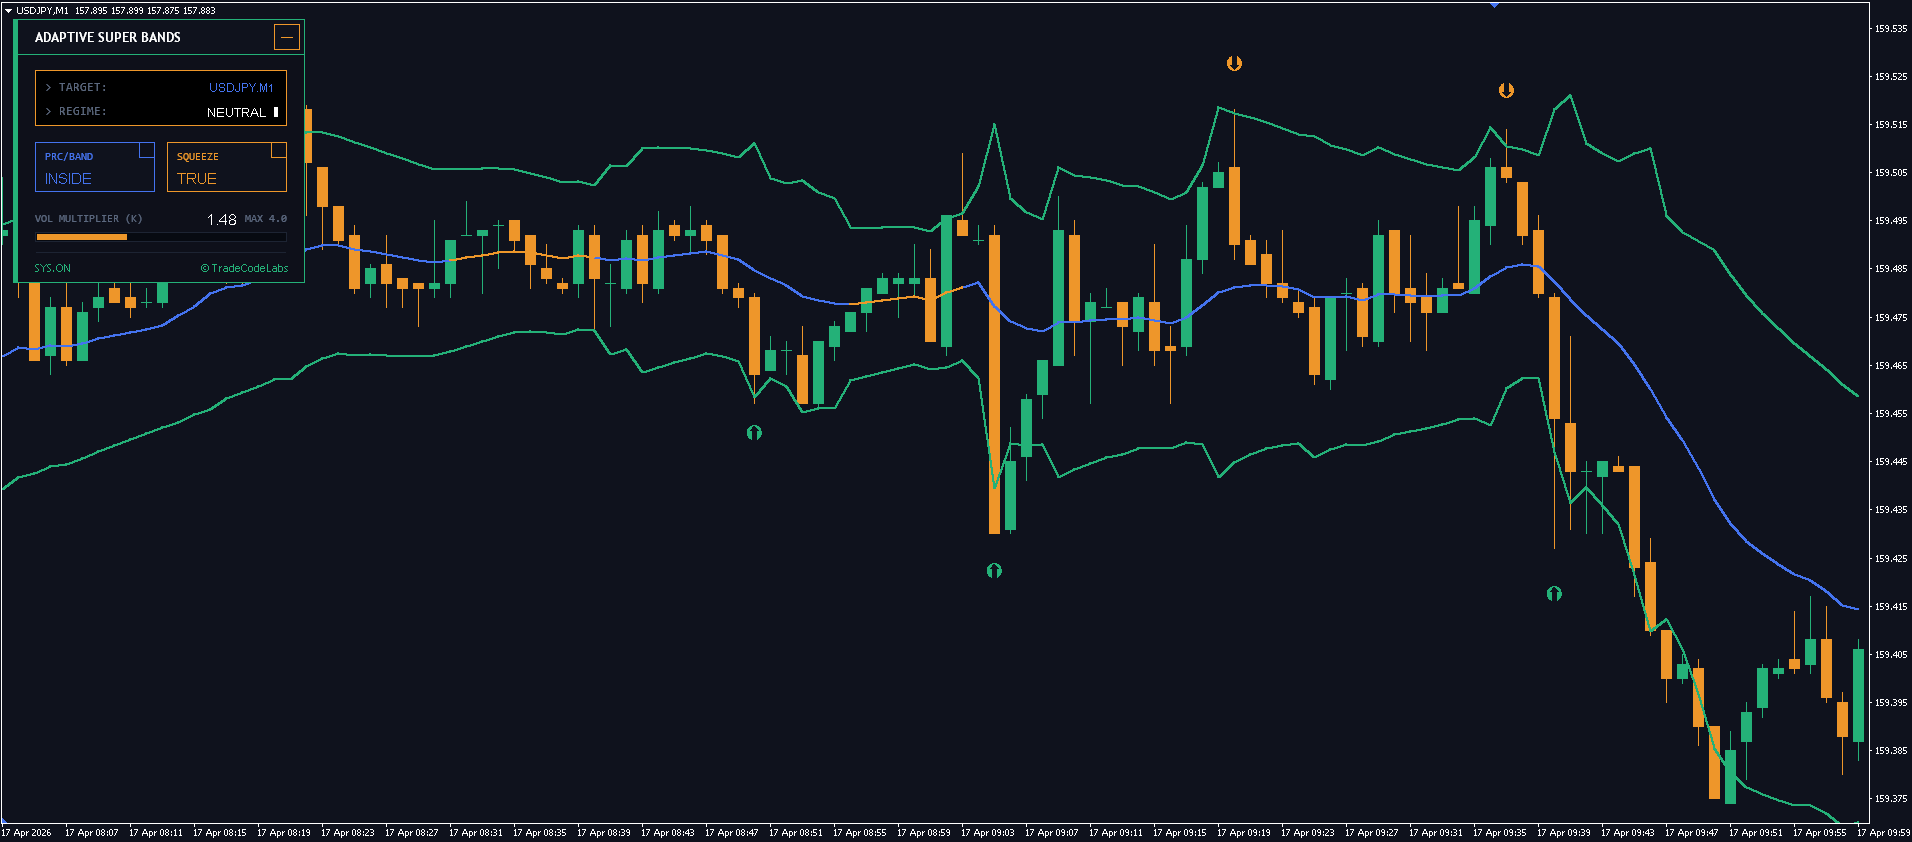
Our TCL BOLL BANDS TRADER builds on this concept with dynamic signal generation, trend filtering, and alert integration — turning Bollinger Bands from a passive visual tool into an active trading system.
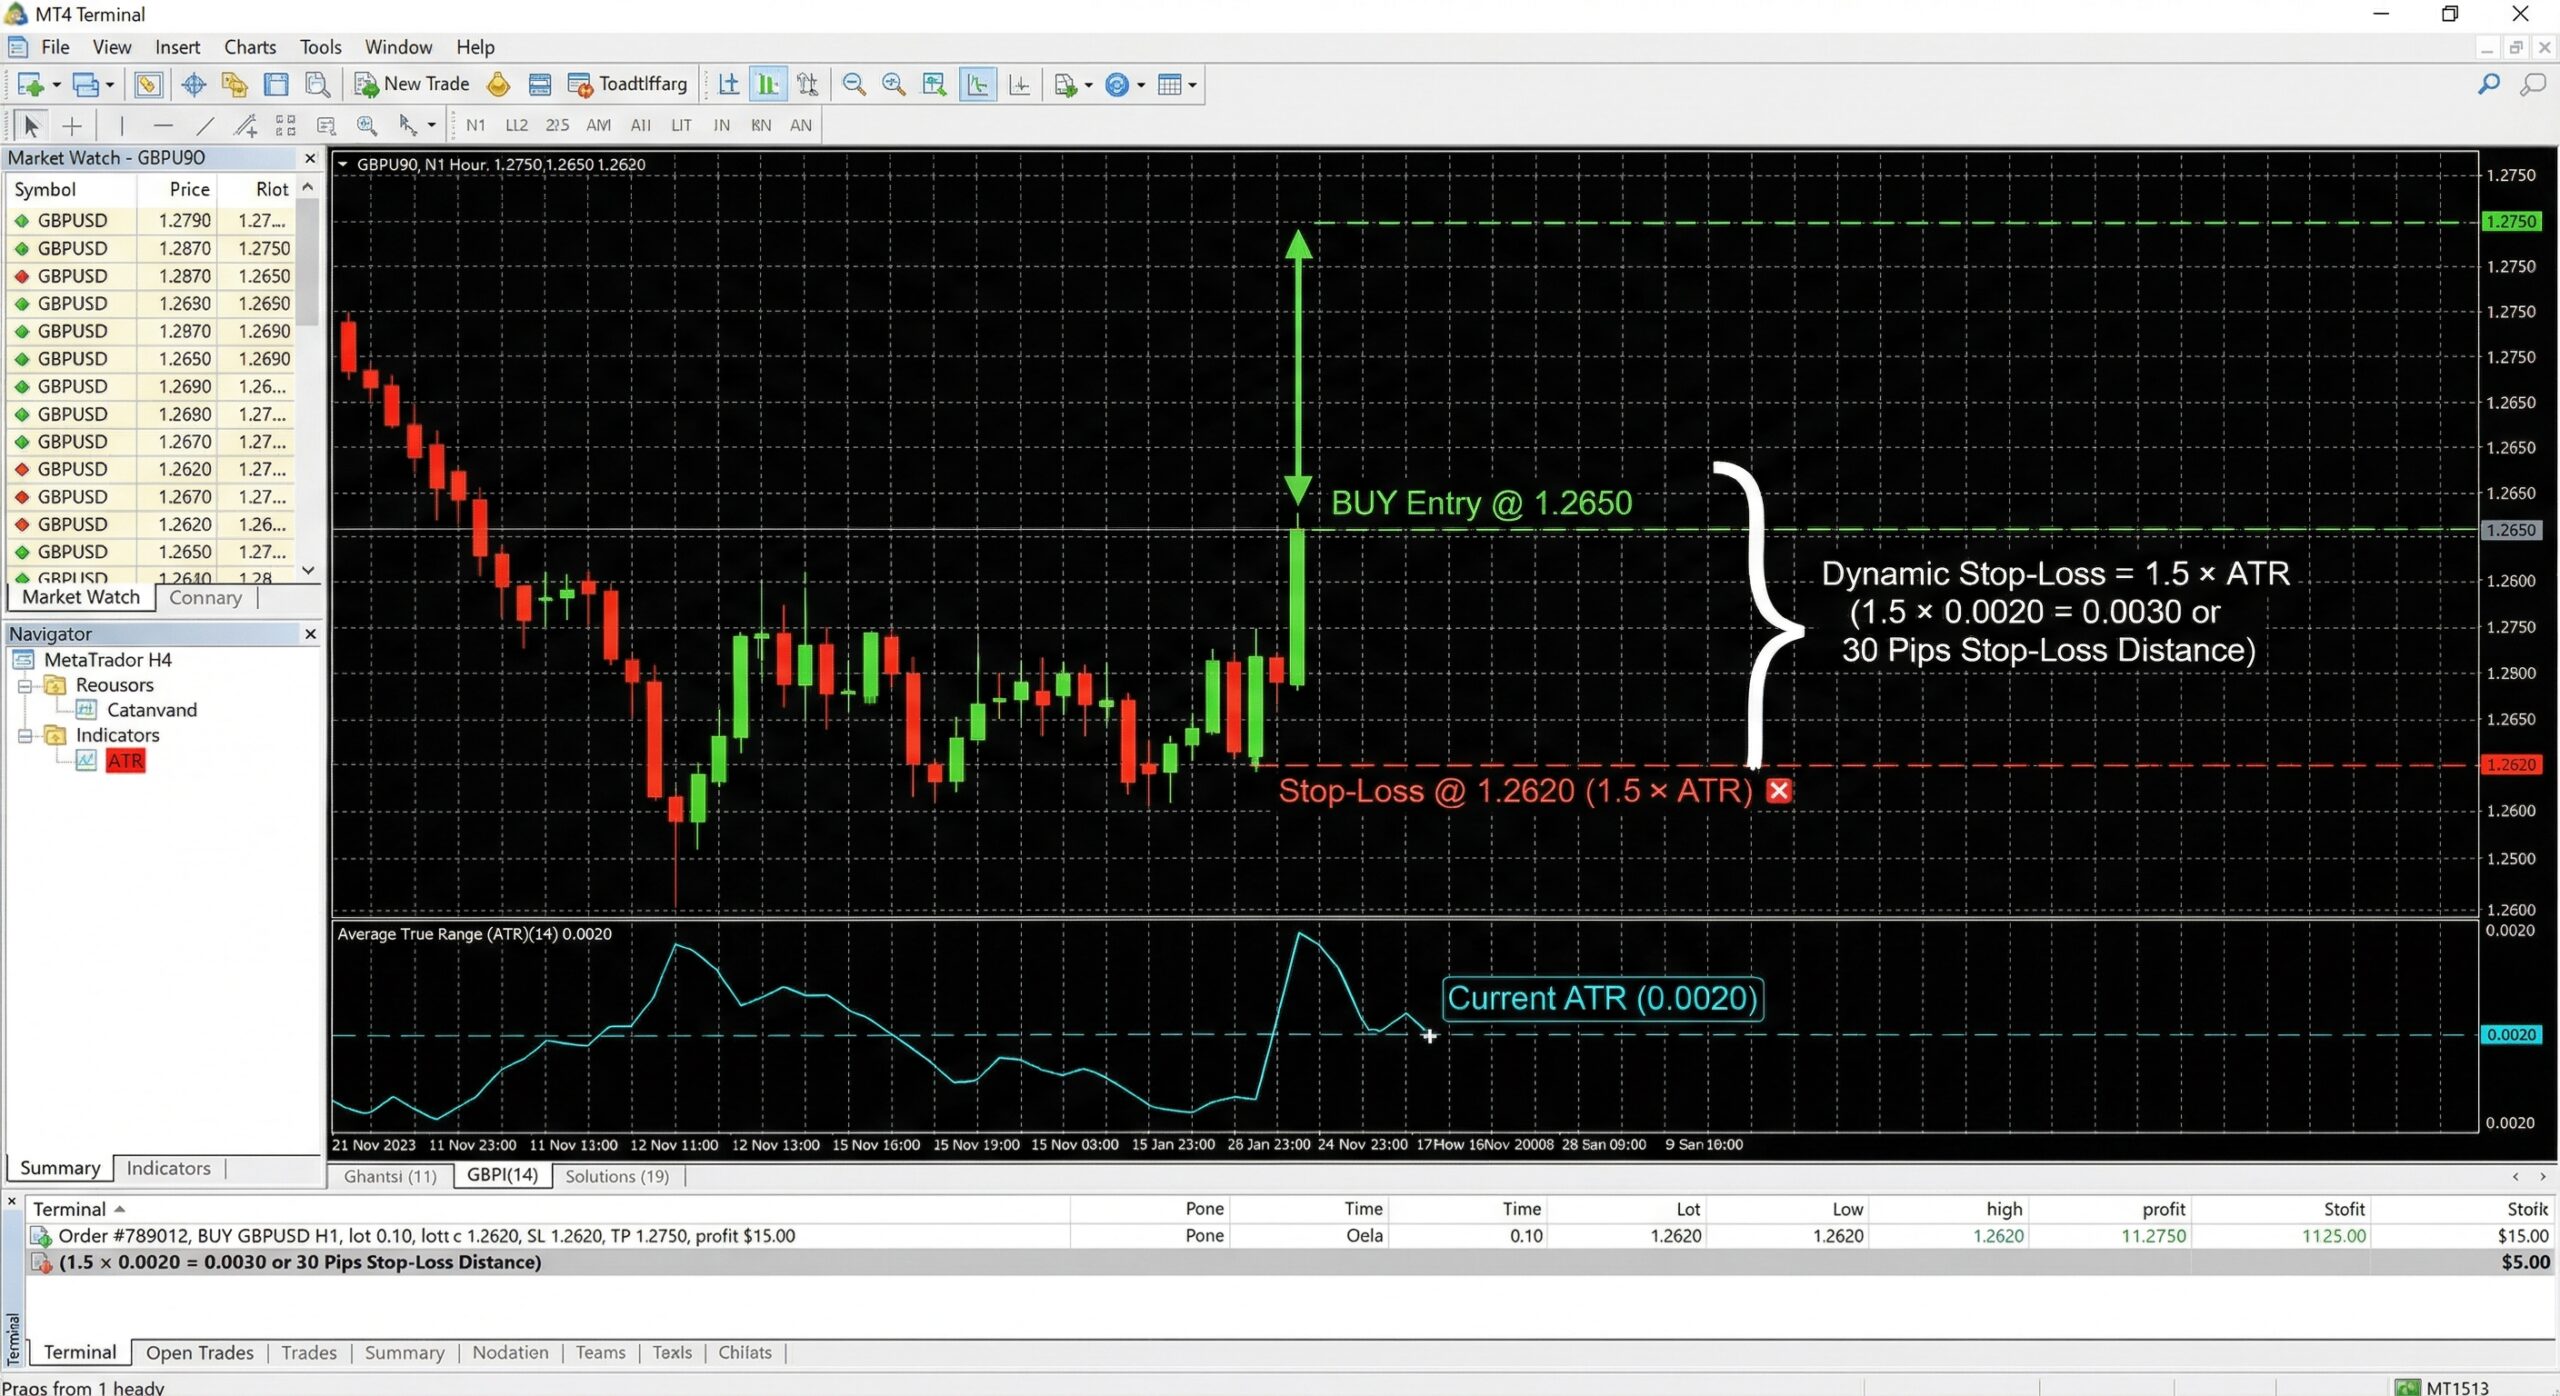
Average True Range (ATR)
The ATR calculates the average range of price movement over a specified period (typically 14). It doesn’t indicate direction — only how much price is moving. Traders use ATR to:
- Set dynamic stop-losses (e.g., 1.5x ATR below entry)
- Determine position size based on current volatility
- Filter out low-volatility periods where signals are unreliable
Standard Deviation
Measures how dispersed price data is from its mean. Higher standard deviation equals higher volatility. It’s the mathematical backbone behind Bollinger Bands.
The Best MT4 Indicators for Different Trading Styles
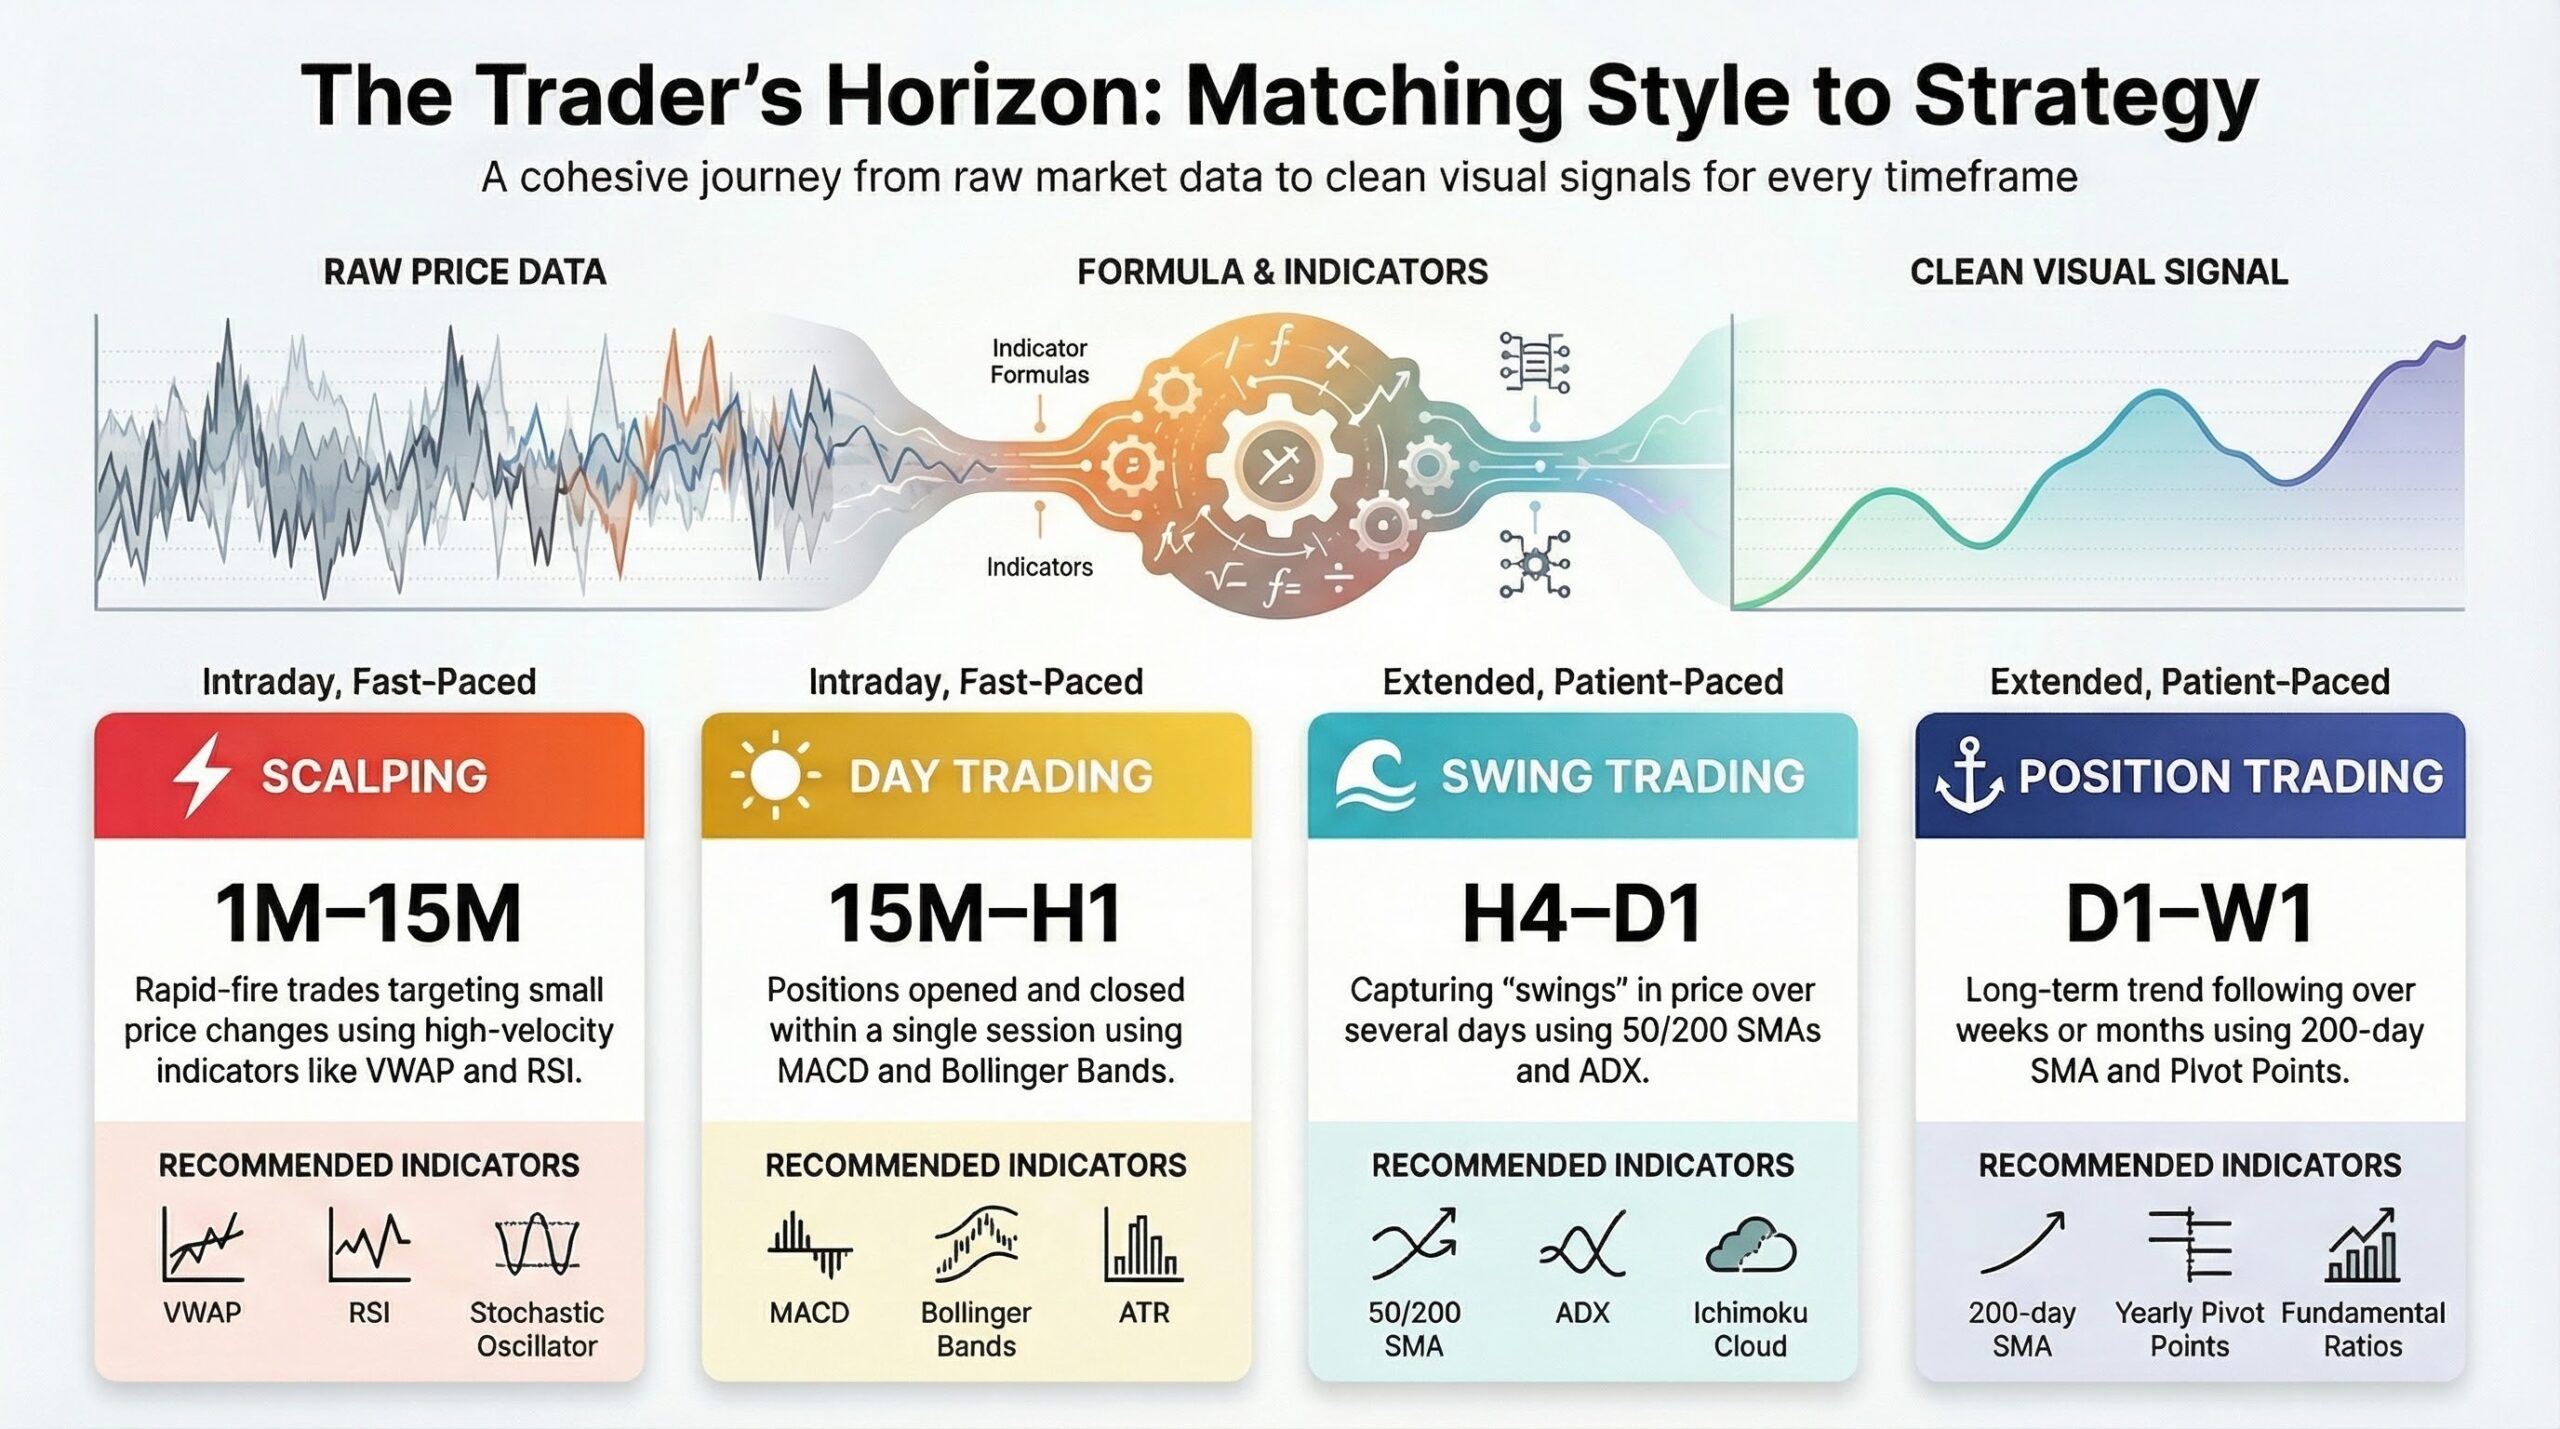
Not every indicator works for every trader. Here’s a quick guide to matching indicators with your trading style:
Scalping (1M–15M Charts)
- Recommended: EMA (8, 21), RSI (7-period), Bollinger Bands, ATR
- Why: You need fast, responsive indicators. Shorter RSI periods and EMAs react quicker to price changes.
Day Trading (15M–H1 Charts)
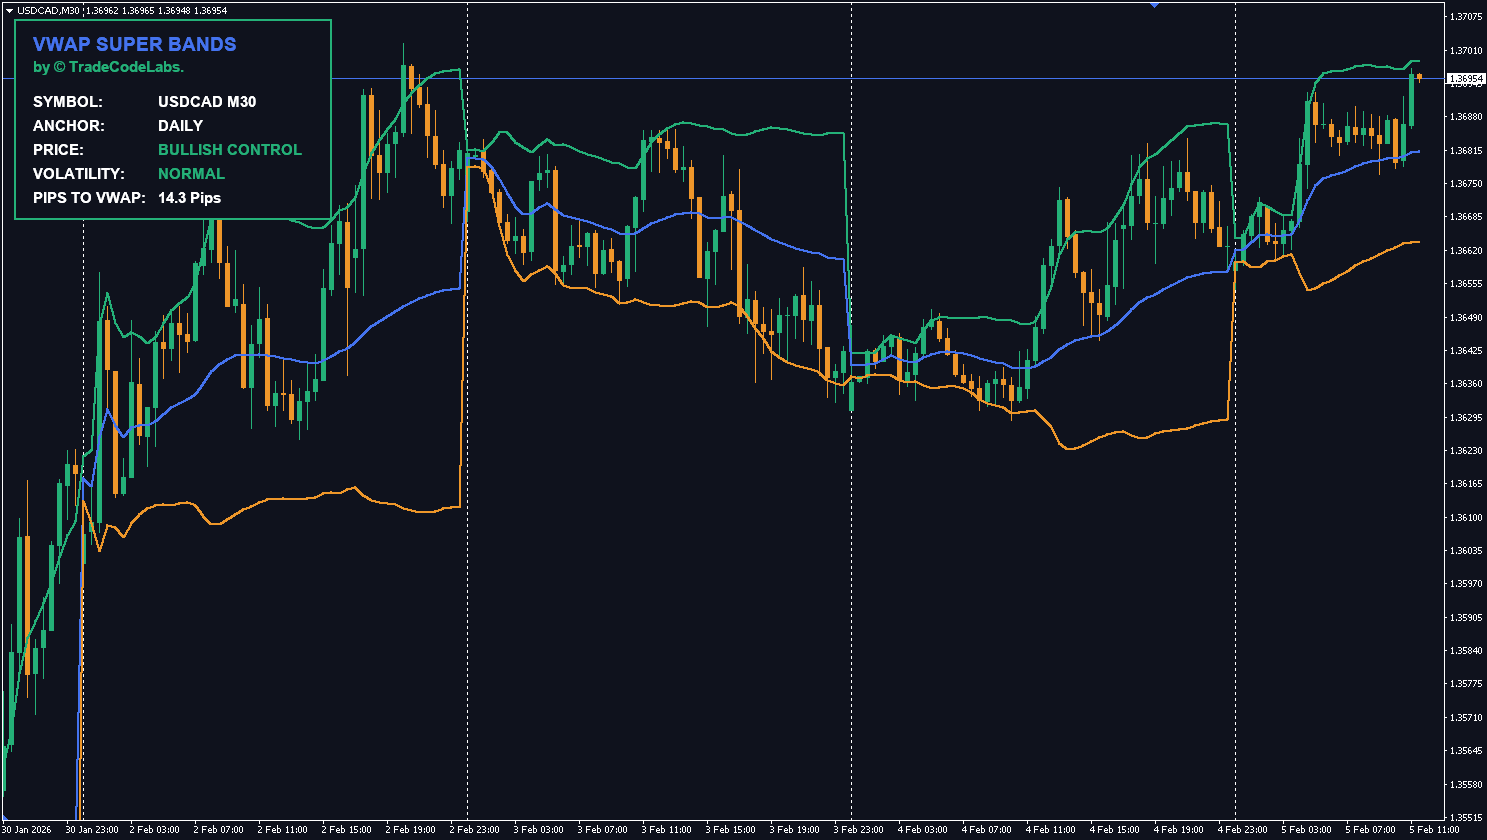
- Recommended: MACD, RSI (14-period), VWAP, Moving Averages (20, 50 EMA), Supply and Demand Zones
- Why: Balance between responsiveness and noise filtering. VWAP gives you a “fair value” benchmark for the session.
Our TCL VWAP SUPER BANDS indicator combines VWAP with dynamic volatility bands — ideal for day traders who want clean, actionable setups around the session’s average price.
Swing Trading (H4–D1 Charts)
- Recommended: Moving Averages (50, 200 SMA), Ichimoku Cloud, Fibonacci Retracement, RSI (14-period), Support and Resistance Zones
- Why: You need indicators that capture medium-term trends without reacting to every small fluctuation.
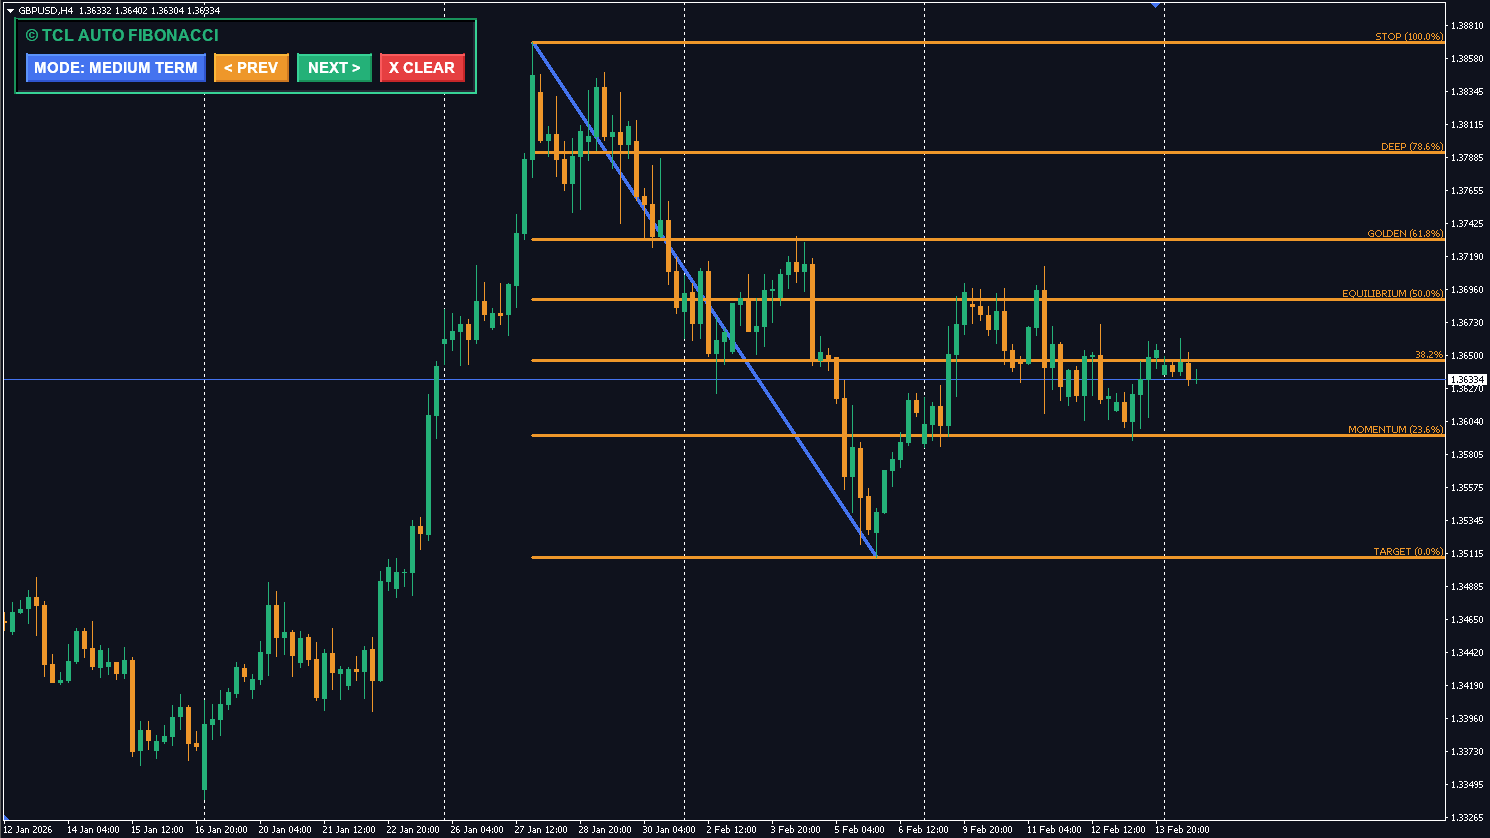
Our TCL AUTO FIBONACCI automatically draws Fibonacci retracement and extension levels on your chart — saving you from manually plotting them on every swing.
Position Trading (D1–W1 Charts)
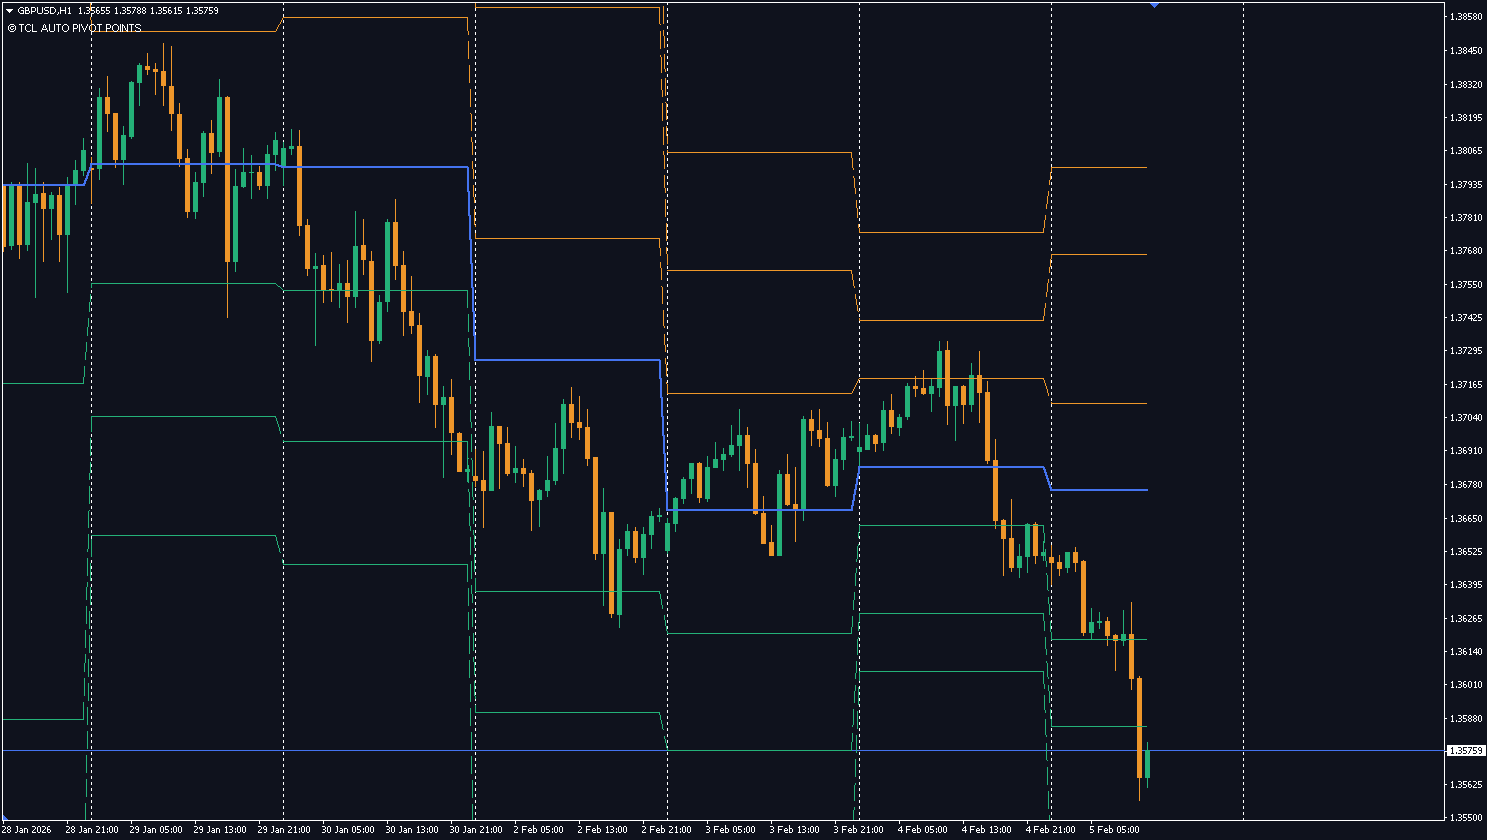
- Recommended: 200 SMA, MACD (weekly), ADX, Pivot Points
- Why: Long-term trend confirmation is the priority. Fewer signals, higher conviction.
Custom Indicators: Why They Matter in 2026
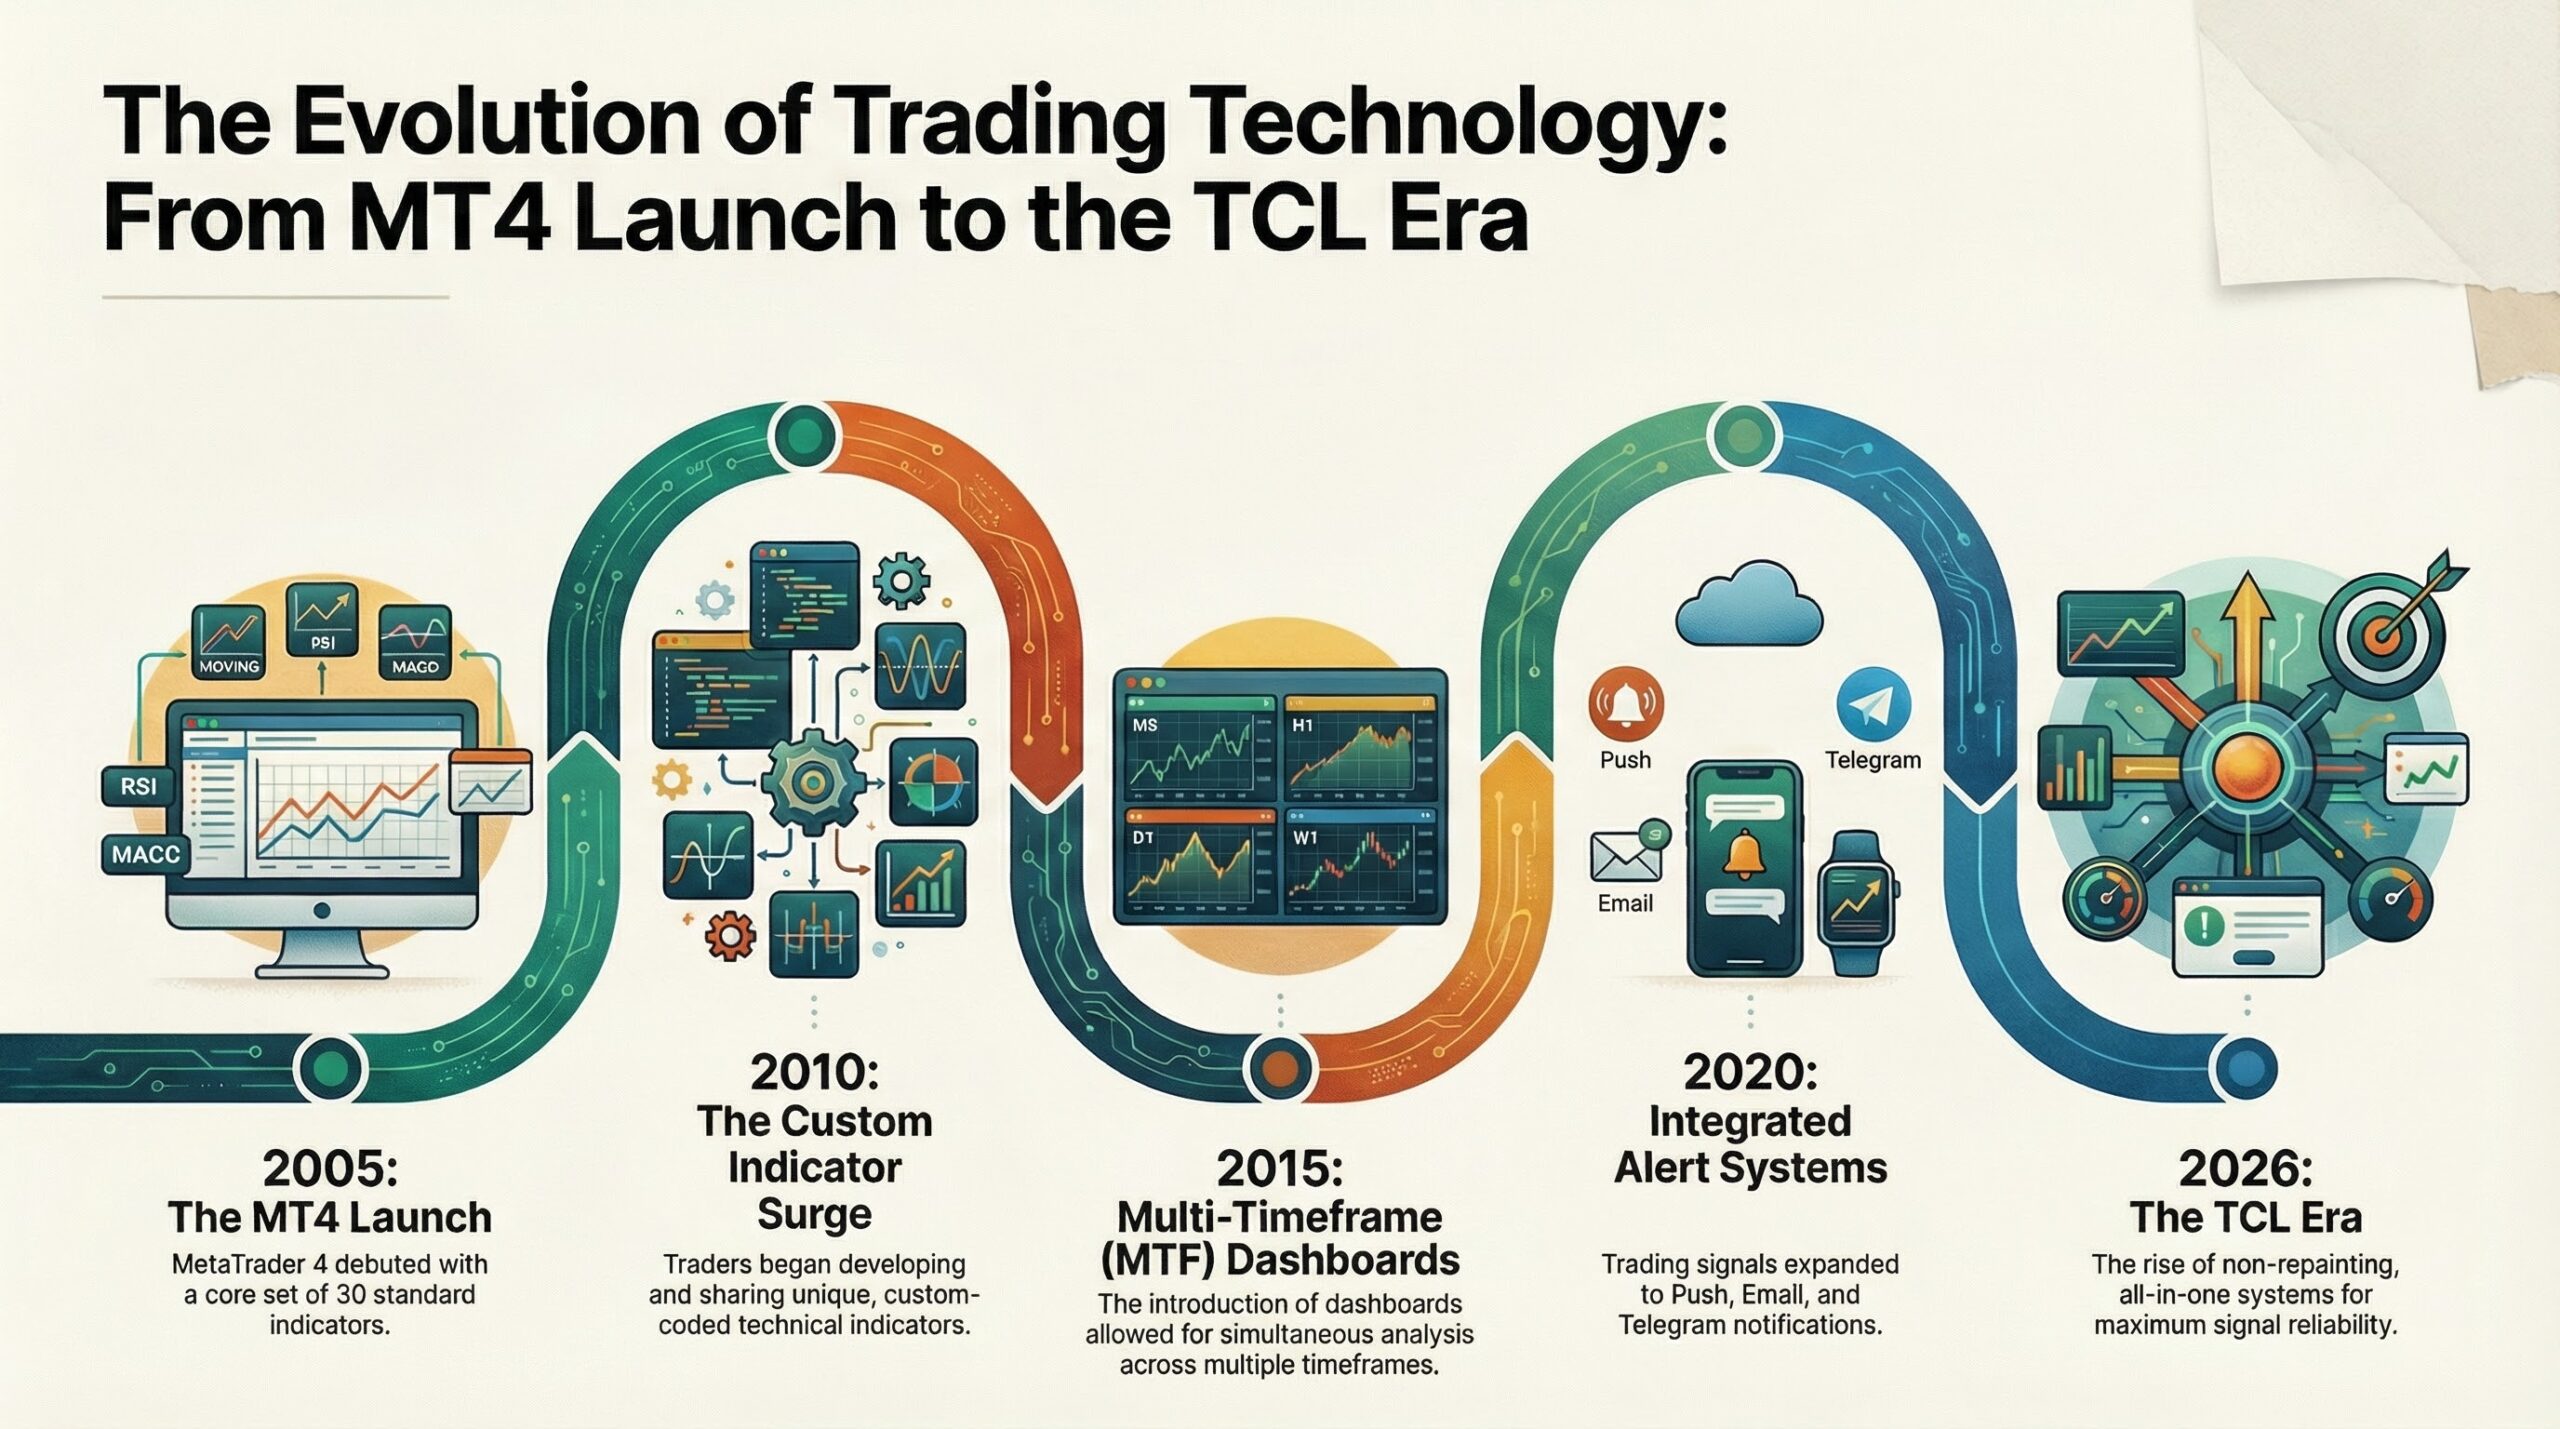
MT4’s built-in indicators are powerful — but they were designed in 2005. Trading has evolved significantly since then, and today’s traders need tools that go beyond simple moving averages and RSI.
Custom indicators fill that gap. Built using MQL4 (MetaQuotes Language 4) and coded in MT4’s integrated MetaEditor, custom indicators can:
- Combine multiple analysis methods into a single tool (e.g., multi-timeframe trend + momentum + alerts)
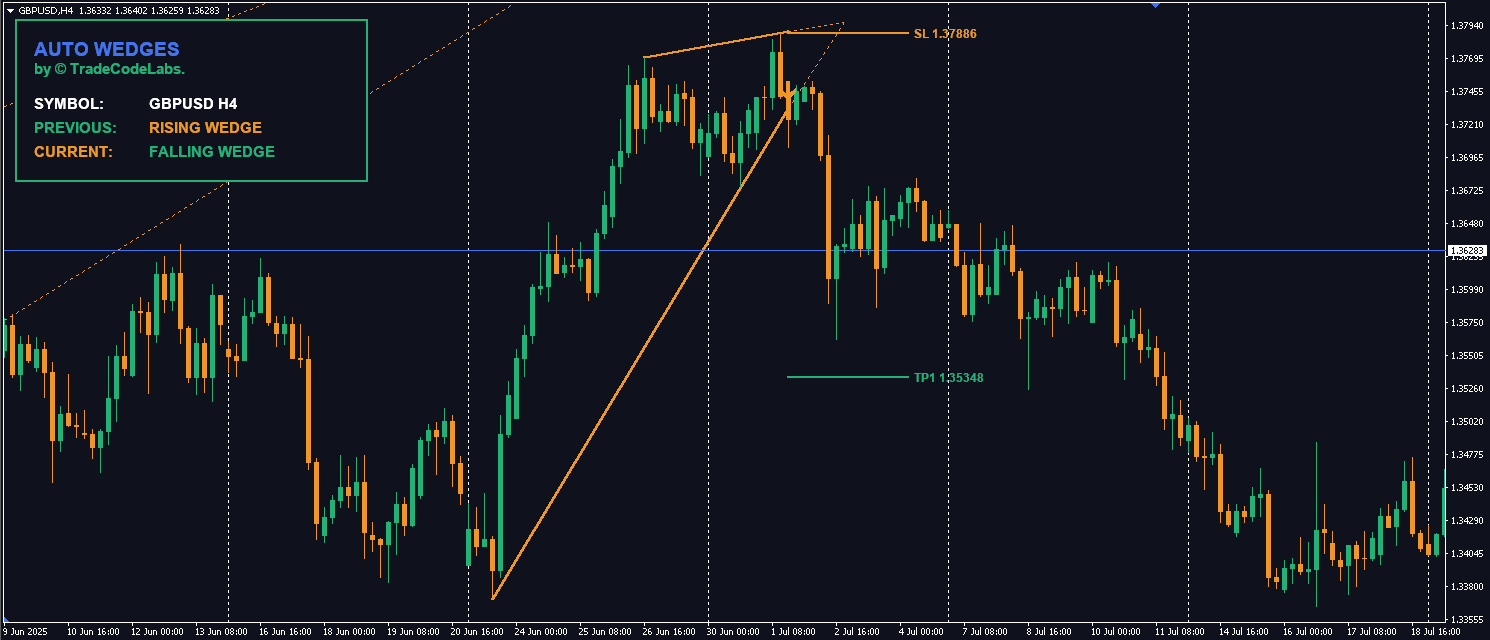
- Auto-draw chart patterns like triangles, wedges, supply and demand zones, and Fibonacci levels
- Generate buy/sell arrows and signals with built-in alert systems (pop-up, email, push notification, Telegram)
- Create visual dashboards that display information from multiple timeframes and pairs simultaneously
- Implement non-repainting logic so signals don’t change after the fact
At TradeCodeLabs, we specialize in building custom MT4 indicators that solve real trading problems — from trend analysis and oscillators to volatility bands, auto-drawn chart patterns, and Fibonacci tools. Every indicator is non-repainting, fully customizable, and includes built-in alert systems.
Browse our full indicator catalog →
How to Install a Custom Indicator on MT4
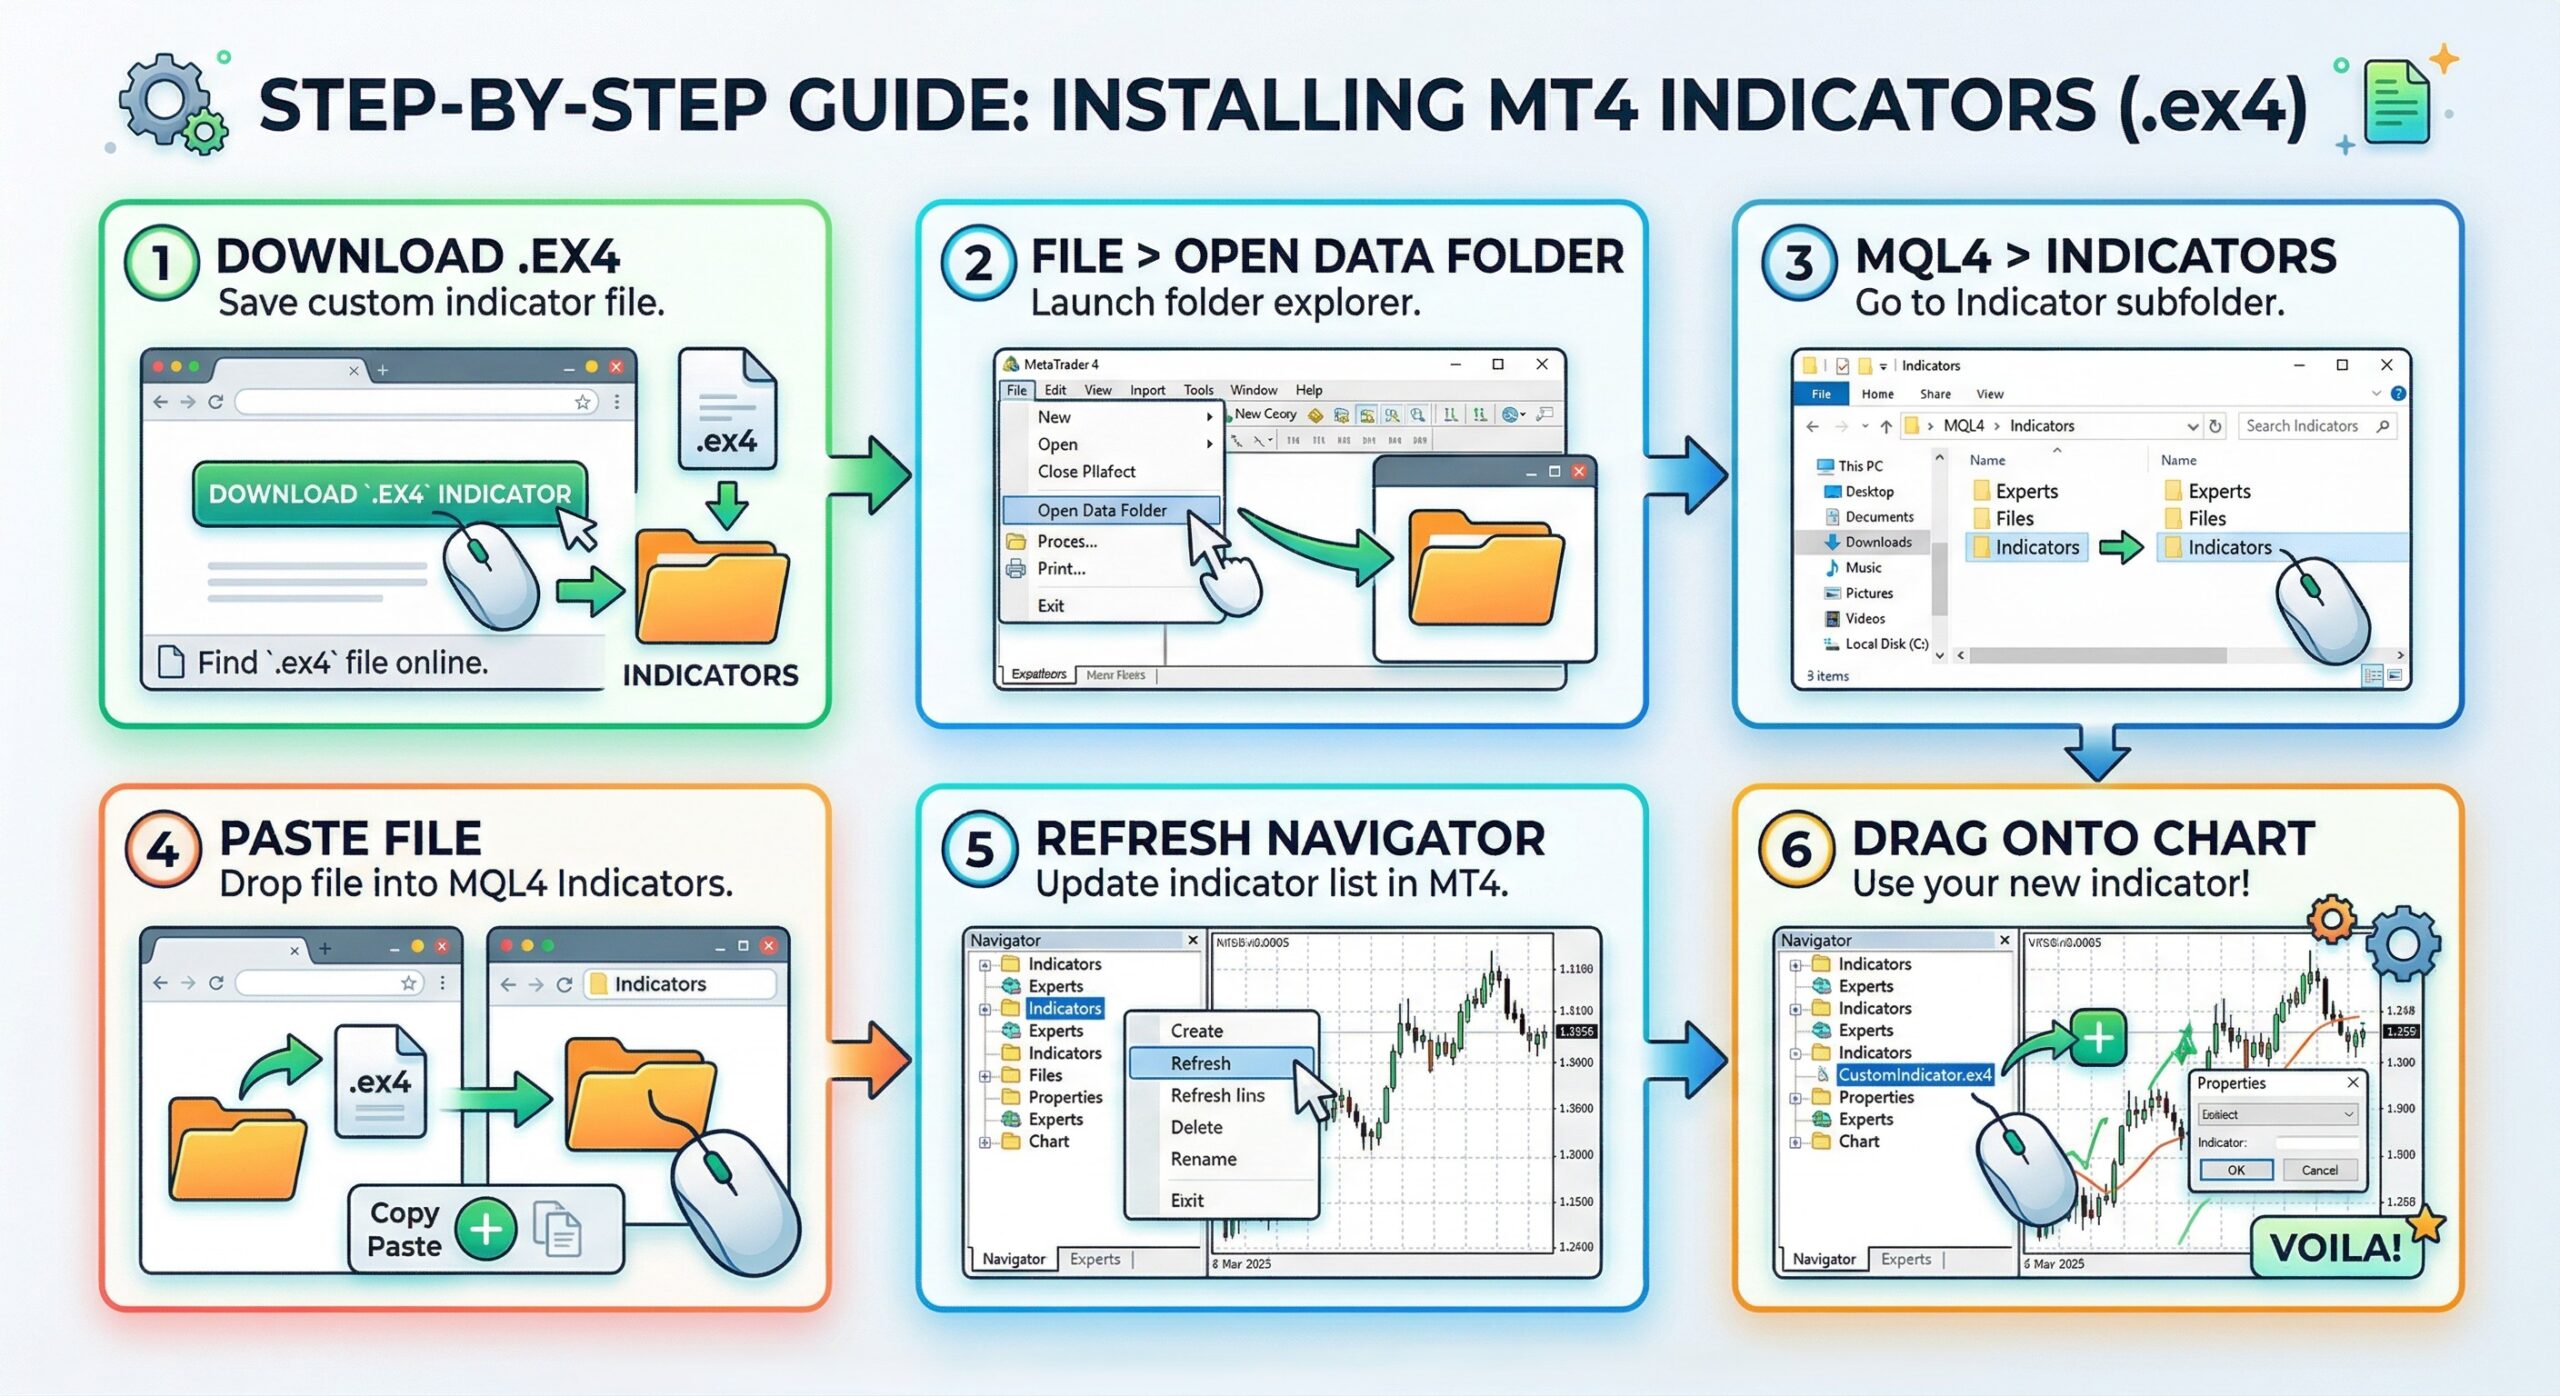
Installing a custom indicator is straightforward:
- 1. Download the indicator file (it will be a `.ex4` or `.mq4` file).
- 2. Open MT4 and go to File > Open Data Folder.
- 3. Navigate to MQL4 > Indicators.
- 4. Paste the downloaded file into the Indicators folder.
- 5. Restart MT4 (or right-click the Navigator panel and select “Refresh”).
- 6. Find your indicator in the Navigator panel under “Indicators” and drag it onto any chart.
For a detailed walkthrough with screenshots, check out our full installation guide →
Related: How to Calculate Position Size in Forex — learn to pair your indicator setups with proper risk management.
The Repainting Problem: What Every Trader Must Know
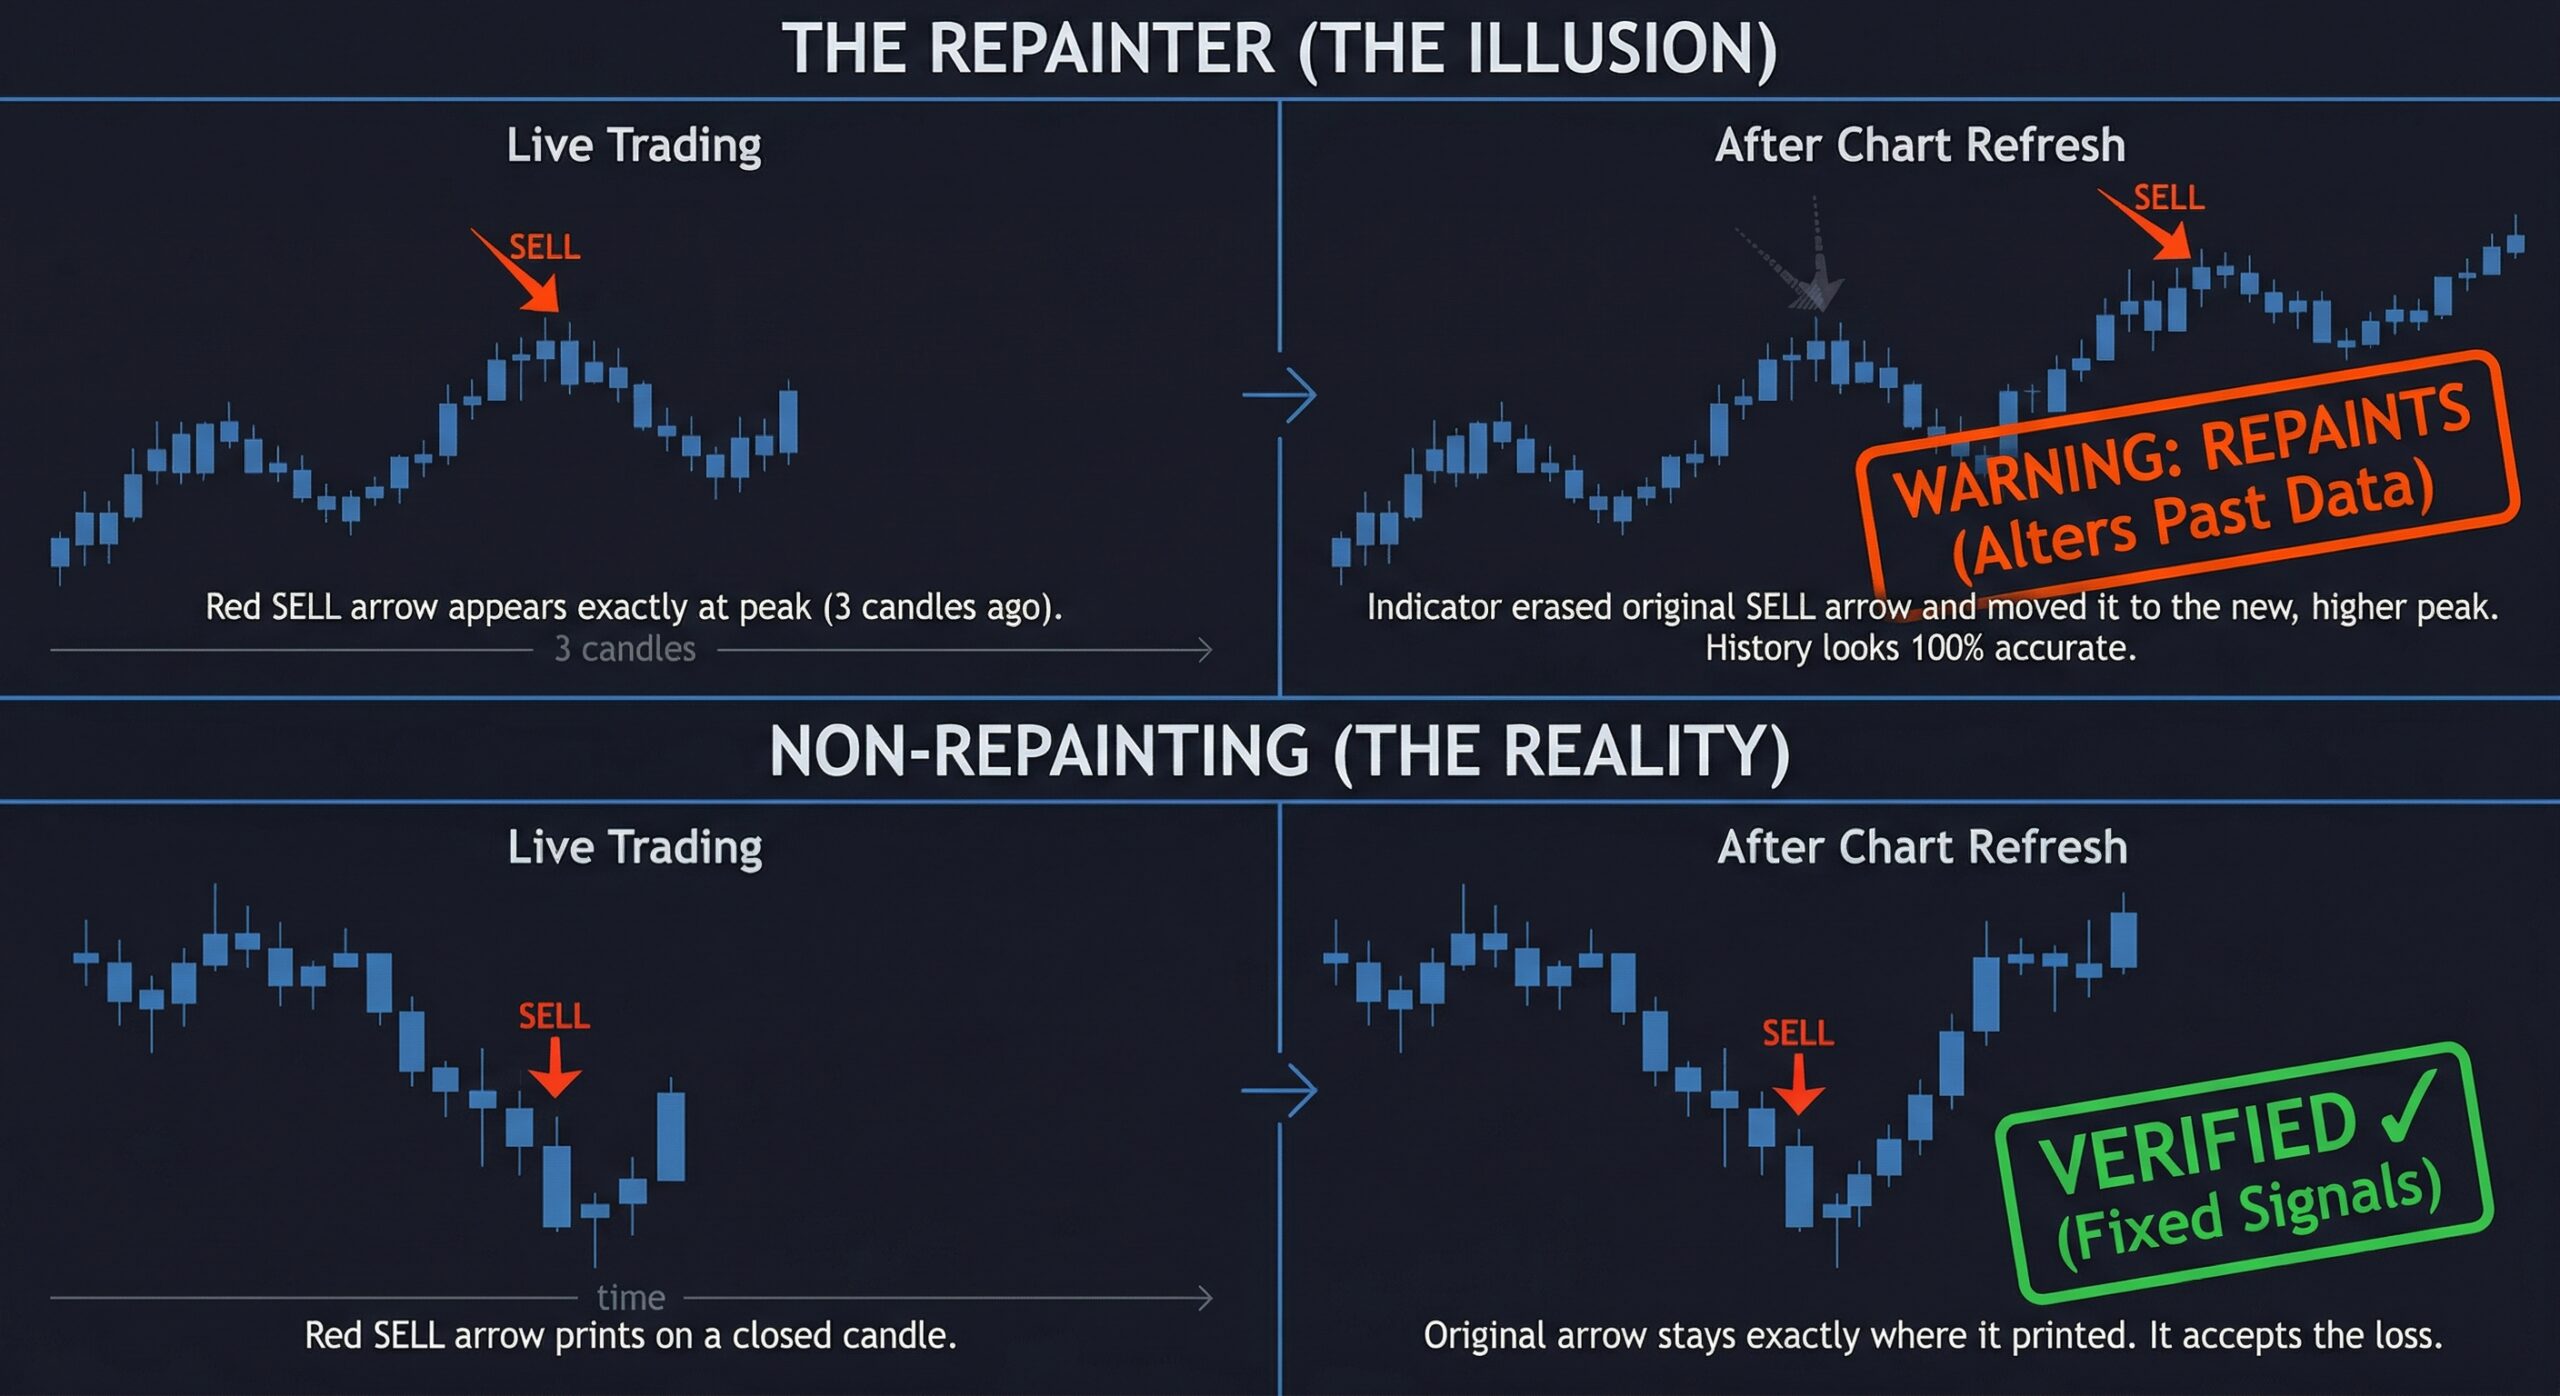
One of the biggest dangers with MT4 indicators — especially free custom ones — is repainting.
A repainting indicator changes its past signals as new data comes in. That arrow that shows a “perfect buy signal” on the chart? It may not have been there when the candle was actually forming. The indicator retroactively places it to make its historical performance look flawless.
How to identify a repainting indicator:
- 1. Apply it to a demo account and watch it in real-time.
- 2. Take screenshots of the current candle’s signal.
- 3. After the candle closes, check if the signal moved, disappeared, or changed.
- 4. If it did — it repaints, and you cannot trust its backtest results.
Non-repainting indicators lock their signals once a candle closes. The signal you see in real-time is the signal that stays forever. This is essential for honest backtesting and reliable live trading.
Every indicator in the TradeCodeLabs catalog is verified non-repainting. We believe transparency is non-negotiable.
7 Common Mistakes Traders Make with Indicators
After years of building indicators and working with traders, we see the same mistakes repeated constantly. Here’s what to avoid:
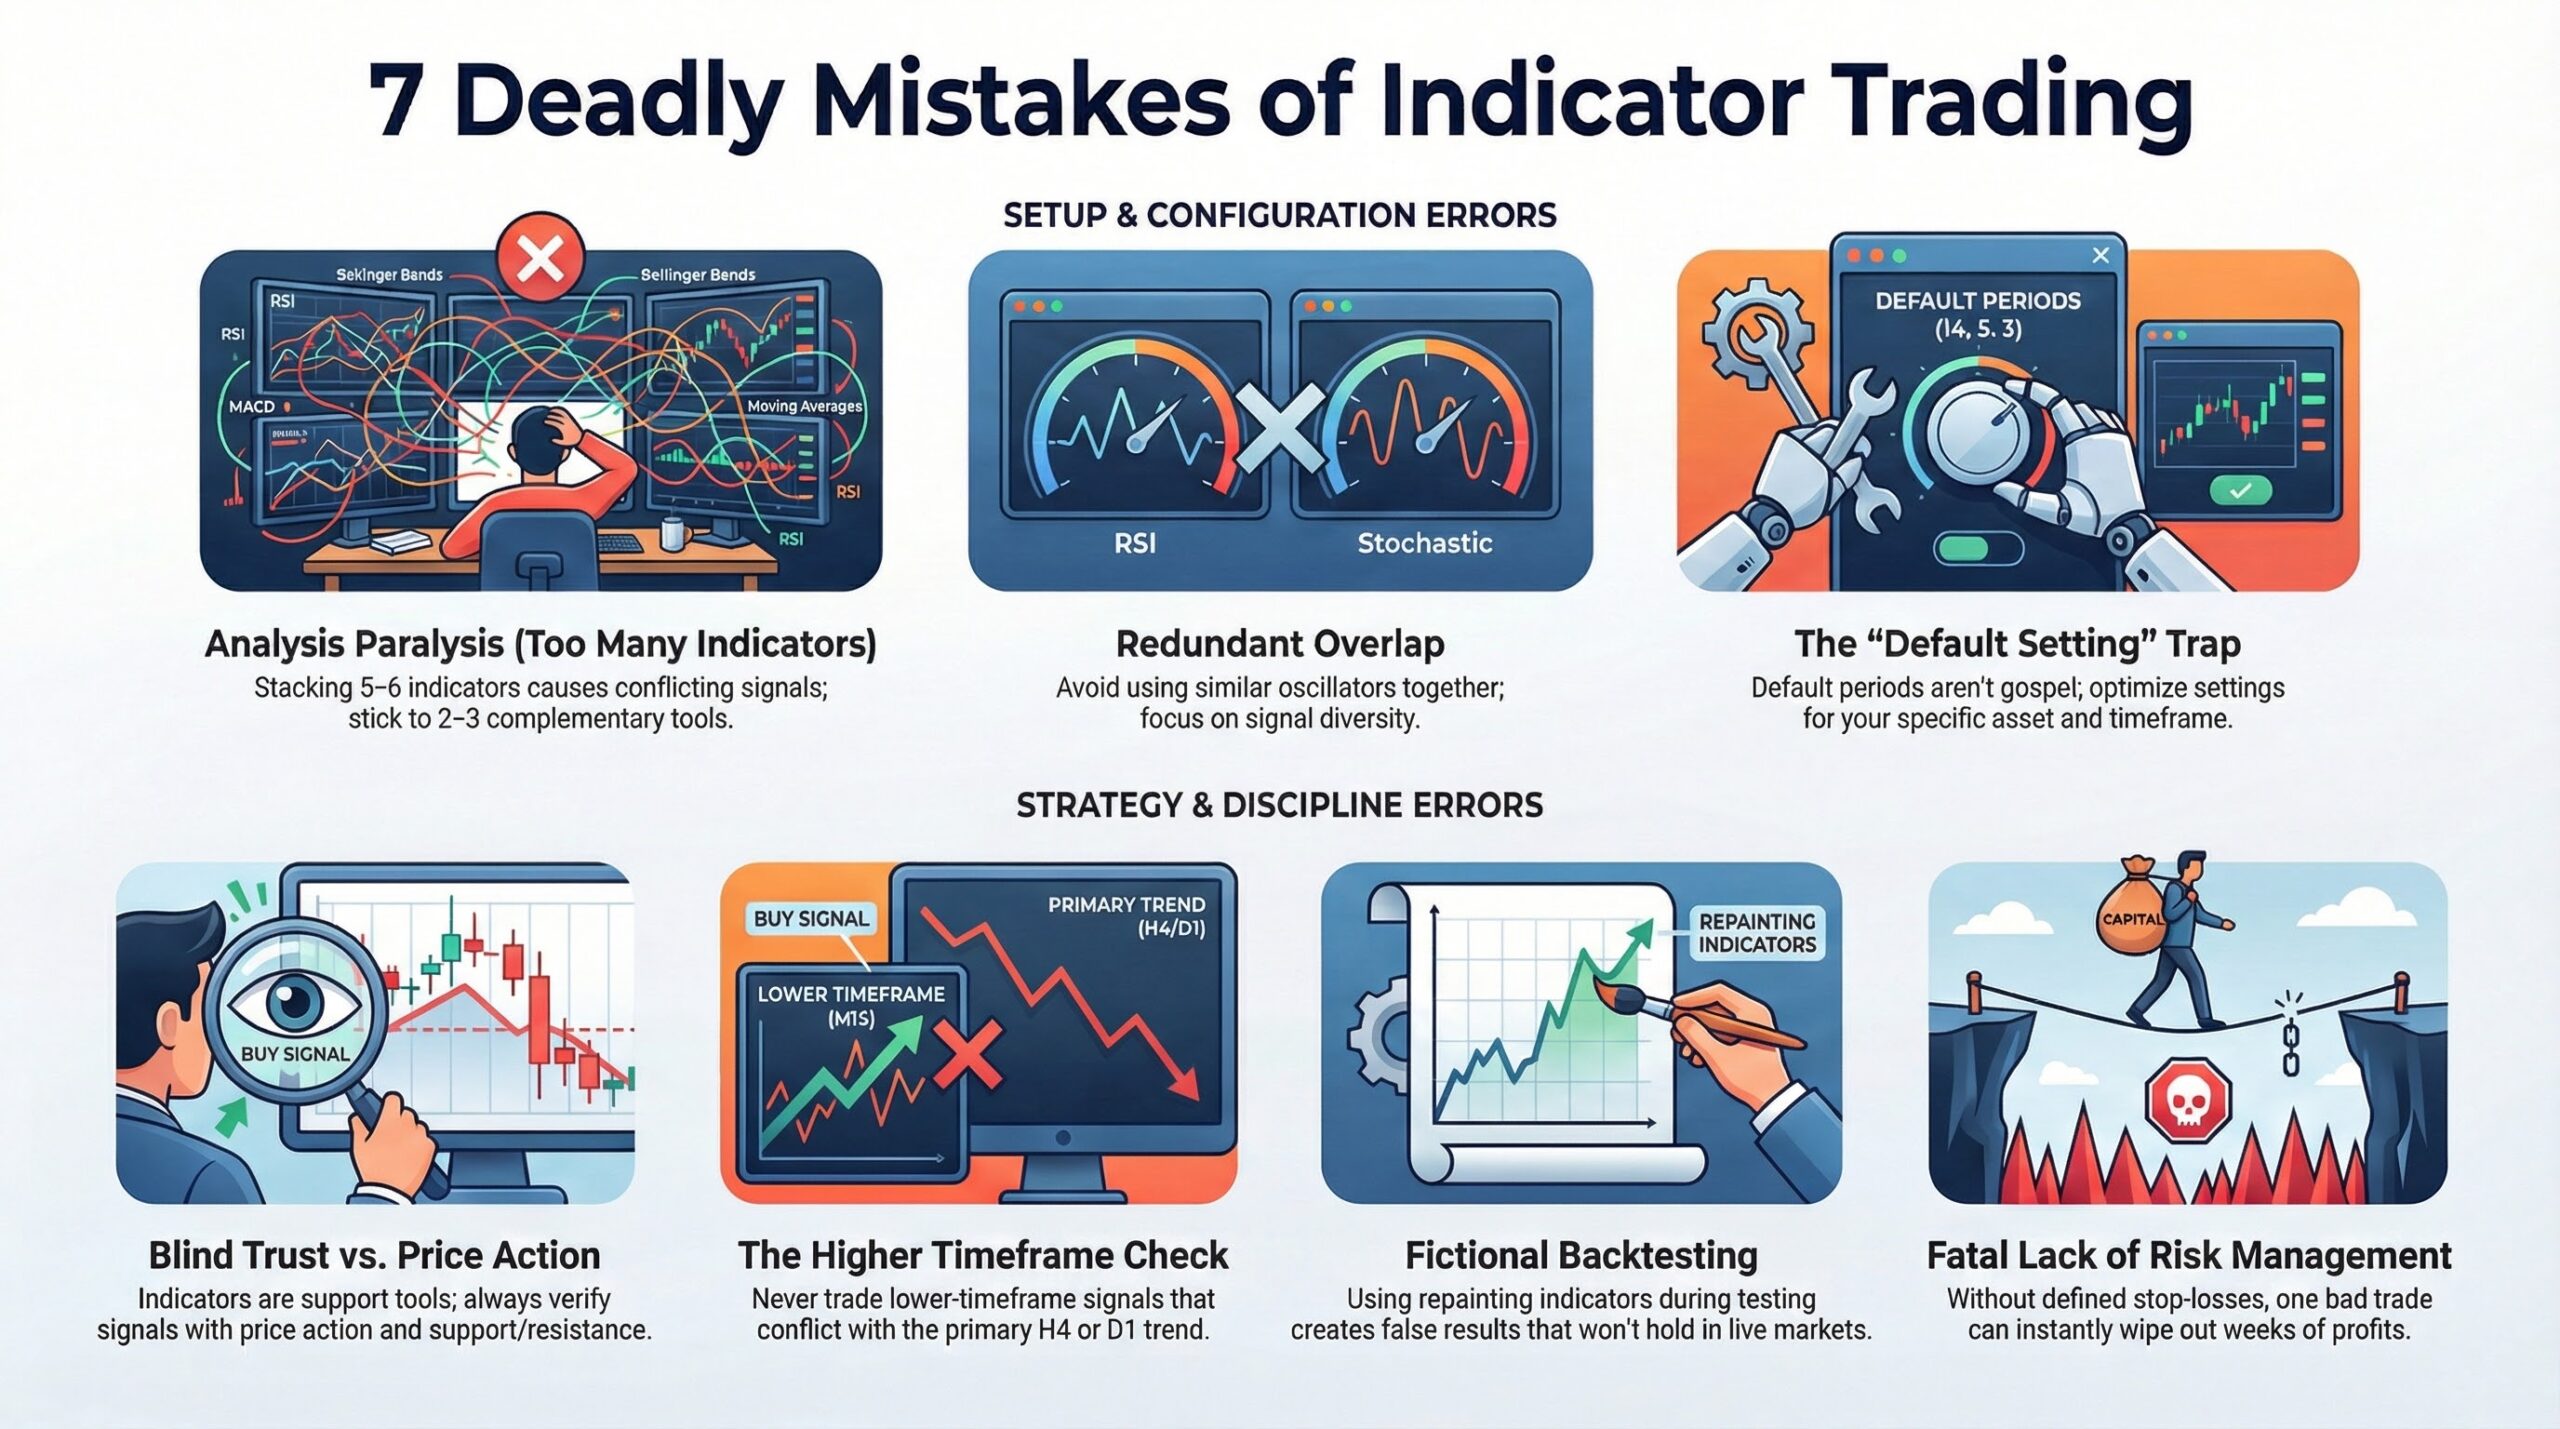
Mistake 1: Using Too Many Indicators
More indicators does not equal better analysis. When you stack 5–6 indicators on a chart, you get conflicting signals, analysis paralysis, and delayed entries. Stick to 2–3 complementary indicators from different categories (e.g., one trend + one momentum + one volatility).
Mistake 2: Using Redundant Indicators
RSI and Stochastic are both momentum oscillators. Using them together gives you the same information twice. Combine indicators from different categories for maximum signal diversity.
Mistake 3: Trusting Indicators Blindly
No indicator is 100% accurate. Indicators are decision-support tools, not decision-makers. Always combine indicator signals with price action context, support/resistance levels, and risk management.
Mistake 4: Ignoring the Higher Timeframe
A buy signal on the M5 chart means nothing if the H4 and D1 charts are in a strong downtrend. Always check the higher timeframe trend before acting on lower-timeframe signals.
Mistake 5: Never Changing Default Settings
Default indicator settings are a starting point, not gospel. A 14-period RSI works differently on a 1-minute chart versus a daily chart. Test and optimize settings for your specific timeframe and asset.
Mistake 6: Using Repainting Indicators for Backtesting
If your indicator repaints, every backtest result is fictional. Only backtest with verified non-repainting indicators.
Mistake 7: No Risk Management
Even the best indicator setup will produce losing trades. Without a defined position size, stop-loss, and risk-per-trade rule, one bad trade can wipe out weeks of profits.
👉 Use our Position Size Calculator to calculate proper lot sizes for every trade.
How to Build an Indicator-Based Trading Strategy
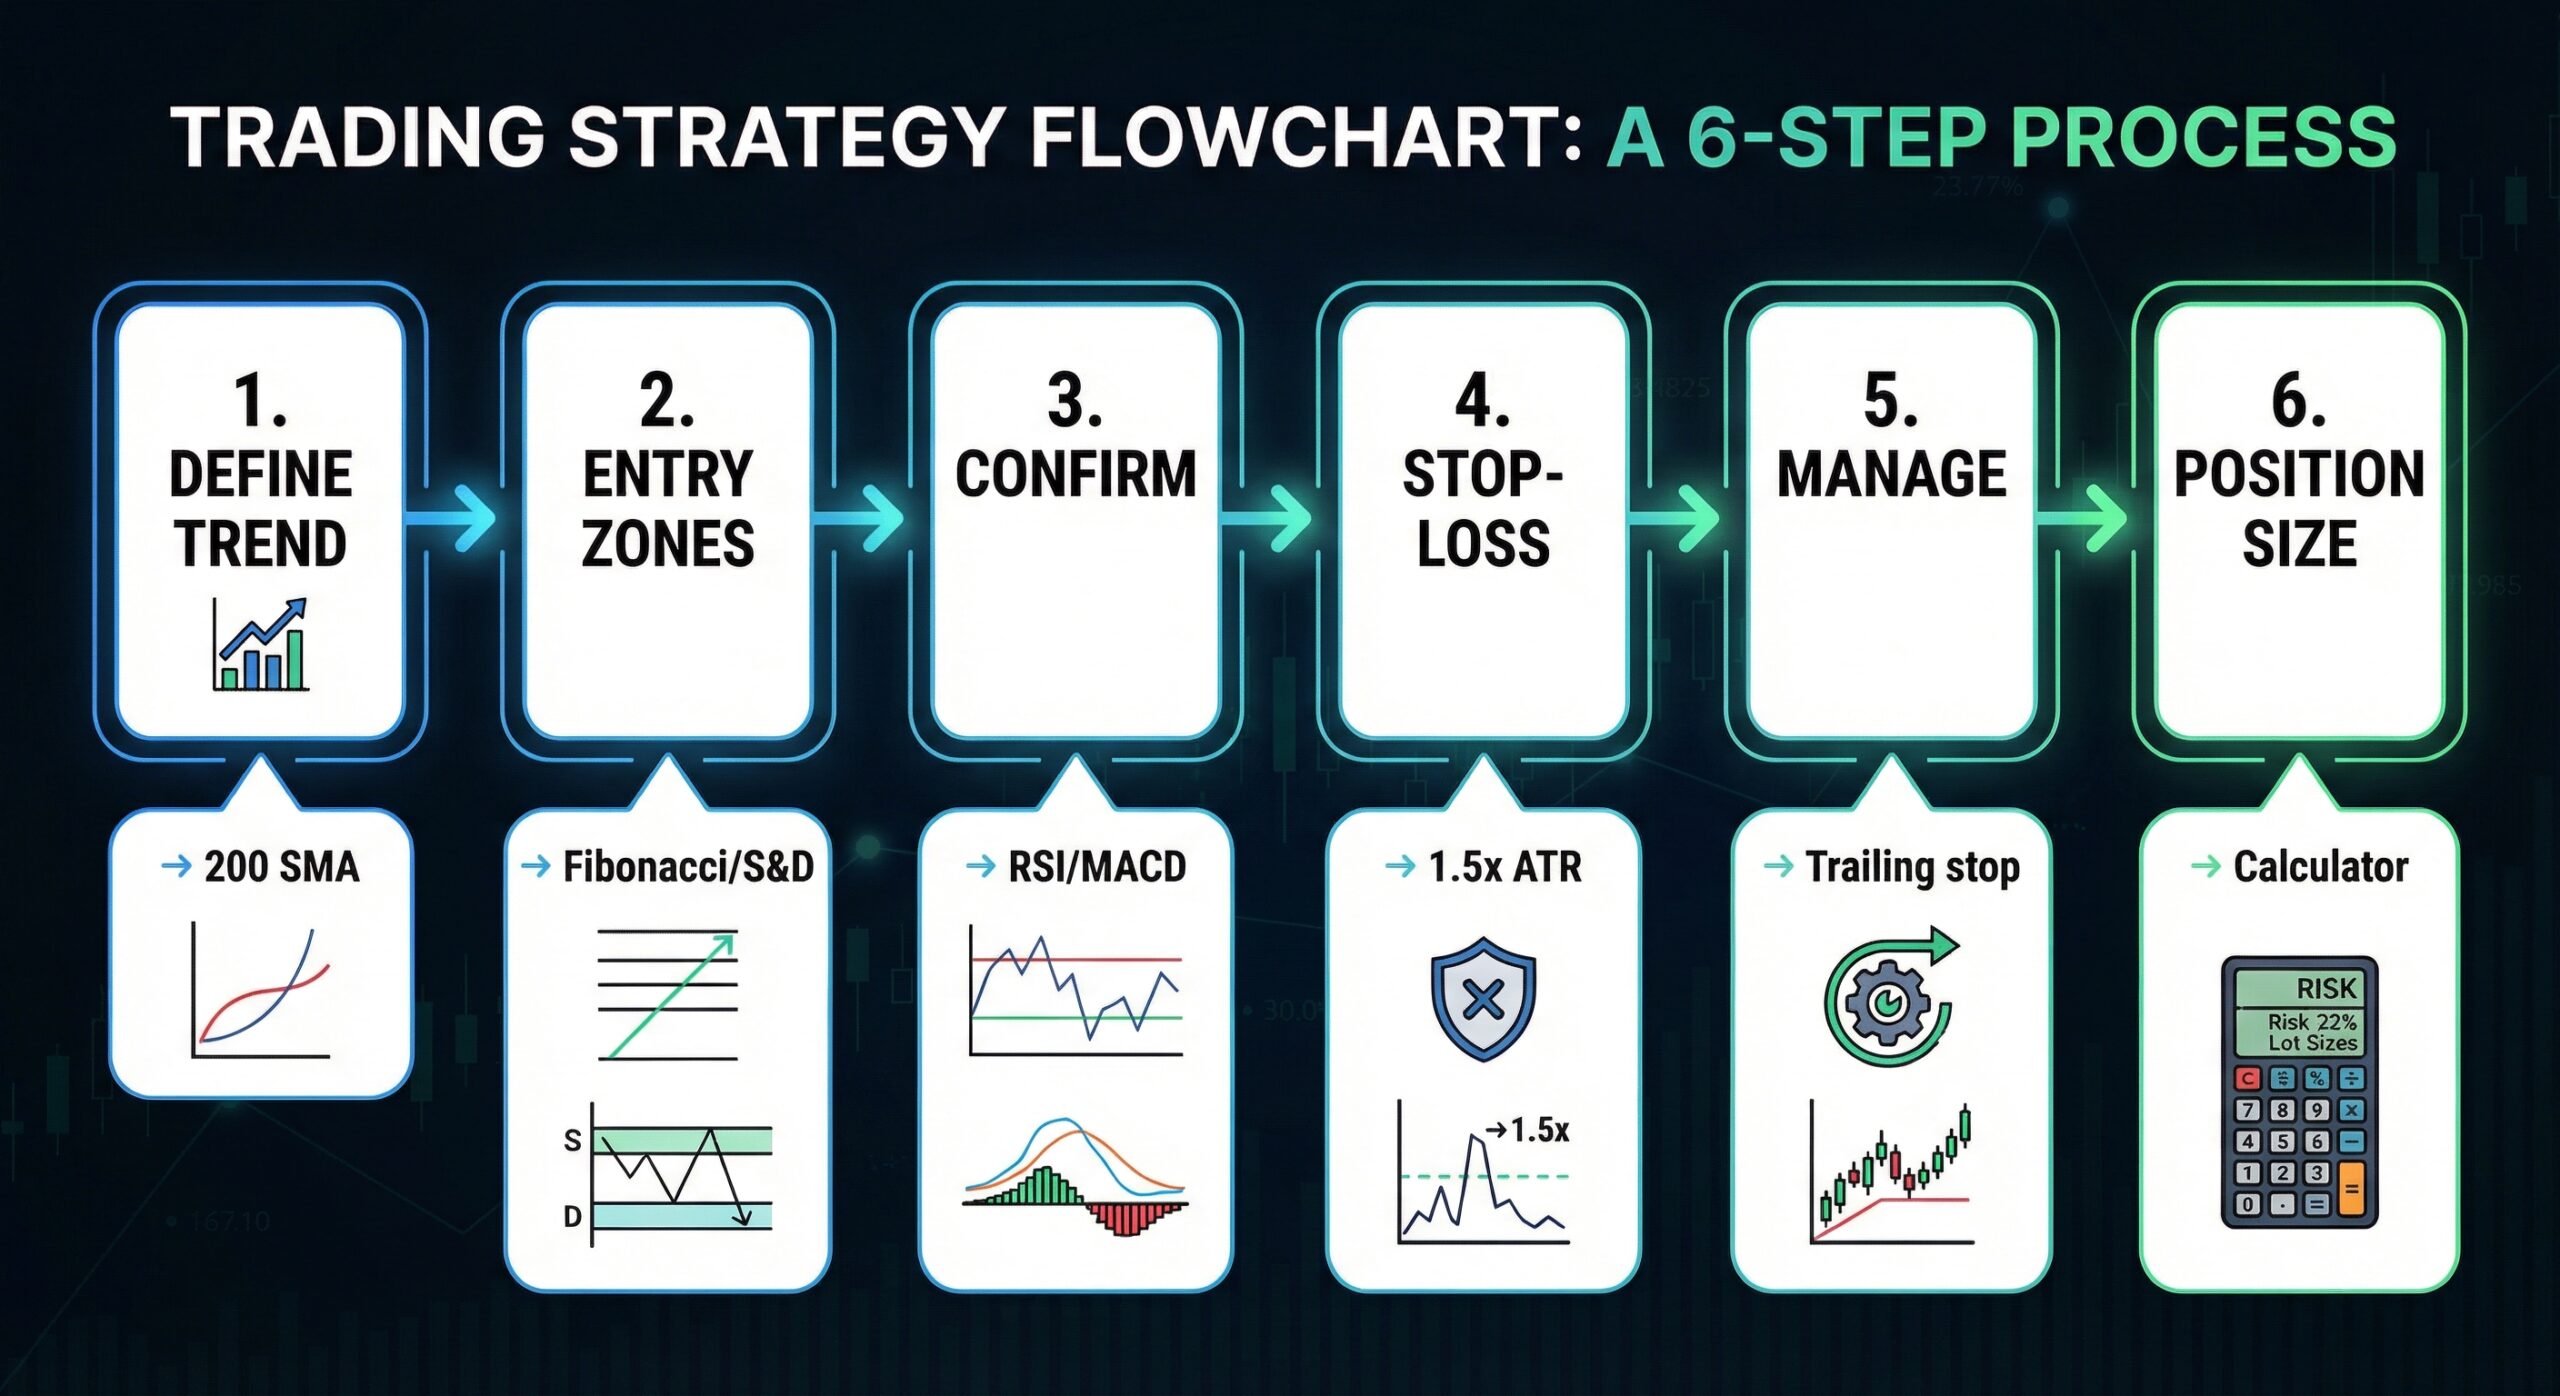
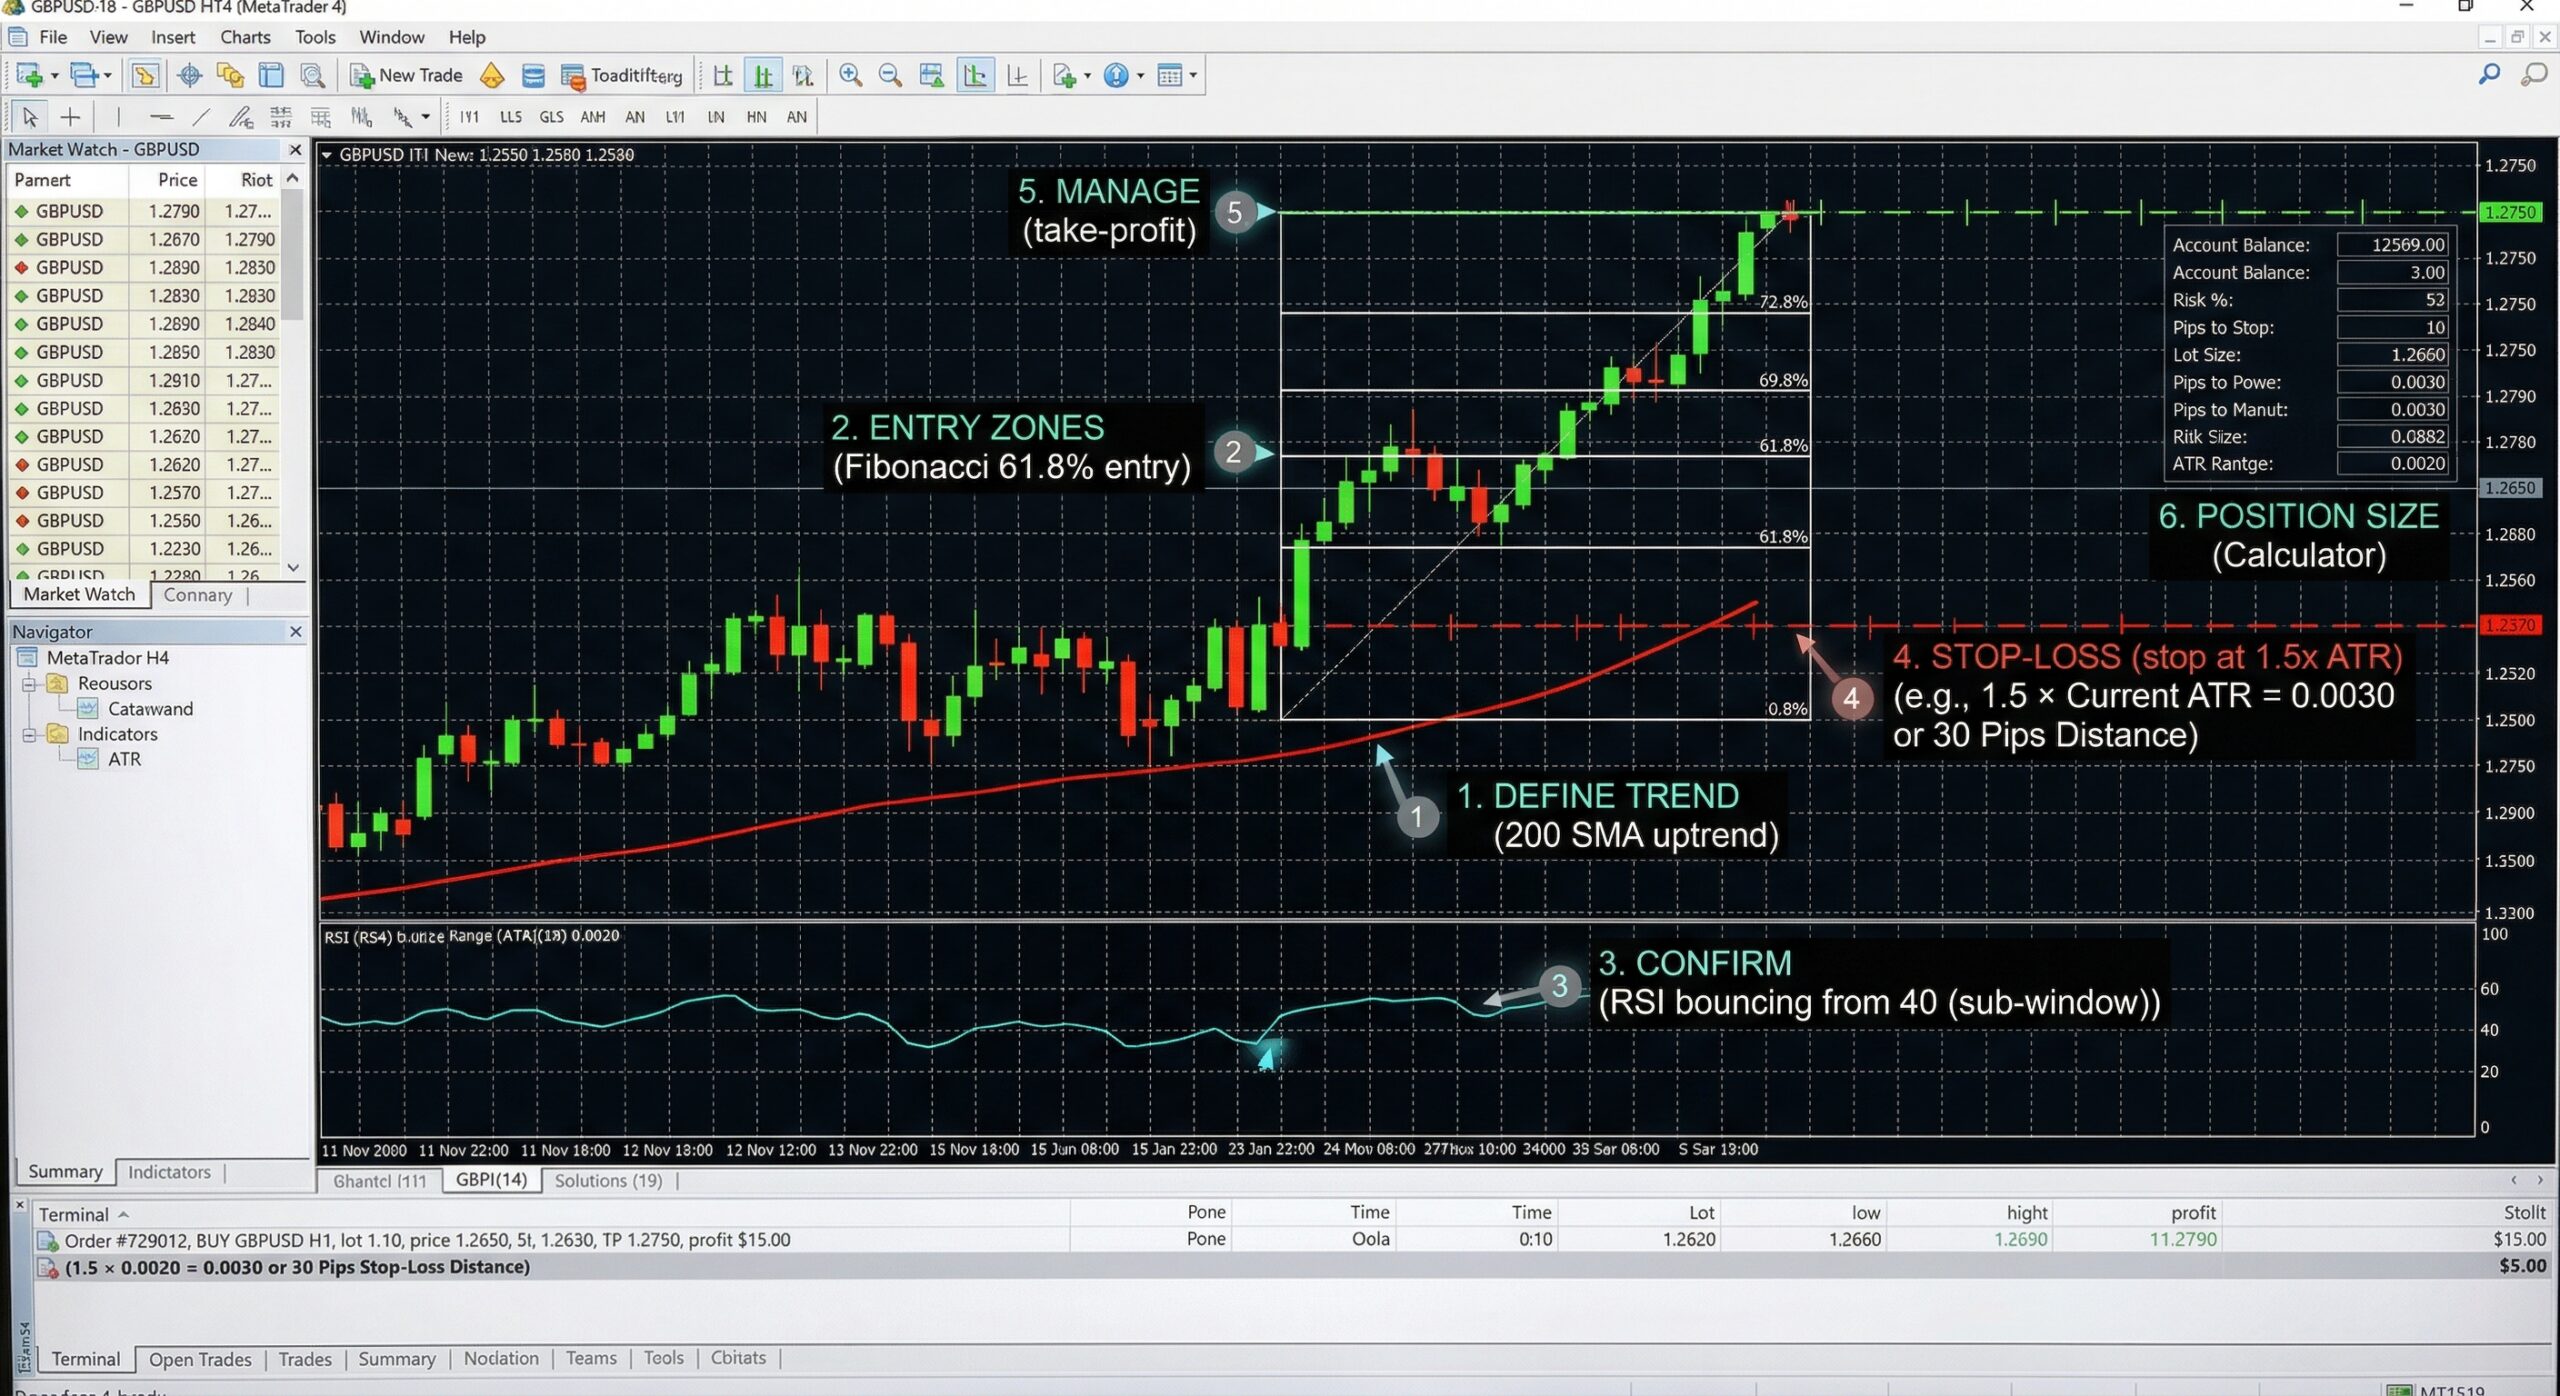
Having indicators on your chart is not a strategy. A strategy is a complete system with rules for entries, exits, stop-losses, and position sizing. Here’s a framework:
Step 1: Define the Trend
Use a trend indicator (e.g., 200 SMA or Ichimoku Cloud) on the higher timeframe (H4 or D1) to determine the overall market direction. Only take trades in the direction of this trend.
Step 2: Identify Entry Zones
Use support/resistance tools (e.g., Fibonacci retracement, supply and demand zones, pivot points) to identify high-probability entry areas where price is likely to react.
Step 3: Confirm with Momentum
Wait for a momentum indicator (e.g., RSI or MACD) to confirm your entry. For example, in an uptrend, wait for RSI to pull back to 40–50 and then turn up before entering long.
Step 4: Set Your Stop-Loss
Use a volatility indicator (e.g., ATR) to set a dynamic stop-loss. A common approach is placing the stop-loss 1.5x ATR below your entry for long positions.
Step 5: Manage the Trade
Use a trailing stop (Parabolic SAR or ATR-based) to lock in profits as the trade moves in your favor.
Step 6: Calculate Position Size
Before entering, use our Position Size Calculator to determine the exact lot size based on your account balance, risk percentage, and stop-loss distance.
MT4 vs. MT5 Indicators: What’s Different?
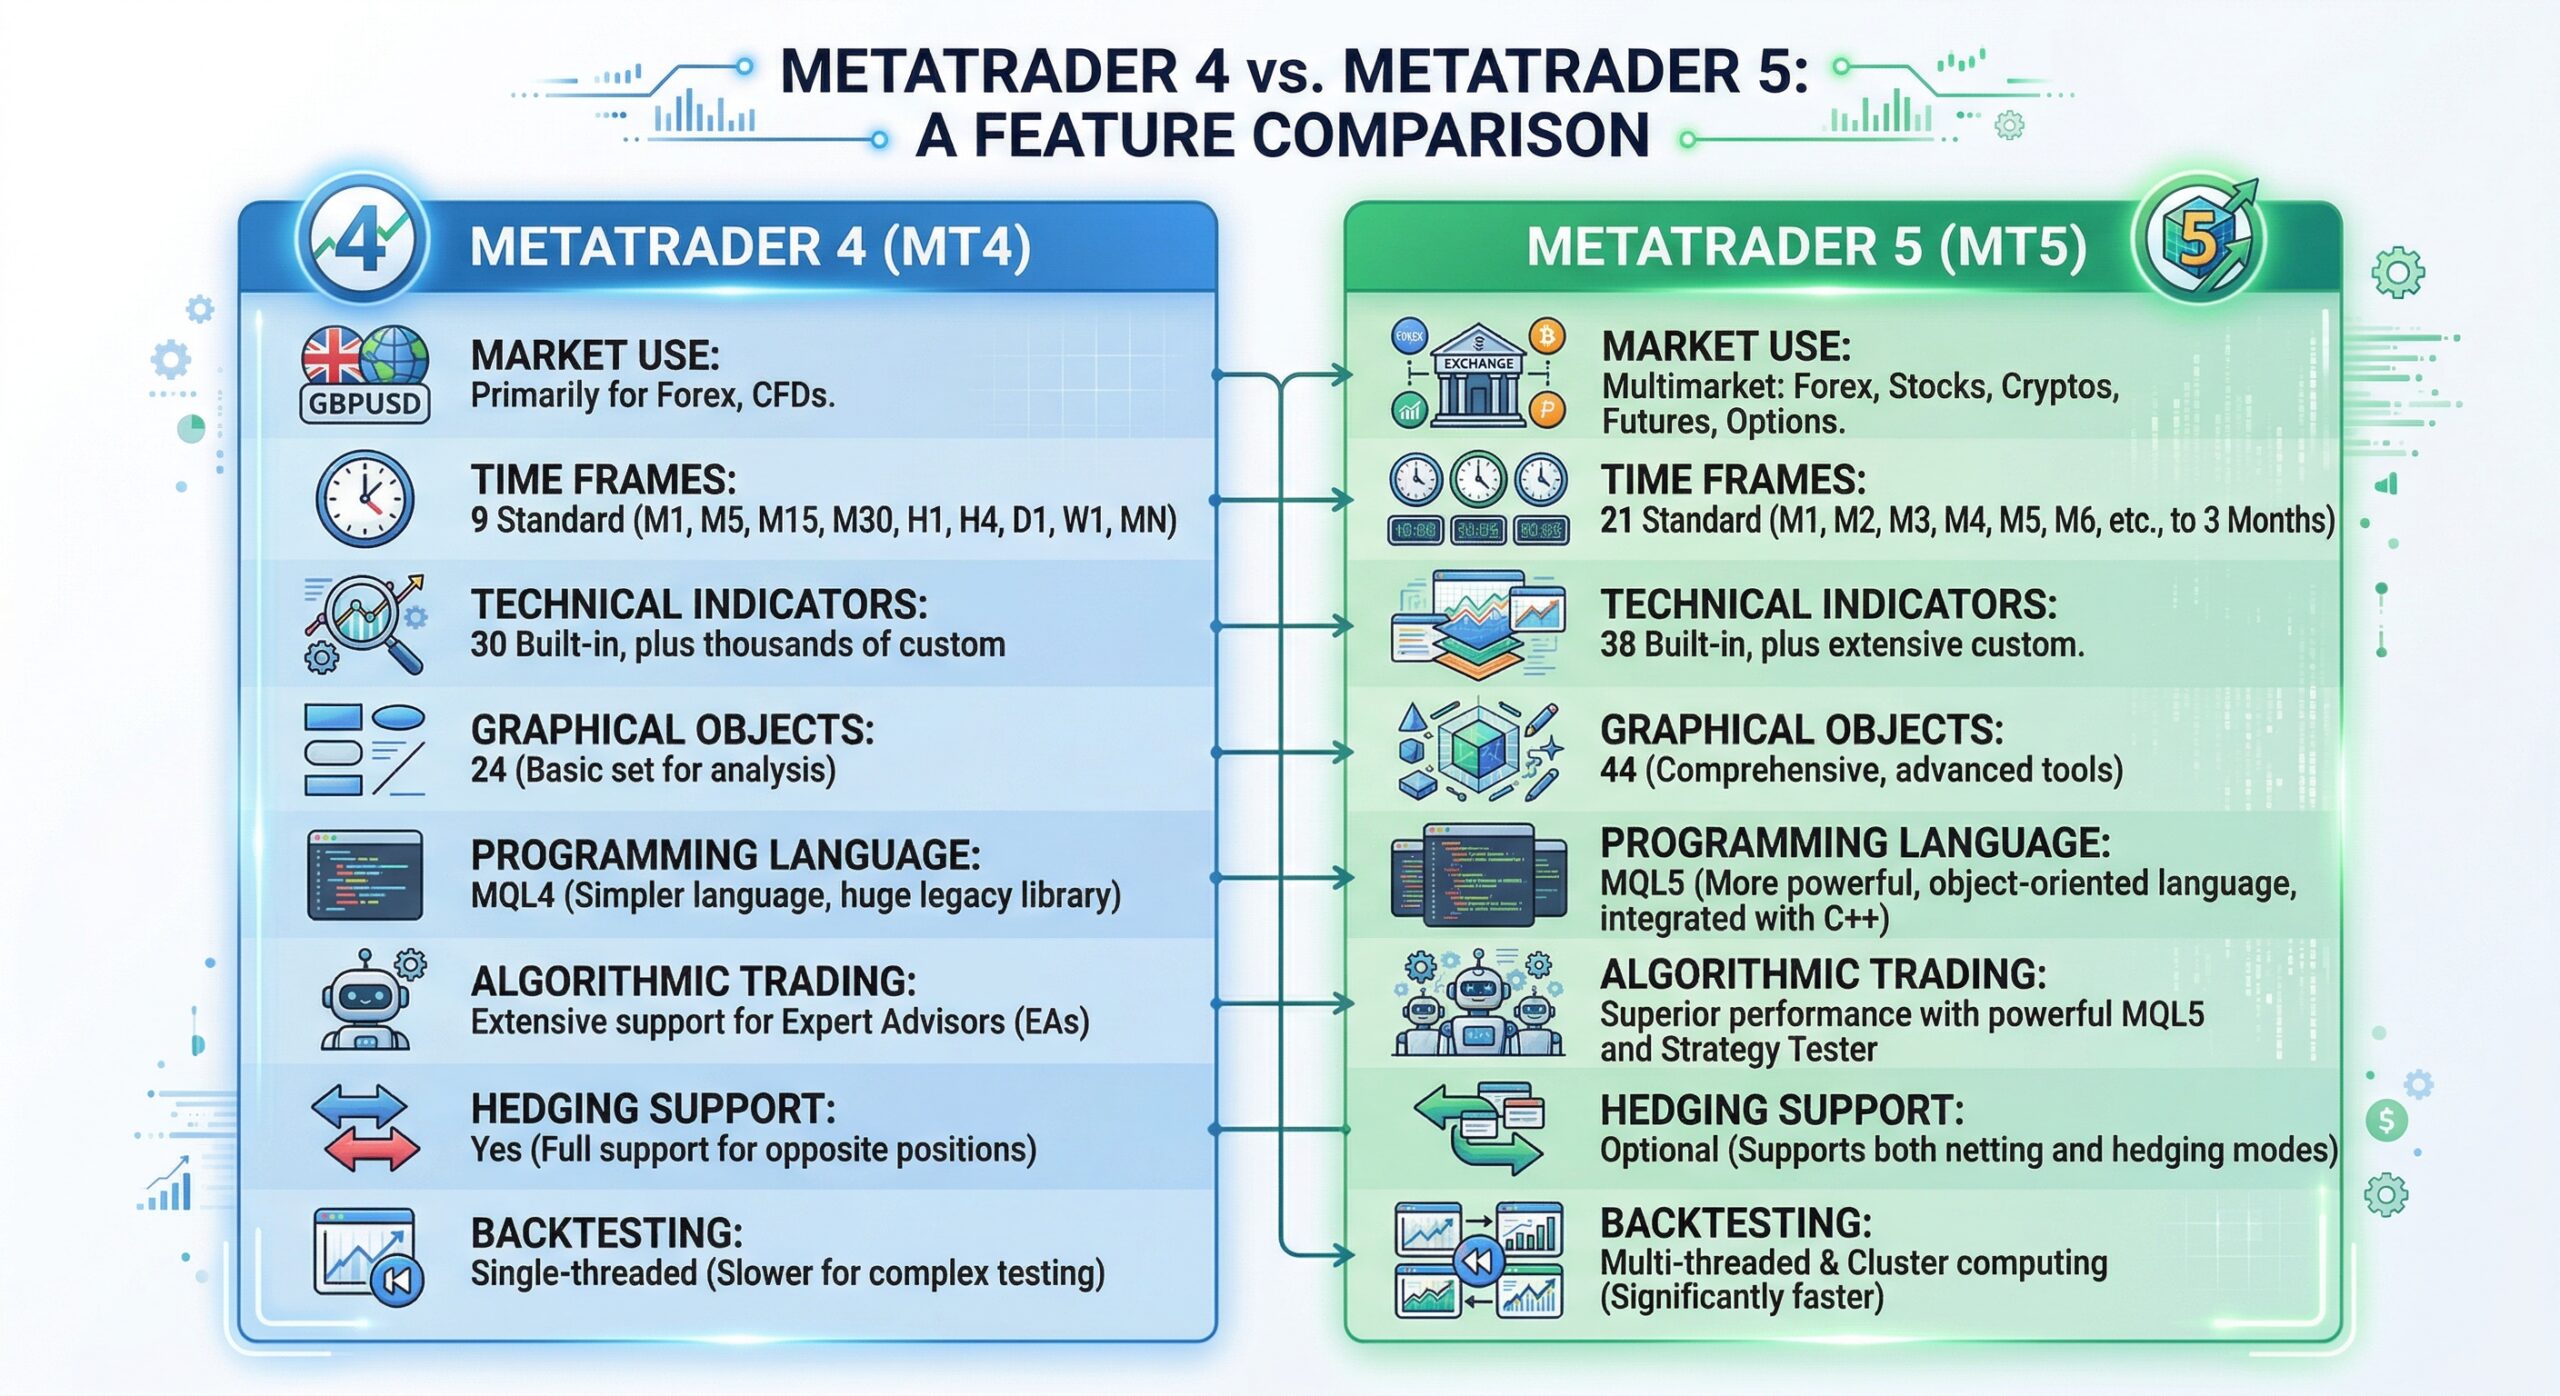
While this guide focuses on MT4, it’s worth understanding how MT5 differs:
| Feature | MT4 | MT5 |
| Programming Language | MQL4 | MQL5 |
| Built-in Indicators | 30+ | 38+ |
| Timeframes | 9 | 21 |
| Hedging Support | Yes (native) | Yes (added later) |
| Custom Indicator Ecosystem | Massive (20+ years) | Growing |
| Strategy Tester | Single-threaded | Multi-threaded |
For most retail forex traders in 2026, MT4 remains the preferred platform due to its massive library of custom indicators, broker support, and proven stability. However, if you need more timeframes or multi-threaded backtesting, MT5 is the way to go.
At TradeCodeLabs, most of our indicators are built for MT4 with MT5 versions available or in development. Check availability →
Frequently Asked Questions
Start Using Better Indicators Today
MT4 indicators are the backbone of [technical analysis](https://www.investopedia.com/terms/t/technicalanalysis.asp) — but only if you use them correctly. To recap:
- ✅ Understand the four categories: Trend, Momentum, Volume, and Volatility
- ✅ Use 2–3 complementary indicators from different categories
- ✅ Always verify that custom indicators are non-repainting
- ✅ Combine indicators with price action, support/resistance, and proper risk management
- ✅ Test everything on a demo account before going live
Ready to upgrade your chart? Browse our free and premium indicators — every tool is non-repainting, fully customizable, and backed by our community-driven development roadmap.
Have a custom strategy you want automated? Request a quote for custom MQL4/MQL5 development.
⚠️ Risk Disclaimer: Trading forex and CFDs involves substantial risk of loss and is not suitable for every investor. Past performance is not indicative of future results. The content on this page is for educational purposes only and should not be considered financial advice. Always trade with capital you can afford to lose and consult a qualified financial advisor before making trading decisions.
No comments yet. Start the conversation!
Leave a Comment