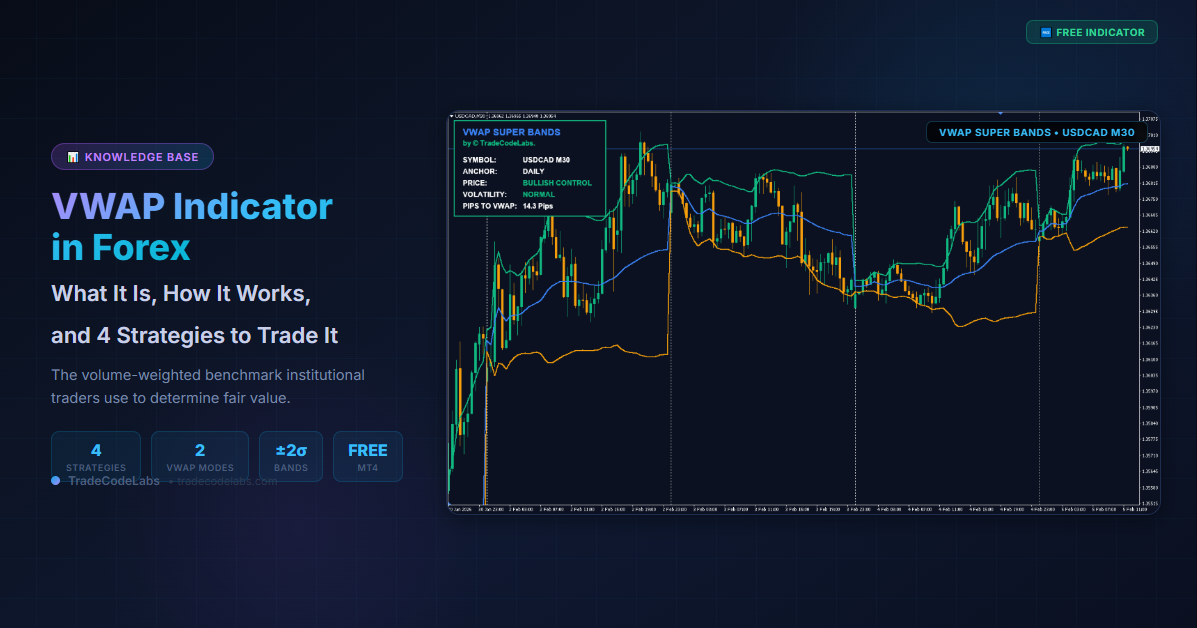
The Volume Weighted Average Price (VWAP) is the benchmark institutional traders use to gauge fair value. Here’s how to use it for smarter entries, better exits, and understanding where the “smart money” is positioned.
Quick Answer: VWAP (Volume Weighted Average Price) calculates the average price of an asset weighted by volume — giving more importance to price levels where heavy trading occurred. Price above VWAP = buyers in control (bullish). Price below VWAP = sellers in control (bearish). Institutions use VWAP to determine if they’re buying at a “fair” price or overpaying. Try the free VWAP indicator →
What Is VWAP in Forex?
VWAP stands for Volume Weighted Average Price. It’s a trading indicator that shows the average price of a currency pair, weighted by trading volume at each price level.
Unlike a standard moving average — which treats every candlestick equally — VWAP gives more weight to candles where higher trading volume occurred. This makes it a more accurate representation of where real money was exchanged during the session.
Why does this matter?
Because volume tells you where institutional traders are active. A moving average might show the average price over the last 20 candles, but it doesn’t know whether those candles had 100 trades or 100,000 trades behind them. VWAP does.
This is why VWAP is considered the gold standard for institutional order execution. Banks, hedge funds, and algorithmic trading systems all compare their execution price to VWAP. If a fund manager buys EUR/USD at a price below VWAP, they’ve bought at a “discount” relative to the market’s volume-weighted consensus.
How Is VWAP Calculated?
The VWAP formula takes the cumulative price × volume and divides it by cumulative volume:
VWAP = Σ (Price × Volume) ÷ Σ (Volume)
For each bar in the session:
- Multiply the typical price (High + Low + Close) ÷ 3 by the volume of that bar
- Add this to a running total (numerator)
- Add the volume to a running total (denominator)
- Divide numerator by denominator
The result is a single line on your chart that dynamically updates throughout the trading day.
Key characteristics of VWAP:
| Feature | What It Means |
|---|---|
| Resets daily | By default, VWAP starts fresh each trading day (daily session mode) |
| Volume-weighted | High-volume bars have more influence than low-volume bars |
| Cumulative | Every bar in the session contributes — it gets smoother as the day progresses |
| Institutional benchmark | Banks and algorithms compare their fills against VWAP |
| Not available in standard MT4 | Requires a custom indicator (MT4 doesn’t include VWAP by default) |
VWAP vs Moving Averages: What’s the Difference?
This is the most common question forex traders ask. Here’s the direct comparison:
| Feature | VWAP | Simple Moving Average (SMA) | Exponential Moving Average (EMA) |
|---|---|---|---|
| Weighting | Volume-weighted | Equal weight to all candles | More weight to recent candles |
| Resets | Daily (or custom anchor) | Continuous | Continuous |
| Best for | Intraday fair value | Trend direction | Trend direction + responsiveness |
| Institutional use | Primary benchmark | Secondary reference | Secondary reference |
| Volume awareness | ✅ Yes | ❌ No | ❌ No |
| What it tells you | “Where was real money exchanged?” | “What was the average price?” | “What’s the recent average price?” |
The key advantage: A 20-period SMA on a 15-minute chart tells you the average price over the last 5 hours — but it doesn’t know if 90% of the volume happened in the first hour. VWAP does. It gives you the volume-adjusted truth about where the market’s fair value sits.
How to Read VWAP on a Chart
Reading VWAP is straightforward once you understand the principle:
Price Above VWAP = Bullish
When price trades above the VWAP line, it means buyers paid more than the average weighted price. This indicates:
- Buyers are in control
- The market considers current prices “acceptable” even at a premium
- Momentum favors longs
- Pullbacks to VWAP are potential buy opportunities
Price Below VWAP = Bearish
When price trades below VWAP:
- Sellers are in control
- The market views current prices as below the weighted consensus
- Momentum favors shorts
- Rallies back to VWAP are potential sell opportunities
Price Crossing VWAP = Potential Shift
A cross from below to above (or vice versa) often signals a shift in intraday control. This is one of the most-watched events by algorithmic trading systems.
4 VWAP Trading Strategies for Forex
Strategy 1: VWAP Mean Reversion (Pull Back to Fair Value)
The concept: Price tends to revert to VWAP because it represents fair value. When price stretches too far above or below VWAP, it becomes “overextended” and often snaps back.
How to trade it:
- Wait for price to move significantly above VWAP (for shorts) or below VWAP (for longs)
- Look for a reversal candle (engulfing, pin bar, or strong directional close) forming AWAY from VWAP
- Enter in the direction of VWAP (the mean)
- Target: VWAP line itself
- Stop loss: Beyond the recent swing high/low
Best for: Ranging or choppy sessions where price oscillates around VWAP. Avoid during strong trend days.
Pro tip: Combine with TCL Auto Supply & Demand zones — if a supply zone aligns with overextension above VWAP, the confluence increases the probability significantly.
Strategy 2: VWAP Trend Continuation (Institutional Alignment)
The concept: In trending markets, VWAP acts as dynamic support (uptrend) or resistance (downtrend). Institutions add to their positions when price dips to VWAP during a trend.
How to trade it:
- Identify a clear trend day — price consistently above VWAP (bullish) or below (bearish)
- Wait for price to pull back and touch VWAP
- Look for a bounce — a bullish reversal candle at VWAP in an uptrend, or bearish at VWAP in a downtrend
- Enter in the direction of the trend
- Target: Previous swing high/low or VWAP band extension
- Stop loss: Below VWAP (for longs) or above VWAP (for shorts)
Key filter: Check the higher timeframe trend using a tool like TCL Trend Radar — only take VWAP bounce trades when H1/H4 agree with your direction.
Strategy 3: VWAP Standard Deviation Bands (Overextension Signals)
The concept: Standard deviation bands around VWAP create dynamic overbought/oversold zones. The ±1σ and ±2σ bands act as statistical extremes — price reaching the outer bands is statistically unlikely to sustain that distance.
How the bands work:
| Band Level | Statistical Meaning | Trading Action |
|---|---|---|
| +2σ (Upper outer) | Price is 2 standard deviations above fair value | Strongly overextended — look for mean reversion shorts |
| +1σ (Upper inner) | Price is 1 SD above fair value | Moderately overextended — take partial profits on longs |
| VWAP (Center) | Fair value — volume-weighted average | Dynamic support/resistance — key decision level |
| -1σ (Lower inner) | Price is 1 SD below fair value | Moderately oversold — watch for buying opportunities |
| -2σ (Lower outer) | Price is 2 SD below fair value | Strongly oversold — look for mean reversion longs |
How to trade it:
- Price touches the -2σ band → look for bullish reversal candle → enter long
- Target: VWAP (center line) or +1σ band
- Stop loss: Below the -2σ band
- Risk:Reward is typically 1:2 or better because the distance from -2σ to VWAP is usually twice the distance from -2σ to beyond the band
Squeeze signal: When the bands contract tightly (the gap between +1σ and -1σ narrows), it signals a volatility squeeze. A breakout is imminent. Watch for the band expansion — the direction of the breakout tells you which way to trade.
Strategy 4: Anchored VWAP (The Institutional Memory Play)
The concept: Standard VWAP resets daily. But what if you could start the VWAP calculation from a specific event — like the last major swing low, a central bank announcement, or the start of the current trend?
That’s Anchored VWAP. Instead of resetting daily, it calculates the volume-weighted average from YOUR chosen starting point.
Why it’s powerful: Anchored VWAP reveals the average price paid since a specific event. If price is above the anchored VWAP from the last swing low, it means everyone who bought since that low is, on average, in profit. They’re unlikely to sell. That’s institutional support.
How to trade it:
- Identify the last major swing low (for uptrend) or swing high (for downtrend) on the D1 chart
- Anchor VWAP to that date
- The anchored VWAP line becomes dynamic support/resistance from that structural point
- When price pulls back to the anchored VWAP → look for reversal → enter with trend
- If price breaks BELOW the anchored VWAP → the “memory” of that swing is broken → trend may be reversing
Pro tip: Anchor VWAP to CPI releases, FOMC decisions, or major NFP candles. The market “remembers” these events, and the anchored VWAP from those points acts as a benchmark for weeks afterward.
Daily VWAP vs Anchored VWAP: When to Use Each
| Use Case | Daily VWAP | Anchored VWAP |
|---|---|---|
| Day trading / scalping | ✅ Primary tool — resets fresh each session | Secondary — use for context from last swing |
| Swing trading | ❌ Resets daily, loses multi-day context | ✅ Primary tool — anchor to last swing point |
| News events | Use for intraday reaction | ✅ Anchor to the news candle → track institutional positioning since the event |
| Trend analysis | Shows intraday bias only | ✅ Shows who’s in control since any point |
| Support/Resistance | Dynamic S/R for current session | Dynamic S/R from structural points |
Why VWAP Works Better in Forex Than You Think
A common critique is: “VWAP needs real volume data, and forex doesn’t have centralized volume.”
This is technically true — forex is decentralized, and MT4 only shows tick volume (number of price changes) rather than actual dollar volume. However, multiple academic studies have shown that tick volume correlates strongly (r > 0.85) with actual volume in forex markets.
Tick volume tells you the frequency of trading activity — and frequency is a reliable proxy for interest and participation. A candle with 5,000 ticks had significantly more activity than one with 500 ticks, even if we don’t know the exact dollar amounts.
Bottom line: VWAP with tick volume isn’t perfect, but it’s close enough to be useful — and it’s exactly what institutional algorithms running on MT4/MT5 use.
How to Use VWAP on MT4
MetaTrader 4 doesn’t include VWAP as a default indicator — you need a custom one. Here’s how:
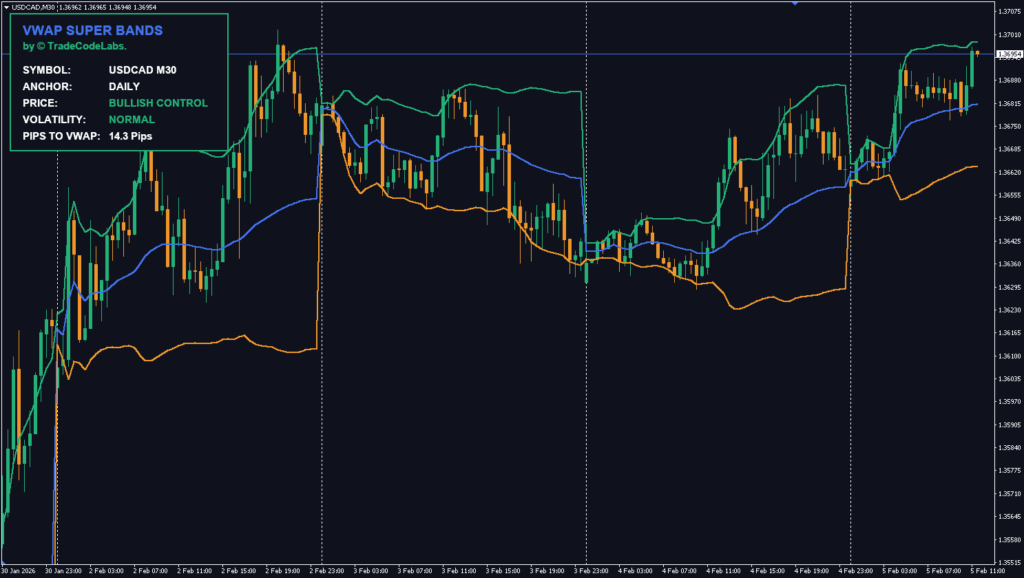
- Download a VWAP indicator — TCL VWAP Super Bands includes both Daily and Anchored modes with standard deviation bands
- Install: Copy the .ex4 file to your MT4 Data Folder → MQL4 → Indicators (full installation guide)
- Attach to chart: Navigator → Custom Indicators → drag TCL VWAP Super Bands onto your chart
- Choose your mode:
- Daily Mode (default): VWAP resets at the start of each trading session
- Custom Anchor Mode: Set any date as your VWAP starting point (e.g., last swing low, FOMC date)
- Read the bands: Center line = VWAP. Upper/lower bands = 1σ and 2σ deviations
Integrating VWAP With Other Indicators
VWAP works best as part of a complete analysis framework. Here’s how to combine it:
| Combine VWAP With | Purpose | How It Helps |
|---|---|---|
| TCL Trend Radar | Multi-timeframe trend confirmation | Only trade VWAP bounces when H1/H4/D1 agree on direction |
| TCL Super RSI | Momentum confirmation | RSI oversold + price at lower VWAP band = high-probability long |
| TCL Auto Fibonacci | Precise entry levels | If VWAP aligns with the 61.8% Fib retracement = strongest confluence |
| TCL Correlation Matrix | Portfolio risk management | Avoid taking VWAP trades on correlated pairs simultaneously |
| TCL Auto Supply & Demand | Zone confirmation | VWAP touching a demand zone = institutional buy area |
Common VWAP Mistakes to Avoid
❌ Using VWAP on Weekly/Monthly Charts
VWAP is designed for intraday analysis in daily mode. On a weekly chart, the daily reset makes it meaningless — you’re only seeing the current day’s data on a weekly perspective. Fix: Use anchored VWAP for multi-day analysis.
❌ Trading VWAP Bounces Against the Trend
VWAP pullback trades only work when the broader trend supports your direction. Buying a “bounce off VWAP” during a strong downtrend is catching a falling knife. Fix: Confirm trend direction on H1/H4 before trading VWAP bounces.
❌ Ignoring the Time of Day
VWAP is most reliable during high-volume sessions (London, New York overlap). During low-volume periods (Asian session for EUR/USD, late NY), the VWAP line carries less statistical weight. Fix: Focus VWAP strategies on the London/NY sessions for major pairs.
❌ Treating VWAP as an Exact Level
VWAP is a zone, not a line. Price doesn’t always bounce from the exact VWAP level — it often overshoots by a few pips. Fix: Treat VWAP as the center of a zone (±5 pips) rather than an exact wall.
Discussion (1)
The Complete Guide to MT4 Indicators: Everything You Need to Know in 2026 - TradeCodeLabs
[…] Balance between responsiveness and noise filtering. VWAP gives you a “fair value” benchmark for the […]
Leave a Comment