The Fibonacci sequence isn’t just math — it’s how markets breathe. Here’s how professional traders use Fibonacci retracements and extensions to find precise entries, stop losses, and take profit levels.
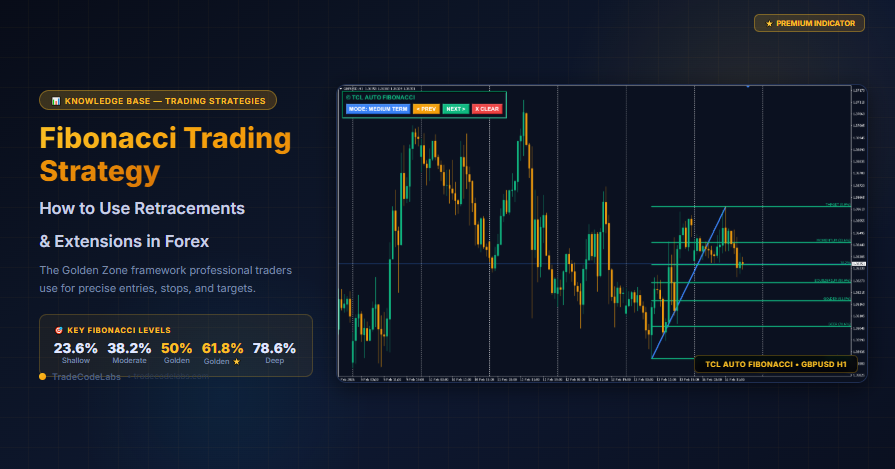
Quick Answer: Fibonacci retracements are horizontal lines drawn between a swing high and swing low that mark potential support/resistance at key ratios — 23.6%, 38.2%, 50%, 61.8%, and 78.6%. The 61.8% level (the “Golden Ratio”) is the most important: when price retraces to 61.8% and bounces, it’s one of the highest-probability continuation setups in trading. Try the free Fibonacci calculator →
What Are Fibonacci Retracements?
Fibonacci retracements are a technical analysis tool based on the Fibonacci sequence — a series of numbers discovered by the Italian mathematician Leonardo Fibonacci in the 13th century: 0, 1, 1, 2, 3, 5, 8, 13, 21, 34, 55, 89, 144…
Each number is the sum of the two before it. The sequence itself isn’t what matters for trading — it’s the ratios between the numbers:
| Ratio | How It’s Derived | Trading Significance |
|---|---|---|
| 23.6% | Divide a number by the one 3 positions ahead | Shallow retracement — strong trend |
| 38.2% | Divide a number by the one 2 positions ahead | Moderate pullback — healthy trend |
| 50.0% | Not a Fibonacci ratio, but widely used | Psychological midpoint |
| 61.8% | Divide a number by the next one (e.g., 89/144) | The Golden Ratio — most reliable level |
| 78.6% | Square root of 61.8% | Deep retracement — last chance for trend survival |
When you draw Fibonacci retracements on a chart, you’re essentially asking: “How far will this pullback go before the trend resumes?”
Why Do Fibonacci Levels Work in Trading?
This is the question every trader asks. There are two schools of thought:
1. Self-Fulfilling Prophecy
Millions of traders watch the same Fibonacci levels. When price approaches 61.8%, thousands of traders place limit orders to buy (in an uptrend). Those orders create actual demand, which causes the bounce. The level works because everyone believes it works — and acts on that belief.
2. Natural Market Rhythm
Markets move in waves. After an impulse move, the market naturally corrects (“takes a breath”) before continuing. The depth of that correction follows mathematical proportions because markets are driven by human psychology, which tends to follow fractal patterns. Fear and greed operate in measurable ratios.
The practical answer? It doesn’t matter why they work. What matters is that they work often enough to build a profitable strategy around them — especially the 50%–61.8% “Golden Zone.”
How to Draw Fibonacci Retracements (Step-by-Step)
Step 1: Identify the Swing Points
Find a clear swing low and swing high (or vice versa for a downtrend):
- In an uptrend: Draw from the swing LOW to the swing HIGH
- In a downtrend: Draw from the swing HIGH to the swing LOW
The tool then automatically plots horizontal lines at each Fibonacci percentage between those two points.
Step 2: Wait for Price to Pull Back
After drawing your Fibonacci levels, wait for price to retrace (pull back against the trend). The key levels to watch are:
- 38.2% — Shallow pullback in a very strong trend
- 50.0% — The “halfway” point — moderate pullback
- 61.8% — The Golden Ratio — deepest normal pullback
- 78.6% — Danger zone — trend may be reversing
Step 3: Look for Confirmation at the Level
Never trade a Fibonacci level alone. The level tells you WHERE to look — but you still need a REASON to enter. Confirmation can be:
- A bullish/bearish reversal candlestick (engulfing, pin bar, hammer)
- An RSI divergence at the Fibonacci level
- A supply/demand zone aligning with the Fibonacci level
- Volume spike at the level
- The level aligning with a moving average
The Golden Zone: 50%–61.8% (Where the Money Is)
If you learn only one thing from this article, let it be this:
The 50%–61.8% zone is where the highest-probability Fibonacci trades happen.
Professional traders call this the “Golden Zone” because:
- It’s deep enough to confirm the pullback is real (not just noise)
- It’s not too deep (unlike 78.6%, which suggests trend weakness)
- Institutional orders cluster here — banks and algorithms place limit orders at these levels
- Risk:Reward is optimal — your stop loss is tight (below 78.6%) and your target is the previous high/low
The framework:
| Where Price Retraces To | What It Tells You | Action |
|---|---|---|
| 23.6%–38.2% | Very shallow — trend is aggressive | Often too shallow to enter safely; may miss the level |
| 38.2%–50% | Moderate — healthy pullback | Good entry if combined with confirmation |
| 50%–61.8% (Golden Zone) | Ideal depth — highest probability zone | Best entries — look for reversal candles here |
| 61.8%–78.6% | Deep — trend is weakening | Higher risk — tighter stop, need strong confirmation |
| Below 78.6% | Very deep — likely trend reversal | Avoid — the trend is probably broken |
4 Fibonacci Trading Strategies
Strategy 1: Golden Zone Pullback Entry (Trend Continuation)
The most reliable Fibonacci strategy. Works in any market and any timeframe.
How to trade it:
- Identify a clear uptrend (higher highs and higher lows)
- Draw Fibonacci from the last swing low to the swing high
- Wait for price to pull back into the 50%–61.8% zone
- Look for a bullish reversal candle (engulfing, pin bar, hammer) inside the zone
- Enter long at the close of the reversal candle
- Stop loss: Below the 78.6% level (gives the trade room to breathe)
- Take profit 1: Previous swing high (1:1 risk:reward minimum)
- Take profit 2: 161.8% Fibonacci extension (for runners)
For downtrends: Reverse everything — draw from swing high to swing low, wait for a pullback UP into 50%–61.8%, look for a bearish reversal candle.
Pro tip: Combine with TCL Auto Supply & Demand — when a supply/demand zone aligns with the Golden Zone, the confluence is extremely strong.
Strategy 2: Fibonacci + RSI Divergence (Reversal Confirmation)
Adds a momentum filter to increase the probability of your Fibonacci trade.
How to trade it:
- Price retraces to the Golden Zone (50%–61.8%)
- Check RSI at the same time
- If price makes a lower low but RSI makes a higher low = bullish divergence
- This divergence at a Fibonacci level is a high-conviction long signal
- Enter on the candle that confirms the divergence
- Stop loss below the 78.6% level
- Target the previous swing high
Why it works: RSI divergence tells you that selling momentum is exhausting — even though price is still dropping, each push lower is weaker than the last. When this happens at a Fibonacci support level, the bounce is often violent and fast.
Pair with TCL Super RSI for auto-adaptive RSI that adjusts its period to your timeframe.
Strategy 3: Fibonacci Extensions for Take Profit Targets
Most traders know how to use Fibonacci for entries but forget about exits. Fibonacci extensions project where the trend is likely to go AFTER the pullback ends.
Key extension levels:
| Extension Level | What It Means | How to Use |
|---|---|---|
| 100% | Price has moved the same distance as the original swing | Conservative take profit |
| 127.2% | First extension target | Good for partial profit |
| 161.8% | The Golden Extension — most common trend target | Primary take profit target |
| 200% | Double the original move | Aggressive — only in very strong trends |
| 261.8% | Rare — explosive moves only | Trail your stop, let it ride |
How to set take profit using extensions:
- Draw Fibonacci retracement on the impulse move
- Price retraces to the Golden Zone and bounces
- The 161.8% extension level = your primary take profit
- Move your stop to breakeven when price reaches 127.2%
- Trail your stop if price pushes toward 200%–261.8%
Strategy 4: Multi-Timeframe Fibonacci (Top-Down Approach)
The institutional approach — use higher timeframe Fibonacci for the big picture, then lower timeframe for precision entries.
How to trade it:
- H4/D1 chart: Draw Fibonacci on the major swing to find where the big pullback zone is
- H1 chart: Wait for price to enter the H4 Golden Zone
- M15/M5 chart: Draw another Fibonacci on the smaller timeframe swing within the zone
- Enter at the M15 Golden Zone that’s INSIDE the H4 Golden Zone
- This gives you institutional-level precision with scalper-level entries
Example:
- D1 Fibonacci shows price is pulling back to the 61.8% level at 1.0850
- On the M15, there’s a small bullish impulse from 1.0840 to 1.0870
- M15 Fibonacci shows the 50% retracement of that small move is at 1.0855
- You enter long at 1.0855 — inside both the D1 Golden Zone AND the M15 Golden Zone
- Your stop is tiny (below 1.0835) but your target is the D1 swing high
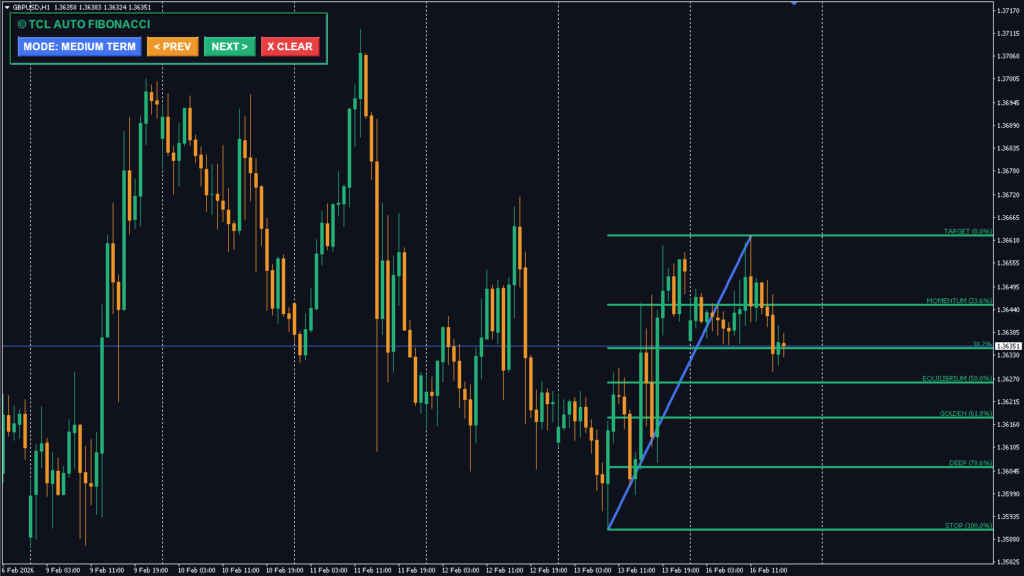
Pro tip: TCL Auto Fibonacci has three modes specifically for this — Short Term (Depth 12) for scalping entries, Medium Term (Depth 36) for day trading, and Long Term (Depth 144) for the swing structure. Switch modes on-chart with one click.
Common Fibonacci Mistakes
❌ Mistake #1: Drawing From the Wrong Swing Points
The biggest mistake. If you pick the wrong swing high or swing low, every Fibonacci level will be wrong.
Fix: Use significant swing points — not minor “bumps.” The swing should be clearly visible without zooming in. Look for swings that broke structure (higher high / lower low).
❌ Mistake #2: Trading a Fibonacci Level Without Confirmation
The 61.8% level is a zone, not a wall. Price won’t always bounce there. Without confirmation (reversal candle, divergence, or volume), you’re gambling.
Fix: The Fibonacci level tells you WHERE to look. The confirmation tells you WHEN to enter. Never enter just because price touched a Fibonacci level.
❌ Mistake #3: Ignoring the Trend
Fibonacci retracements are a trend continuation tool. They don’t work in ranging markets. If there’s no clear trend, Fibonacci levels are meaningless.
Fix: Confirm the trend first. Use a trend radar or check if higher timeframes show clear directional structure before drawing Fibonacci.
❌ Mistake #4: Using Only One Timeframe
A 61.8% level on M5 is meaningless if the D1 trend doesn’t support it. Always check the higher timeframe context.
Fix: Draw Fibonacci on H4/D1 first, then use M15/H1 for entries. Only trade Fibonacci levels that align across multiple timeframes.
❌ Mistake #5: Forcing Fibonacci on Every Move
Not every swing deserves a Fibonacci drawing. Choppy, sideways price action with no clear impulse move will produce unreliable levels.
Fix: Only draw Fibonacci on impulsive moves with clear momentum. If the move looks choppy, skip it. TCL Auto Fibonacci has an ADX smart filter that automatically hides Fibonacci during flat markets — only showing levels when there’s actual trend strength.
Fibonacci Retracement vs Extension: When to Use Each
| Feature | Fibonacci Retracement | Fibonacci Extension |
|---|---|---|
| Purpose | Find where a pullback might END | Find where a trend might GO |
| Key Levels | 23.6%, 38.2%, 50%, 61.8%, 78.6% | 127.2%, 161.8%, 200%, 261.8% |
| Used For | Entry levels (where to enter) | Take profit levels (where to exit) |
| When to Draw | During a pullback against the trend | After a pullback bounces |
| Most Important Level | 61.8% (Golden Ratio) | 161.8% (Golden Extension) |
How to Use Fibonacci on MT4
MetaTrader 4 has built-in Fibonacci tools, but drawing them manually has problems — picking the wrong anchor points, forgetting to adjust for different timeframes, and cluttering your chart with outdated levels.
Using TCL Auto Fibonacci:
- Install: Download from TCL Auto Fibonacci and install via MT4 → MQL4 → Indicators (installation guide)
- Choose your mode:
- Short Term (Depth 12): For scalping — finds micro-swings
- Medium Term (Depth 36): For day trading — finds session swings
- Long Term (Depth 144): For swing trading — finds major structural swings
- Read the levels: 0% = swing start, 100% = swing end, Golden Zone highlighted
- Browse history: Use PREV/NEXT buttons to scroll through past Fibonacci legs for backtesting
- ADX filter: Enable to only show Fibonacci during trending conditions (ADX > 20)
Pro tip: Start with Medium Term on H1 for the overall structure, then switch to Short Term on M5 for precise entries within the Golden Zone. This multi-depth approach gives you institutional-level Fibonacci analysis.
Integrating Fibonacci With Other Tools
| Combine Fibonacci With | Purpose | Confluence Example |
|---|---|---|
| TCL Auto Supply & Demand | Zone confirmation | Demand zone at 61.8% = strong buy area |
| TCL Super RSI | Momentum confirmation | RSI divergence at Golden Zone = high conviction |
| TCL VWAP Super Bands | Fair value alignment | VWAP at 50% Fibonacci = institutional confluence |
| TCL Trend Radar | Trend confirmation | Only trade Fibonacci when H4/D1 trend agrees |
| Position Size Calculator | Risk management | Calculate exact lot size based on SL below 78.6% |

Discussion (1)
The Complete Guide to MT4 Indicators: Everything You Need to Know in 2026 - TradeCodeLabs
[…] Moving Averages (50, 200 SMA), Ichimoku Cloud, Fibonacci Retracement, RSI (14-period), Support and Resistance […]
Leave a Comment